
 Risk Capacity
 Wealth Management
 Outsourced CIO
 Retirement Plans
 Institutional
 Financial
  Open an Account
 IFA App

 Articles
 Charts
 Investor Education ▾
 Fund
Fund
 Store
Store

 Taxes
Taxes Back-testing Disclosures
 Glossary
 Form CRS
Thinking of taking some chips off the table before the next crash? A new Yale study helps explain why crash fears can look very different from market prices — and why a potentially more useful response is to make sure your portfolio can survive the fall you fear.
Here's a way to put a number on your fear of a stock market crash. Nobel laureate Robert Shiller has been asking wealthy and institutional investors this question for more than three decades. Answer it before you read on:
"What do you think is the probability of a catastrophic stock market crash in the U.S., like that of October 28, 1929 or October 19, 1987, in the next six months, including the case that a crash occurred in the other countries and spreads to the U.S.? (An answer of 0% means that it cannot happen, an answer of 100% means it is sure to happen.)"
Got a number?
Between 1996 and 2025, Shiller's respondents put the average chance of a catastrophic crash within six months at 19 percent.
Option prices tell a different story. Options are contracts whose payoffs depend on how the market moves, and their prices can be used to infer a market-implied benchmark for crash risk. On that basis, the implied chance of the S&P 500 falling 20 percent or more within six months averaged 5.6 percent. The comparison isn't exact, because Shiller's survey never defines "catastrophic." Even so, the survey figure was higher in every month of the sample, and the gap widened over time, mainly because survey responses became more pessimistic.
Why Crash Fears Run High
An earlier study by Goetzmann, Kim and Shiller offers a clue. In their 2016 paper, investors' crash estimates rose after recent market declines and when adverse market events received more attention in the financial press. Even unrelated shocks such as earthquakes were associated with higher crash estimates.
The authors say the evidence is consistent with availability bias. Events that are vivid and easy to recall can feel more likely than they really are. That matters because scary headlines are unavoidable when markets or politics feel uncertain. With the midterm elections weeks away, the temptation to turn that unease into an investment decision may feel especially strong.
Against that backdrop, a new working paper from Yale's Cowles Foundation, by Goetzmann, Kim and Shiller, asks a different question. Who is most fearful, and how do their beliefs relate to the prices investors actually trade at?
Who Steps Back From Stocks
The gloom in Shiller's survey is concentrated among respondents who advise being less invested in stocks. The survey asks whether this statement is true or false:
"Although I expect a substantial rise in stock prices in the U.S. ultimately, I advise being less invested in stocks for the time being because I think that prices are likely to drop for a while."
Read the opening clause again. It captures the classic market-timing impulse: stocks for the long run, just not right now. In Step 4 of Mark Hebner's Index Funds: The 12-Step Recovery Program for Active Investors, he calls investors who try to act on that impulse "time pickers."
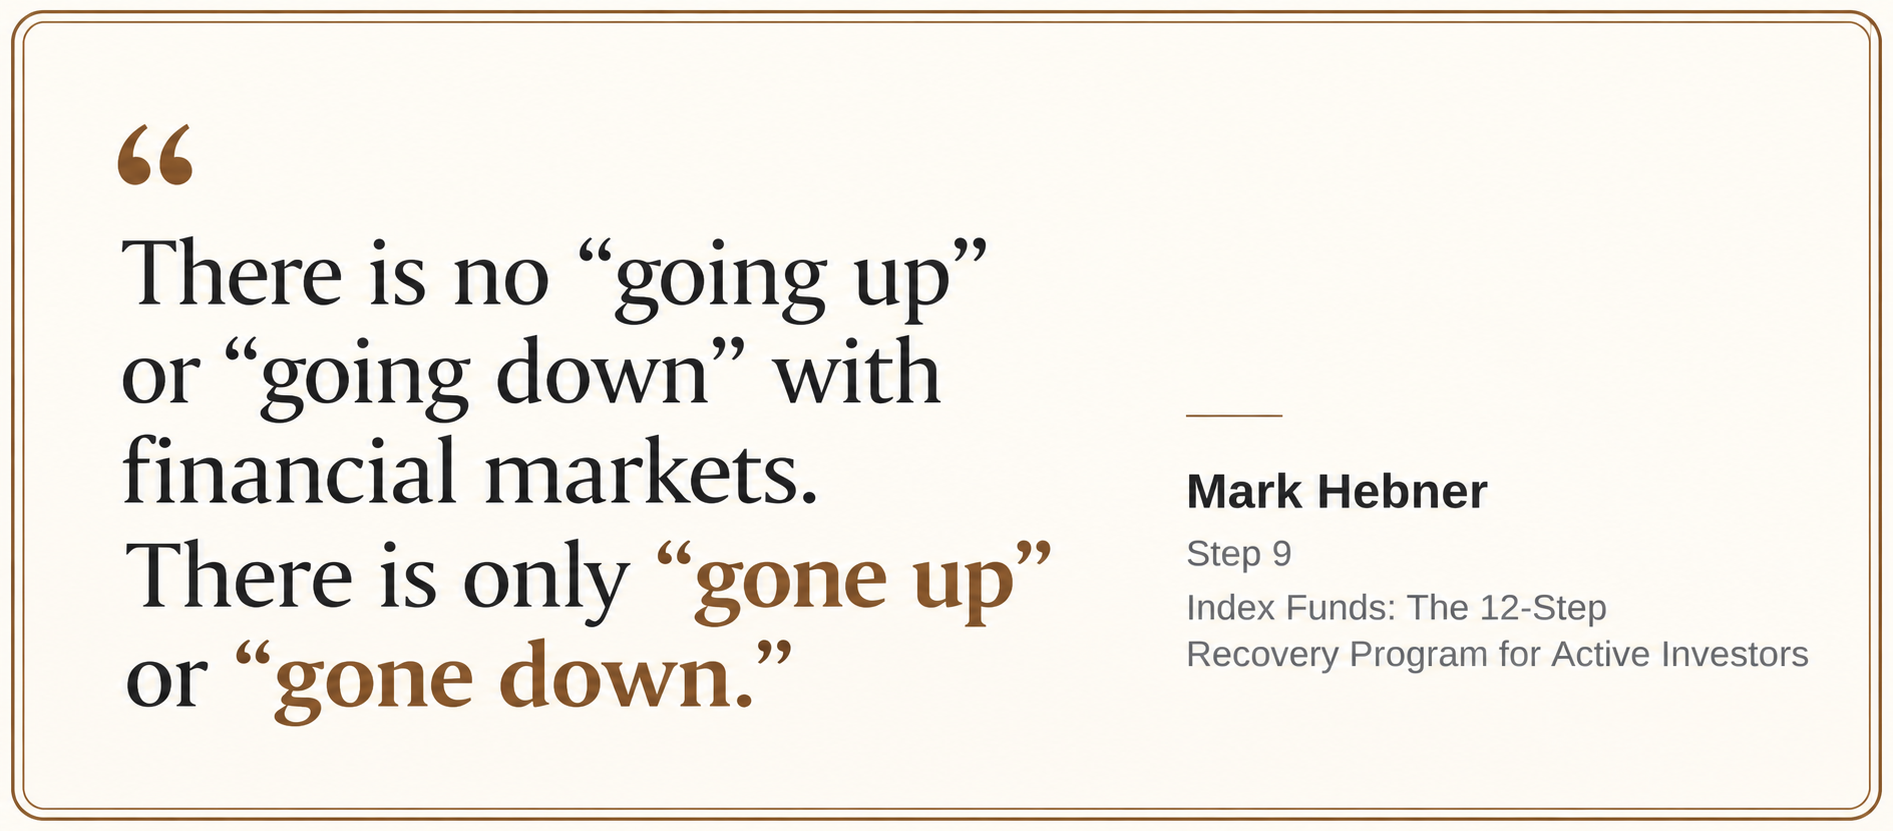
If you've been showing time-picking tendencies yourself, you're in large company. On average, 31.3 percent of respondents answered "True." At the height of the financial crisis, close to 80 percent did. The share was high again during the 2022 decline.
That advice was reflected in fund flows, at least in aggregate. Months when more respondents advised being less invested were followed by larger outflows from equity mutual funds over the next six months.
The survey also asks respondents what return they expect over the next six months. Those who thought a crash was more likely also tended to expect lower returns.
Across all respondents, the average forecast was for stocks to rise 1.4 percent over six months. Option prices implied at least 4.2 percent. But that average masks an important split.
Respondents who advised being less invested expected stocks to fall 1.2 percent over six months. Those who didn't expected a 3.3 percent gain. On the same days, option prices implied a 4.3 percent gain.
"The participating group holds beliefs that coincide with the price," the authors write, "while the non-participating group is furthest from it."
Crash fear was also closely tied to the advice to step back. Respondents who put higher odds on a crash were more likely to advise being less invested, even after allowing for their return forecasts. That is an association, not proof that fear caused the advice. But the pattern is clear: greater crash fear went with advice to step back, and those respondents held views furthest from market prices.
Why Gloom Can Precede Better Returns
This connects with an older puzzle about investor expectations. In a 2014 study, Harvard's Robin Greenwood and Andrei Shleifer examined six investor surveys. Expectations tended to rise after strong markets and were strongly negatively correlated with model-based measures of expected returns. Their explanation was extrapolation: investors tend to project recent market performance into the future.
The new Yale paper finds a related pattern in Shiller's data. When respondents expected higher returns, the market tended to deliver lower returns over the next six months. A one-standard-deviation rise in expected returns was associated with a 1.6 percentage point fall in subsequent six-month returns. Forecasts implied by option prices pointed the other way and were much more strongly related to what happened next.
The authors' explanation turns on a simple distinction. A survey gives every respondent one vote. Prices reflect the investors who actually hold the market's risk. When fearful investors step back, the risk they give up has to be borne by those who stay. The authors argue that those investors then require a higher expected return for carrying more of it.
The evidence leaned the authors' way. The further survey forecasts fell below the returns implied by option prices, the better the market tended to perform over the next six months, especially when more respondents were advising investors to step back.
In the authors' words, the survey and option-implied measures diverge "because the set of investors bearing risk changes, rather than because the investors setting prices have erred."
That distinction matters for IFA. Greenwood and Shleifer's behavioral model concludes that "markets are not efficient." The new paper shows how a gap between survey beliefs and market prices can arise without assuming that the investors setting prices have made a mistake. That sits more comfortably with IFA's Fama-influenced view of markets, in which market prices incorporate available information, and with Hebner's Step 12 warning against assuming that prices are not "fair at all times."
That doesn't mean today's price will look right with hindsight. It means an investor has no reliable basis for assuming he knows better than the market.
What the Yale Study Can't Tell You
The Yale working paper has important limits, and the authors acknowledge them.
It's a working paper, not yet peer reviewed. Each month's survey reaches a largely different group of respondents, so the study doesn't follow the same people over time. "Stepping out" means agreeing with a statement about advice; the researchers don't observe actual trades or investment returns. So the paper can't tell us whether those who advised stepping back lost money, or whether those who stayed invested did better. The data are US only, and both option-based benchmarks depend on modeling assumptions.
One misreading is especially tempting. If gloomy surveys have tended to come before better returns, why not buy when everyone else is scared? The relationship is too weak to trade on, and the paper offers no trading rule. Buying because others are frightened is still a forecast. It's market timing with the sign flipped.
What to Do About Crash Fear
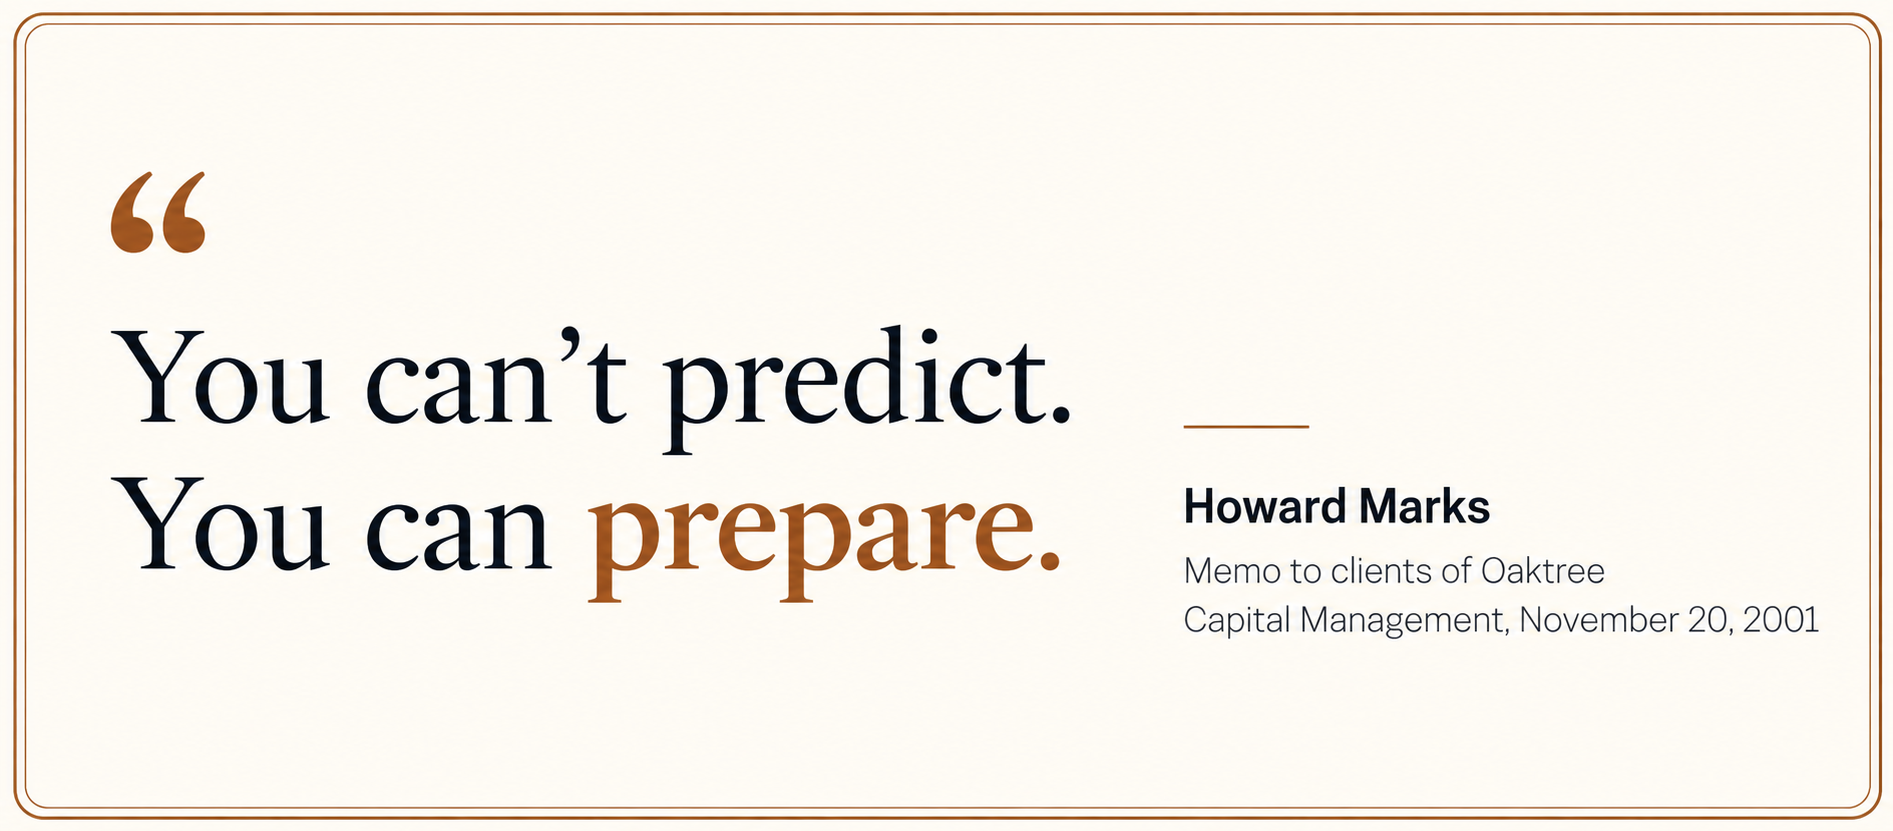
Treat fear of a market crash as a prompt to check your allocation.
Start with a simple test. If a 20 percent market fall would make you sell, that may indicate that your stock allocation is too high for your capacity for risk. That may be worth reviewing once, deliberately, with an advisor. It is very different from trimming stocks because you fear an election, recession or crash. Selling can make sense when your circumstances or capacity for risk change. What the evidence argues against is moving money because of a forecast, your own or anyone else's.
The arithmetic of market timing is unforgiving. You have to be right twice: first about when to get out, and then about when to get back in. Getting either decision wrong can leave you worse off than simply staying invested.
That leads to three practical steps.
First, consider discussing a Ulysses pact with an advisor, including deciding in advance what you'll do if stocks fall 20 percent. In Hebner's analogy, the investor is Ulysses and the advisor is the crew: When fear urges you to abandon the plan, the advisor's job is to help you evaluate the decision against the plan you made when you were calm.
Second, rebalance by rule. If a fall pushes an investor's stock allocation below its target, a predetermined rebalancing rule may call for purchases intended to restore the target allocation. No forecast is involved. Prices may keep falling after you rebalance. That is what separates disciplined rebalancing from contrarian market timing.
Third, consider asking an advisor two questions: How was my stock allocation decided? What happens to my financial plan if markets fall sharply? Treat anyone who claims to know when the next crash is coming as a red flag.
IFA starts with risk capacity. Step 10 of Hebner's book assesses five dimensions: time horizon, attitude toward risk, investments, income and investment knowledge. The resulting score is then used as part of IFA's process for identifying an appropriate level of risk exposure. IFA's portfolios are globally diversified, built from index funds and rebalanced with discipline.
The goal isn't to eliminate uncertainty. It's to build a portfolio and a plan that let you follow Step 12: Invest and Relax.

Back to Your Crash Probability
So, what probability did you give at the start for a catastrophic crash within six months?
If your answer was well above 5.6 percent, you were in good company. Shiller's respondents were much more pessimistic, on average, than the market prices implied by options. The new study suggests that the investors with the gloomiest views were also more likely to advise stepping back from stocks.
But Shiller's question asks you to predict the market. For building a portfolio, a different question is more useful. Step 10 of Hebner's book gives this sample question from IFA's Risk Capacity Survey:
"What is the worst 12-month percentage loss you would tolerate for your long-term investments, beyond which you would be inclined to sell some or all of your investment?"
If you don't know your answer, consider taking our survey before a future market decline tests it for you.
Resources
- Goetzmann, W. N., Kim, D., & Shiller, R. J. (2026). "Non-marginal" investor beliefs (Cowles Foundation Discussion Paper No. 2558). Cowles Foundation for Research in Economics, Yale University.
- Greenwood, R., & Shleifer, A. (2014). Expectations of returns and expected returns. Review of Financial Studies, 27(3), 714–746.
- Hebner, M. T. (2023). Index funds: The 12-step recovery program for active investors (20th anniversary, 10th ed.). Ballast Books.
- Ptak, J. (2026). Mind the gap US 2026. Morningstar.
ROBIN POWELL is the Creative Director at Index Fund Advisors (IFA). He is also a financial journalist and the Editor of The Evidence-Based Investor. This article reflects IFA's investment philosophy and is intended for informational purposes only.
DISCLOSURES:
This article is for informational purposes only and does not constitute investment advice, an offer, or a solicitation to buy or sell any security. This material includes general educational information and should not be interpreted as individualized investment advice or a recommendation to take any specific action. Past performance is not indicative of future results. All examples and data cited are based on historical analysis and may not reflect future market conditions. Investing involves risks, including the possiblity of loss and principal. The mathematical principles and academic research discussed illustrate theoretical and historical concepts and should not be interpreted as guarantees of investment outcomes. Diversivication does not ensure profit or protect against loss.
Any discussion of regulatory actions is based on publicly available information and should not be interpreted as representative of industry-wide practices. There is no guarantee that reducing turnover or fees will result in improved investment outcomes.
The information discussed is general in nature and may not be suitable for all investors. Examples and studies cited reflect specific time periods and may not be representative of all market conditions or investor experiences. Individual circumstances vary, and readers should consult a qualified professional regarding their personal situation. Index Fund Advisors, Inc. (IFA) believes the information to be accurate but does not guarantee its completeness or accuracy. This article was sourced and prepared with the assistance of artificial intelligence (AI) technology.For more information about Index Fund Advisors, Inc, please review our brochure at https://www.adviserinfo.sec.gov/ or visit www.ifa.com.
Past performance doesn't guarantee future results. IFA's methods are research-based, but outcomes aren't guaranteed. This article is for educational purposes only and isn't personalized investment advice. Market-implied probabilities and expected returns are estimates derived from models and assumptions, may change, and are not forecasts or guarantees of actual market outcomes.















 Home
Home 888-643-3133
 Contact Us
 Newsletter Subscribe
 eMoney
 IFA Apps
 Index Funds Book on Kindle
 Index Funds Audiobook
 Careers
 Facebook
 X
X LinkedIn
 Instagram
 Youtube
 Terms
Terms Index Descriptions