


Galton Board Proficiency Test
Created by Art Forster with AI assistance
CATEGORY 1 - SIR FRANCIS GALTON AND HIS GALTON BOARD
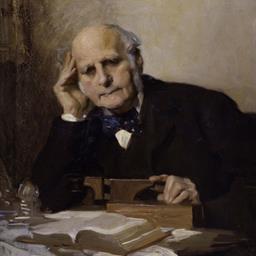
Sir Francis Galton FRS (Fellowship of the Royal Society) (1822-1911) was a polymath who made important contributions to the fields of statistics (regression, correlation, and the Galton Board), biology (heredity), meteorology (weather maps), psychology (psychometrics), criminology (fingerprints), and eugenics. He was the first to apply statistical methods, the normal distribution, and the questionnaire to the study of human populations. Portrait by C. W. Furse, 1903.
In 1873, he built his Galton Board to dynamically create an ordered binomial distribution from bead flow chaos for the public to see. He described his Galton Board - his "quincunx," as he called it - as a "mechanical illustration of the cause of the curve of frequency." The binomial distribution can be approximated by a normal distribution or the "curve of frequency" when the number of trials n is large enough that the distribution is statistically symmetric as in a level Galton Board with at least 10 rows of pegs. The normal distribution occurred in so many areas of Galton's studies that he wanted the public to be aware of and appreciate the importance of this distribution. Even he was surprised at the "order out of apparent chaos" his Galton Board beads produced. He first demonstrated his Galton Board at a talk to the Royal Institution on February 27, 1874.
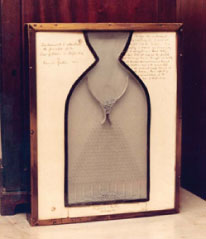
The pegs are in quincunx pattern, which is like the side of a die with 5 spots. The Galton Board consists of interleaved rows of pegs in this pattern so a bead will interact with a peg in one row and fall onto the peg in the next row. Below is the original Galton Board with Galton's handwritten instructions. The board was manufactured by Tisley and Spiller in 1873 and has 19 rows of pegs and 10 bead bins.
Yes. The peg shape and spacing influences the way the beads bounce and the paths they take. Hexagonal pegs as opposed to cylindrical pegs seem to be a good choice because they naturally provide vertical channels for the bead flow. Different-sized beads will have different paths (e.g., streaming) for a fixed peg structure. This video shows that the bead distribution becomes flatter as the bead size decreases for this Galton Board with square pegs: Galtonboard / Galtonbrett Simulation (or Bean machine or quincunx or Galton box) The design goal is to find a peg-bead geometry that allows each bead to hit a peg on the next row and not stream past it or get stuck. Sir Francis Galton spent several months experimenting with different peg and bead geometries before he released his final design to Tisley & Spiller in 1873.
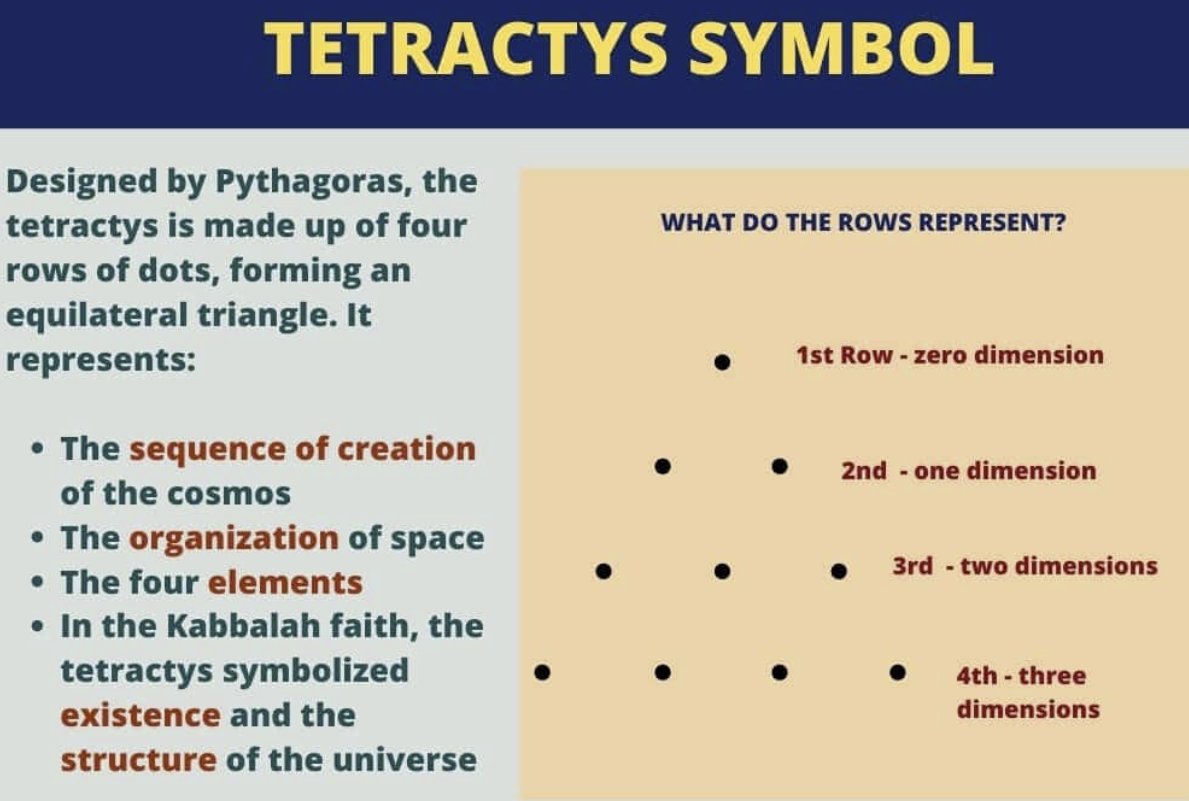
The Tetractys is a triangular figure associated with the ancient Greek philosopher Pythagoras (c. 570-495 BCE). It is an equilateral triangle with ten points arranged in four rows with one, two, three, and four points in each row. The Tetractys is equivalent to the first four rows in a Galton Board. It was an important symbol in Pythagorean philosophy that embodies the geometric, arithmetic, and musical ratios that form the foundation of the universe. The Tetractys also represents the four classical elements earth, air, fire, and water, as well as the number ten, which symbolizes unity and perfection. It is still studied by historians and used by spiritual practitioners today. The Tetractys is currently available in jewelry, clothing, art pieces, and in use as a company name.
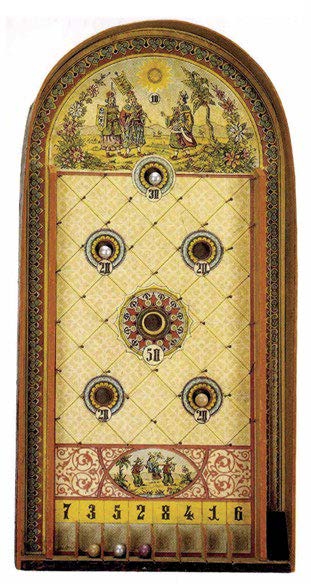
Most likely he used the bagatelle board game as a model for his Galton Board. It had rows of pegs in a quincunx pattern that a ball would bounce off of as it traveled down the board. Below is a Rocks of Scilly bagatelle board from the early 1800's.
The beads move in a helter-skelter, chaotic fashion as they fall through the Galton Board to produce an ordered binomial bead distribution that approximates the normal distribution. Galton called this bead behavior creating "order out of apparent chaos."
"I know of scarcely anything so apt to impress the imagination as the wonderful form of cosmic order expressed by the 'Law of Frequency of Error.' The law would have been personified by the Greeks and deified, if they had known of it. It reigns with serenity and in complete self-effacement amidst the wildest confusion. The huger the mob, and the greater the apparent anarchy, the more perfect is its sway. It is the Supreme Law of Unreason."
Quincunx, bean machine, or Galton Box. In the Philosophical Transactions of the Royal Society of London (1895), Karl Pearson called his modified Galton Board a "probability machine", a "binomial machine", and a "14-power binomial machine" since it had 14 rows of pegs.
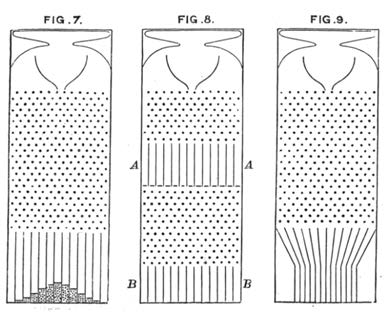
Yes. He designed a two-stage Galton Board (Fig. 8) that produced a discrete representation of the normal distribution in the first stage. This bead distribution was then used as a source for a second stage underneath, which also created a discrete representation of the normal distribution. He thus showed that a mixture of normal distributions was also normally distributed. A third version (Fig. 9) was a one-stage Galton Board that has chutes to change the width of the bead distribution. He published his three versions in his book, Natural Inheritance, 1889:
Yes. Sir Francis Galton realized that it was important to be able to test various statistical theories on hypothetical data sets drawn from a normal distribution. In 1890, he published a paper in Nature where he used the 24 edges of a six-sided die to sample 24 different equally probable normal distribution values larger than the mean. The last 3 normal distribution values were sampled with a second die to obtain better sampling of the low probability, more extreme values. A third die was then used to determine if the sampled value is above or below the mean.
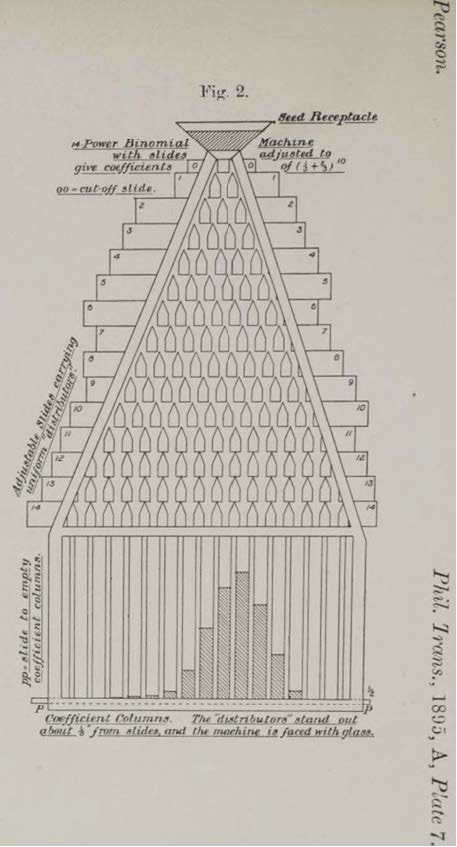
Yes. in 1895, Karl Pearson created the Galton-Pearson Board (Fig. 2) to produce skewed bead distributions. He called this Galton Board a "14-power binomial machine" because it had 14 rows of pegs.
Galton meant that even though each bead’s path is chaotic and unpredictable, the overall pattern of beads in the bins converges to a highly ordered, mathematically predictable shape: the binomial distribution, which for many rows is well approximated by a normal (bell shaped) curve. This emergent order reflects fundamental laws of probability, including the law of large numbers and the central limit theorem.
Each bead's path is random—no one can know in advance which bin a given bead will land in. The overall distribution of many beads is predictable and follows precise probabilistic laws. This combination of unpredictable individual outcomes (the golden bead) and stable aggregate patterns makes the Galton Board a powerful model for understanding phenomena like market returns, test scores, and many other real world processes.
Galton originally used his "quincunx" to illustrate two ideas in heredity: the emergence of the normal curve from population variation, and regression toward the mean, the tendency for offspring of extreme parents to have measurements closer to the population average. For Galton, the board was primarily a biological tool. Modern uses are broader. Educators use it to teach the binomial distribution, the central limit theorem, and the law of large numbers. In finance, it illustrates why individual market returns are unpredictable while long-run averages are stable. The IFA Galton Board extends this by overlaying historical market-return data directly on the bell curve, connecting probability theory to real investment outcomes.
Abraham de Moivre (1667-1754) was a French born mathematician who worked in probability and is known for the de Moivre-Laplace theorem. He showed that when you repeat a simple binary random process—such as left or right bounces at pegs—the resulting binomial distribution is increasingly well approximated by a normal distribution as the number of trials grows, providing theoretical support for the bell shaped pattern produced by a Galton Board.
CATEGORY 2: SOME STATISTICAL TERMS
Probability is the likelihood of a result occurring from a random event; e.g., flipping a coin has two equally possible outcomes - heads or tails. The normal and binomial distributions are probability distributions. Statistics is the study of collecting, analyzing, interpreting, and presenting a set of data. Statistical analysis relies on probability theory, and probability theory is informed, tested, and validated through statistical analysis. The Galton Board is a unique device because it involves both probability, in the chaotic interactions of beads, and statistics, as the beads are collected and displayed in the bead bins at the bottom.
A population includes all the members of a data set unless the data set is infinite. A sample is a subset of the data in a population. If the sample is representative of the population, then the sample data set can be used to infer characteristics of the entire population using statistical analysis techniques.
The mean is the expected value of a distribution or the arithmetic average of a set of data. The standard deviation is a measure of the amount of spread of the data about the mean.
Usually, mu is the mean for a population and x_bar is an estimate of mu based on the arithmetic average of a representative sample. Sigma is the standard deviation of the population and S is an estimate of sigma based on the data from a representative sample.
The equation for the arithmetic average or mean x_bar of n samples is
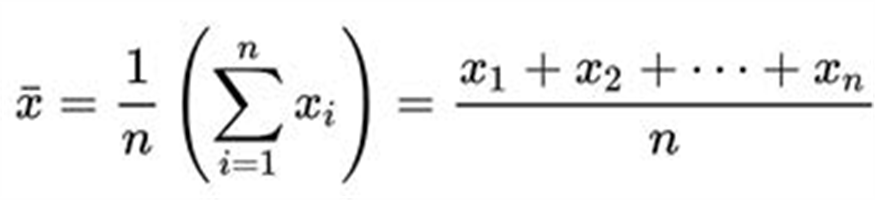
x_bar is an estimate of mu for a representative sample of a population. If the data set is the entire population N, then sigma is
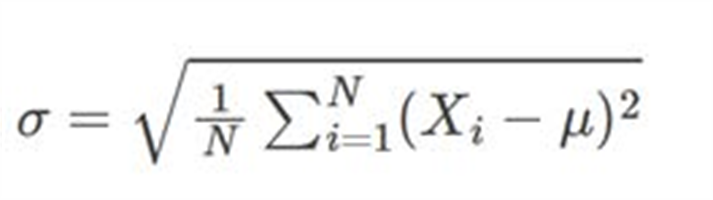
The equation for the standard deviation of the sample S is
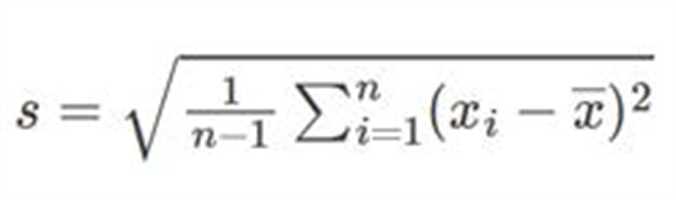
Bessel's correction of n-1 is used for the sample standard deviation to correct for a bias that exists in the estimate in S.
A quantity whose value is based on random events. A random variable can be discrete or continuous. A discrete random variable has a finite number of distinct values. A binary random variable is a subset of discrete random variables that has only two possible values. Examples of a discrete random variable would be the number of customers who entered a store on a given day or the number of home runs hit by a team in a season. A continuous random variable has an infinite number of possible values. Examples of a continuous random variable would be the heights and weights of adults. The Galton Board random variable is a discrete binary random variable because each sampling of the bead interaction with a peg has only two possible outcomes: a move left or a move right.
The variance is the square of the standard deviation. It is a convenient quantity to use because the variance of the sum of random variables is the sum of their variances. The variance does not have the same units as the random variable, which is the reason the standard deviation is the preferred unit of data dispersion.
A Bernoulli trial, named after 17th century Swiss mathematician Jacob Bernoulli, is a random event with only two possible outcomes. By definition, each Bernoulli trial must be independent of all other trials. A bead bouncing off a peg in a Galton Board is one Bernoulli trial. A bead bouncing off of n rows of pegs is a series of n Bernoulli trials that will produce a binomial distribution of beads with n+1 probability values from 0 successes to n successes, where success is defined as a move to the right.
A coin flip and any yes/no question.
The law of large numbers says that the average of a large number of independent and identically distributed (IID) random samples converges to the true value, if it exists. There is no indication how close this average is to the true value. The central limit theorem states that for a random variable with mean mu and population standard deviation sigma, the estimated mean will be normally distributed for a "large" sample size of IID random variables. The underlying random variable can be any distribution as long as the mean and standard deviation exist. When the central limit theorem applies, confidence intervals can be formed around the sampled mean that will include the true mean the expected fraction of the time.
The central limit theorem, which states that a sample mean of a random variable will converge to a normal distribution for a "large" sample. Since a Galton Board bead interaction with a peg is a Bernoulli trial with a 50% probability of going left or right, a bead that has 10 or more Bernoulli trials will satisfy the "large" sample requirement of the central limit theorem and the estimated value will be normally distributed. Each bead in the Galton Board provides a repeated sample of the normally distributed random bead value, which demonstrates the central limit theorem. The beads form a binomial bead distribution from the n Bernoulli trials, which can be approximated by a normal distribution, as stated in the de Moivre-Laplace theorem, when there are 10 or more Bernoulli trials.
Regression to the mean says that if one sample of a random variable is extremely large or small, the next sample of the random variable will likely be closer to the mean. Assume that the golden bead in the Galton Board ended up in one of the edge bead bins. The expectation would be that the golden bead would fall into a bead bin closer to the center bead bin on the next cycle.
A probability density function (PDF) is a function f(x) such that the probability of the continuous random variable x falling in any interval [a, b] is the area under the curve from a to b. A PDF is non-negative everywhere, and the total area under the PDF curve is equal to 1. The bead bin histogram in the Galton Board is a discrete approximation to the normal PDF. The relative frequency of beads in each bin estimates the probability of a bead falling into that bin. As the number of beads increases, the histogram increasingly resembles the smooth normal PDF overlaid on the Galton Board face.
A confidence interval is a procedure that uses sample data to produce a range of plausible values for a population parameter. The procedure is designed so that, in the long run, a specified proportion of the intervals generated from repeated samples (such as 95%) will contain the true, fixed value of the parameter. The golden bead in a Galton Board illustrates why such intervals are needed: any single sample result varies randomly from run to run and therefore does not reveal the exact center of the underlying distribution. For example, if repeated samples yield an estimated mean landing position of 50 with a standard error of 1, then a 95% confidence interval would be approximately 50±2 or 48 to 52. If we repeated the entire sampling process many times, and constructed a 95% confidence interval from each sample, about 95% of those intervals would contain the true center of the distribution.
With only a few beads, the histogram can look lumpy because each individual path is random and sampling noise is large. As more beads are dropped, the law of large numbers drives the observed frequencies in each bin toward their true probabilities, smoothing out fluctuations and revealing the underlying binomial distribution, which for many rows is approximately normal.
Regression to the mean is a real statistical phenomenon: extreme outcomes are probabilistically likely to be followed by more average outcomes because these typical results are more common. The gambler's fallacy is the mistaken belief that past independent outcomes (for example, a streak of reds at roulette) make the opposite outcome “due” on the very next trial, even though each trial's probability is unchanged. Both involve sequences where extremes are followed by more typical results, but regression to the mean correctly attributes this to underlying probabilities over many trials, whereas the gambler's fallacy incorrectly assumes that probability must “balance out” immediately. On the Galton Board, the cycle to cycle variation in the golden bead's position shows extremes naturally giving way to more central locations over many samples.
CATEGORY 3: THE BINOMIAL DISTRIBUTION
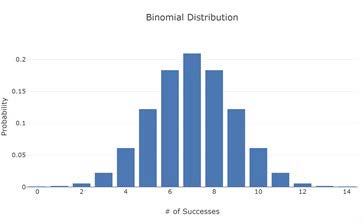
A binomial distribution is a discrete probability distribution for the successful outcomes of a fixed number of n Bernoulli trials. Each trial has a constant probability of success p. n coin flips or a bead bouncing off of n rows of pegs in a Galton Board have p = 0.5, which will create a symmetric binomial distribution with n+1 values. The Galton Board binomial bead distribution would be the number of bead moves to the right from 0 to n. Below is a symmetric (p = 0.5) binomial distribution for n = 14 showing the probabilities for the number of successes ranging from 0 to 14. The sum of the 15 probabilities is one.
The two parameters are the number of Bernoulli trials n and the probability of success p, however success is defined, for each Bernoulli trial. For coin flips and beads bouncing off of pegs in a level Galton Board, p = 0.5, which produces a symmetric binomial distribution.
Both the number of Bernoulli trials n and the probability of success p are defined for each situation. For a level Galton Board, n would be the number rows of pegs and p = 0.5.
Defining n as the number of Bernoulli trials, p as the probability of success, and k as the number of successes in the n Bernoulli trials
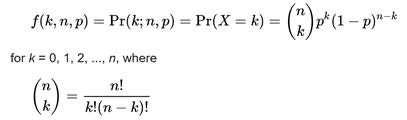
The

notation represents n+1 numbers that are called the binomial coefficients in the binomial expansion. The binomial distribution f(k,n,p) will only be symmetric when p = 0.5, which is the case in a level Galton Board.
The mean is n*p and the standard deviation is sqrt[n*p*(1-p)].
A symmetric binomial bead distribution because each bead goes through n independent Bernoulli trials by the n rows of pegs with p = 0.5 in the Galton Board. A binomial distribution is the probability distribution of the number of successes from n Bernoulli trials. Therefore, the Galton Board produces a binomial bead distribution that represents the n+1 probabilities of a bead moving to the right from 0 times to n times. The mean is n/2 and the standard deviation is sqrt(n)/2.
f(k,n,0.5) = n!/[k! (n-k)!2**n] .
where k is the number of right moves off of the pegs from 0 to n. The binomial distribution for a Galton Board is the normed binomial coefficients.
There are 14 rows of pegs in the IFA Galton Board, so the number of Bernoulli trials n is 14. The probability of success p is defined as a bead moving to the right with p = 0.5. The binomial distribution for the IFA Galton Board is
f(k,14,0.5) = 14!/[k!(14-k)!*2**14] = 14!/[k!(14-k)!*16384]
where k ranges from 0 to n. k is number of bead moves to the right in 14 Bernoulli trials. This binomial distribution has 15 bins with the center bin (k = 7) having the largest probability value of 0.2095. The edge bin probabilities (k = 0 and k= 14) are 0.00006103.
CATEGORY 4: THE NORMAL DISTRIBUTION
A symmetric continuous probability distribution f(x) for a real-valued random variable x that is completely defined by two parameters mu and sigma:
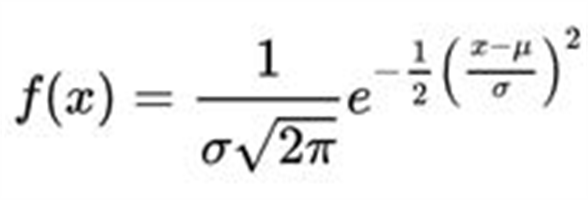
The normal distribution has one peak value at x = mu.
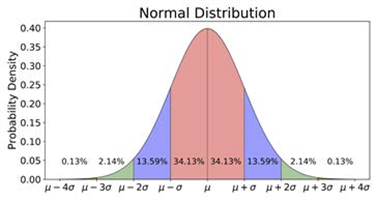
Two examples of data that are normally distributed are the height and IQ of human beings.
The mean mu and the standard deviation sigma.
The mean mu is the arithmetic average of the N values mu = sum(x_i)/N = (x_1 + x_2 +...+ x_N)/N
and the standard deviation sigma of the N values is
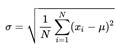
This distribution of random variables appears in many areas of the natural, social, and financial sciences. The normal distribution is often used in hypothesis testing to reject or not reject the null hypothesis about a data set.
The Gaussian distribution and the bell-shaped curve.
68%, 95% and 99.7%. The area under a normal distribution is one.
The special case of mu = 0 and sigma = 1. Any normal distribution can be converted into a standard normal distribution by defining a new variable z = (x-mu)/sigma. Then, Phi(z) would be:
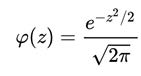
The central limit theorem relates probability theory to random sampling. The theorem states that the distribution of the sampled mean of a random variable is normally distributed when there are enough IID random samples of the random variable. Since a Galton Board bead interaction with a peg is a Bernoulli trial with p = 0.5, 10 or more Bernoulli trial samples for a bead are enough for the bead value to satisfy the requirements of the central limit theorem and to be normally distributed.
Entropy is a quantitative measure of disorder, randomness, or chaos in a system. Entropy is used in many disciplines including physics, chemistry, biology, information theory, and economics. An ordered system has low entropy and a disordered system has high entropy. Entropy in isolated natural systems tends to be in its most disordered or maximum entropy state. Maximizing entropy can be used to determine what mathematical distribution a natural process likely prefers for a specified variable and its numerical constraints.
Yes. The symmetric bead distribution at the bottom of a Galton Board has both a fixed finite mean and variance (each bead can only move so far left or right). As in nature, the beads will want to be in their most disordered or maximum entropy state. The mathematical function with a fixed finite mean and variance that maximizes entropy is the normal distribution. Therefore, maximum entropy predicts that the chaotic bead flow in a Galton Board will produce a normal distribution of beads. The central limit theorem is not required. See Entropy and the normal distribution for a more detailed explanation.
The answer is that the Galton Board bead distribution has two numerical constraints: a finite mean and variance. If there was only one bead bin (perfect order and zero chaos), the entropy would be zero. Maximum entropy (MaxEnt) means that there is maximum disorder or chaos. The MaxEnt function depends on the numerical constraints. For example, if only the sum of the bead bin probabilities is known to be unity, then MaxEnt predicts a uniform distribution. If only the mean is known, MaxEnt predicts a Poisson distribution. Since the Galton Board beads have two constraints, MaxEnt predicts a normal distribution. Therefore, maximum disorder and chaos concerning which Galton Board bin a bead falls into occurs for a normal distribution.
Since only the bead bin mean is known, maximum entropy predicts a discrete Poisson distribution of beads from cycle to cycle. The standard deviation of the Poisson distribution is the square root of the mean. So counting statistics can be used to estimate the expected cycle-to-cycle variation in the number of beads in one bead bin. The shape of the Poisson distribution depends on the mean. When the mean is greater than 10, the Poisson distribution is well approximated by a normal distribution with the same mean and standard deviation.
They are the same. Both approaches require the bead distribution to have a finite mean and variance.
Yes, there are many statistical tests available to assess the normality of a data set. Some of these tests are the Shapiro-Wilk, Kolmogorov-Smirnov, and the Anderson-Darling tests.
For a symmetric Galton Board with n rows and a left/right probability of 0.5, the expected number of right moves is n/2, which corresponds to the center bin where the histogram peaks. The spread of the beads around this center is measured by the standard deviation √(n · 0.5 · 0.5) = √n / 2, which aligns with the standard deviation markers printed under the curve on the IFA Galton Board. As the number of rows n increases, the distribution remains centered at the middle bin — reflecting a fixed mean of n/2 — while the spread widens in proportion to the standard deviation of the binomial distribution for p = 0.5.
CATEGORY 5: COMPARING THE BINOMIAL AND NORMAL DISTRIBUTIONS
They are both probability distributions. The binomial distribution is a discrete distribution and the normal distribution is a continuous distribution.
They are both probability distributions that require two parameters. The sum of the binomial distribution probabilities is one and the area under the normal distribution curve is one.
The binomial distribution has a fixed number of discrete probability values with a finite range. The normal distribution has continuous values with an infinite range. The binomial distribution is only symmetric for p = 0.5 and the normal distribution is symmetric by definition. The binomial distribution is used for calculating the 0 to n successes out of n Bernoulli trials while the normal distribution is used for calculating the probability that a random variable value is in a specified range of values relative to the mean.
The binomial distribution has a finite range of the number of successes from 0 to n where n is the number of Bernoulli trials. The normal distribution has infinite range.
The de Moivre-Laplace theorem says that a normal distribution is a good approximation to a binomial distribution when np and n(1-p) > 5. These two conditions form one commonly used criterion for satisfying the de Moivre-Laplace theorem. For a level Galton Board, p = 0.5 and n, the number of rows of pegs, should be greater than 10. Below is a coplot of the symmetric binomial distribution for n = 14 and the associated normal distribution.
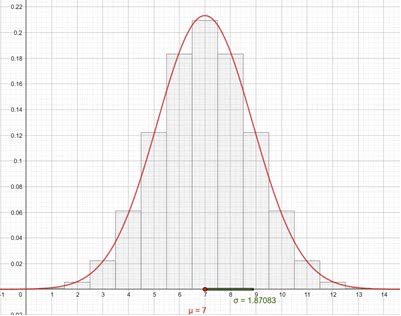
In the past, it was easier to calculate the probability for an interval of data for a normal distribution than for a binomial distribution because interval tables for the normal distribution were readily available.
The binomial distribution is used in situations where the outcome is binary, such as quality control. The normal distribution is used in situations where the outcome is continuous, such as in the sciences. The normal distribution is also used to approximate discrete binomial distributions when np and n(1-p) > 5, which is the case with the Galton Board.
CATEGORY 6: PASCAL'S TRIANGLE
They are the numbers that appear in the order n binomial expansion of (a+b)**n. For example,
(a+b)**4 = a**4 + 4a**3b + 6a**2b**2 + 4ab**3 + b**4.
The binomial coefficients for n = 4 are 1, 4, 6, 4, 1, which are the 5 numbers in row 4 of Pascal's triangle. The binomial coefficients for order n are defined as
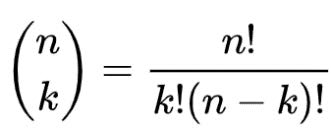
where k ranges from 0 to n inclusive.
It is a triangular array of binomial coefficients. The triangle is named after French mathematician Blaise Pascal (1623-1662), although several mathematicians studied versions of such triangles centuries earlier, including Pingala (c. 3rd-2nd century BCE), Halāyudha (10th century), al Karaji (c. 953-1029), Jia Xian (11th century), Omar Khayyam (1048-1131), Yang Hui (13th century), and Niccolo Tartaglia (16th century). Pascal's Traité du triangle arithmétique (Treatise on the Arithmetical Triangle) was published posthumously in 1665. Each entry is the sum of the two numbers directly above. Pascal's triangle contains many number patterns such as figurate numbers along the diagonals.
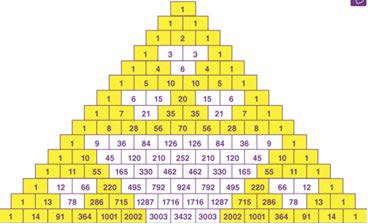
The top row is row 0, the next row is row 1, and so on. Pascal's triangle row numbers are in the second diagonal of Pascal's triangle. Row n has n+1 values. The first location in row n is defined as k = 0 and the last location is k = n.
Draw the 16 different bead paths (not shown) for a 4 row Galton Board.
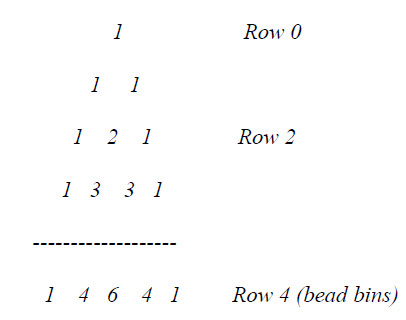
Binomial coefficients, binomial expansion, the binomial distribution for p=0.5, and combinatorics for n choose k.
A: In an ideal level Galton Board with n rows of pegs, a bead that lands in the k-th bin from the left (counting from k = 0) has made exactly k right bounces and n - k left bounces along its path. The number of distinct paths that produce this same outcome is the binomial coefficient:
which is precisely the entry in row n, position k of Pascal's triangle. For example, on the IFA Galton Board with n = 14 rows, the center bin (k = 7) has (
p = 0.5 for a level Galton Board. After falling through n rows of pegs in a Galton Board, the probabilities of a bead reaching one of the n+1 k locations in row n of Pascal's triangle is the number of paths in the k-th location divided by the sum of the number of paths in row n = 2**n. This agrees with the f(k,n,0.5) shown in Section 3.6.
There are no references to Pascal's triangle on the galton.org website. Therefore, it appears that he did not use Pascal's triangle to explain the number of bead paths or probabilities for his Galton Board. In fact, no reference appears available that shows that Sir Francis Galton attempted any mathematical analysis of the workings of his Galton Board.
CATEGORY 7: THE GALTON BOARD
A device for "mechanically" demonstrating statistical experiments to create a binomial distribution of beads from a series of n chaotic Bernoulli trials, one trial for each of the n rows of pegs in a Galton Board. The normal distribution can be used to approximate the binomial distribution. Therefore, the Galton Board dynamically produces a discrete representation of the continuous normal distribution.
A Bernoulli trial because only two outcomes are possible: a move to the left or a move to the right.
Yes, because what happens to the bead on the next row of pegs is assumed to not depend on what happened on the previous row. This statement assumes that bead-bead interactions do not affect the row-to-row independence of the bead scatterings.
A Markov chain is a stochastic (random) process that represents a sequence of events where the probability of transitioning to the next state depends only on the current state and not on the sequence of states that preceded it. This attribute is known as the Markov property or being memoryless. Markov chains are used in a variety of situations because they can be designed to model many real-world processes including the Galton Board.
A random walk is a stochastic process where an object takes a series of random steps. There are different types of random walks including 1D, 2D, 3D, lattice, Gaussian, and Brownian motion. Random walks can be either Markovian or non-Markovian. They are often used to model chaotic systems in various fields such as physics, economics, and biology. Karl Pearson first used the term "random walk" in 1905. The first version of the IFA Galton Board in 2017 was named The Random Walker.
A Markov chain describes a memoryless random walk using a stochastic process to determine the sequence of steps in the chain. Therefore, a Markov chain always produces a random walk. However, random walks can also be non-Markovian if the probabilities for the next state depend on the history of how the object arrived at its current state.
The bead path in a Galton Board is called a Markovian random walk because each bead movement - a Bernoulli trial by each peg - only depends on its current location and not how it got there. The bead paths in a Galton Board therefore illustrate a series of Markovian random walks created by the assumed independent Bernoulli trials.
A random walk because it describes a random path a bead takes during its series of Bernoulli trials. The bead path is a series of n independent binary random events, one row at a time. Karl Pearson first used the term random walk in 1905. The first version of the current IFA Galton Board was named The Random Walker (2017).
Yes. The individual beads are considered to be Independent and probabilistically Identically Distributed (IID) random variables because they are all sampling the same probability distributions independently. This assumption ignores possible bead correlation effects such as bead-bead interactions.
A symmetric binomial distribution, which is the result of a series of n Bernoulli (binary) trials with p = 0.5. Each bead value, assigned by the bead bin in the Galton Board, is based on enough Bernoulli trials - 10 or more - so that its binomial distribution is well approximated by a normal distribution. Therefore, the beads in the Galton Board are each a sample from a normal distribution. A symmetric binomial distribution is a good approximation to the normal distribution when n is 10 or greater (de Moivre-Laplace theorem).
Yes. A bead's path through the n rows of pegs in a Galton Board is a visual physical representation of n coin flips resulting in 0 to n successes (e.g., heads). Each bead-peg interaction is assumed to produce a 50-50 chance that a bead goes left or right just as a coin flip has a 50-50 chance of producing a heads or tails. The final bead distribution can be interpreted as a statistical sample of the binomial distribution for n Bernoulli-trial coin flips. The Galton Board can also be used to model any other 50-50 Bernoulli-trial process such as a die throw being odd or even.
Two important considerations are the number of rows of pegs and the number of beads in the Galton Board. There must be at least ten rows of pegs to satisfy the conditions of the central limit theorem for each bead. There must be enough beads to produce a good representation of the binomial distribution. In addition, the pegs must be uniformly spaced and the beads must be of equal size and weight. The bead size must be smaller than the peg spacing, but not too small to prevent bead streaming through the Galton Board. The bead reservoir should emit the beads onto the first peg only. The beads should flow without getting stuck and should be constrained to not leave the Pascal's triangle boundary if Pascal's triangle probabilities are to be preserved.
So the probability of success p is assumed to be exactly 0.5 to produce a symmetrical binomial bead distribution.
The X-axis is the value of the random variable x that usually is in units of sigma from the mean mu. The left Y-axis is the value of the probability density function f(x). The maximum value of f(x) occurs at x = mu. If sigma is one, then the maximum value of f(x) = 1/sqrt(2*pi) = 0.3989.
The bead bins must all be of the same width to produce the bell-shaped curve of beads. If the bead bins boundaries are located directly under the last row of pegs in the Galton Board, then the bead paths from Pascal's triangle can be used to calculate the probability of a bead falling into each bead bin. If the Galton Board is not well designed, then the bead flow will not follow the Pascal's triangle bead paths and probabilities. Such a Galton Board will usually still satisfy the minimum requirement of producing order out of bead chaos. If more bead bins are desired than the number of rows of pegs + 1, then their probabilities can be calculated from the normal distribution fit to binomial bead distribution using the sigma ranges for each bead bin to determine their probabilities.
Most likely are the bins at the center because there are many more different bead paths to get there. Least likely are the bins at each edge because there is only one bead path to get to these two bins (either all left moves or all right moves).
No, because of statistical variations in the cascade of bead random walks from cycle to cycle. An estimate of the statistical variation in a bead bin would be to use counting statistics that says that the estimated standard deviation is the square root of the expected number of beads in a bead bin. If a bead bin had an expected number of beads of 1225, then an estimate of the bead standard deviation would be 35 beads or about 3% of the total. The larger the number of beads in a Galton Board, the smaller the bead statistical variation will be for every bead bin.
The Galton Board shows that the individual bead behavior is unpredictable, but the group behavior of the beads is predictable. Each bead has a large enough number of Bernoulli trials so that the central limit theorem conditions are satisfied, and the bead value is normally distributed with a known standard deviation. Therefore, a confidence interval can be formed around the value sampled by the golden bead. The golden bead random variable value +/- 1 sigma should include the true, but unknown, mean 68% of the time, +/- 2 sigma 95% of the time, and +/- 3 sigma 99.7% of the time.
The Drunkard's Walk in one dimension. Consider a drunkard that starts the random walk at a location and has a 50/50 chance of moving one step either to the left or right on a line. The direction of each step is independent of the previous step. The bead distribution in a Galton Board can be used to estimate the probabilities of where the drunkard will be after taking n random steps where n is the number of rows of pegs. The bead-bin x-axis of the Galton Board can then be scaled to the minimum and maximum drunkard positions from -n to n steps.
Among all continuous distributions with a fixed mean and variance, the normal distribution maximizes Shannon entropy, meaning it is the least informative or most “spread out” distribution consistent with those constraints. As the number of rows and beads becomes large, the Galton Board's bead histogram approaches this maximum entropy shape, in line with the de Moivre-Laplace theorem and the central limit theorem. This offers a physical illustration of how random variation constrained only by mean and variance naturally leads to the most disordered yet statistically stable outcome.
Monte Carlo methods use random sampling to estimate quantities such as expectations, probabilities, and distributions. A Galton Board acts as a physical random sampling device. Each falling bead is one Monte Carlo sample generated by a sequence of left-right Bernoulli trials. The final bead positions form an empirical distribution that approximates the underlying binomial distribution. For a moderately large number of rows, this distribution is well approximated by a normal curve via the de Moivre-Laplace case of the central limit theorem, giving a direct physical visualization of the results of a Monte Carlo sampling process. Here is one reference that uses the quincunx to visualize and understand Monte Carlo results: CoverSheet
The only perfect Galton Board is a computer simulation where p = 0.5 and there are no bead-bead interactions or physical imperfections. Even in this case, there will still be statistical variations in the number of beads in each bin since random numbers are being used to sample the outcome of each Bernoulli trial and the bead random walk.
The largest Galton Board was most likely the 14.5' version at the at the Eames Mathematica: A World of Numbers... Beyond exhibit at the California Museum of Science and Industry in Los Angeles in 1961, and later at the IBM Pavilion at the 1964-65 New York World's Fair. The television game show "The Wall" uses a four-story board with pegs in a quincunx pattern to randomly determine monetary outcomes from the balls falling into the bins at the bottom of the wall. The smallest Galton Board is likely the AAKKOZZLL coin created by Burke Brown in 2006. This coin is about the size of a half-dollar coin.
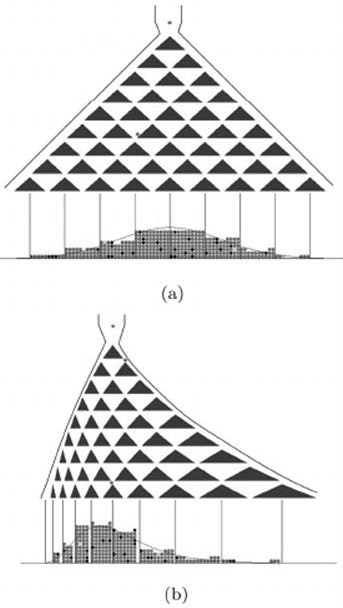
Yes. Modifying the locations of the pegs in a Galton Board can create other bead distributions such as the log-normal. Figure (a) shows the normal Galton Board peg structure and Figure (b) shows a peg structure to produce a log-normal distribution.
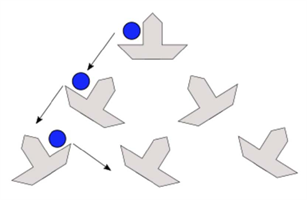
Yes. The Galton Board can be made to create a deterministic bead control the bead flow by replacing the fixed pegs with movable pegs:
If the movable peg is in an orientation to force the bead to move left, the peg will change orientation after the bead interaction so the next bead will move to the right. Therefore, the random bead behavior has been replaced by a deterministic bead behavior if the beads flow 1 bead at a time.
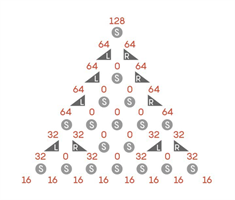
Yes. Here is an example configuration for a 7-row Galton Board from the November 2019 issue of Quanta Magazine that replaced 10 out of the 28 round (S) pegs with pegs that move a bead either to the left (L) or to the right (R):
This configuration produces a uniform bead distribution of 16 beads in each of the 8 bead bins at the bottom from 128 starting beads.
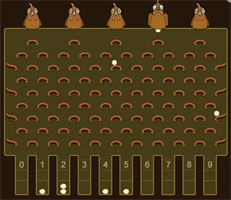
Yes. Here is an example by Andy Giger in 2017 where he has 5 hens laying eggs in a 9 bin Galton Board:
He showed that this configuration produces a flat distribution of "eggs."

Yes. In 2023, a senior design project in the Mechanical Engineering Department of Purdue University designed and built the first physical 3D Galton Board that creates a bivariate binomial distribution of beads. This 3D Galton Board has six levels of quad-ramp "pegs" with 15000 beads falling into a 7x7 bead bin array. The probability of a bead landing in the center bin is about 10%. Their 3D Galton Board can be seen in ifa.com/galtonboard/videos.
A cylindrical Galton Board wraps the usual peg lattice around a vertical cylinder so that beads move in helical paths around the cylinder as they fall instead of along a flat horizontal line. It produces a wrapped binomial distribution and, for a long enough cylinder, an approximation to a wrapped normal distribution. Wrapped normal distributions are used to model angular or periodic data — such as wind direction, animal migration bearings, circadian rhythms, and robot headings — where the data wraps around a circle so that 0° and 360° are the same point. Changing the cylinder height changes the angular bead distribution in ways that a planar board cannot show. In recent work, a cylindrical Galton Board has been built that can generate a wide range of wrapped normal distributions by adjusting the number of stages.
In a non planar Galton Board, the usual flat peg lattice could in principle be replaced by pegs arranged on a curved or topologically nontrivial surface such as a cylinder, sphere, or torus. These designs change the bead's final configuration and can produce wrapped, directional, or topology dependent limiting behavior not seen in the planar quincunx, making them useful for demonstrating circular and directional statistics and the effects of curvature and topology on random walks.
CATEGORY 8: THE IFA GALTON BOARD
Index Fund Advisors. IFA Founder and CEO Mark Hebner uses the Galton Board to visualize the average return and its standard deviation based on the level of risk from 75 years of index fund historical data. The average return mu and data dispersion sigma on the X-axis of the Galton Board are determined from the historical data for the scenario being considered. There are two Clip-ons that are included with the IFA Galton Board that show the data for two different risk scenarios.
It is a statistical sampling device that demonstrates probability concepts from a single Bernoulli trial of a bead bouncing off of a peg to the binomial bead distribution created from the many Bernoulli trials. The IFA Galton Board is designed to closely mimic the probabilities given by Pascal's triangle.
The number of rows should be an even number so there is an odd number of bead bins with the center bin expected to have the most beads. Fourteen rows were selected to satisfy both the de Moivre-Laplace theorem requirements of n/2 > 5 and to have a nice range on the X-axis from mu-4*sigma to mu+4*sigma. More rows would have very small probabilities of a bead falling into the outmost bins resulting in empty bead bins based on Pascal's triangle probabilities. Fewer rows reduce the bead chaos and produce a more discrete looking binomial distribution if n+1 bead bins are used.
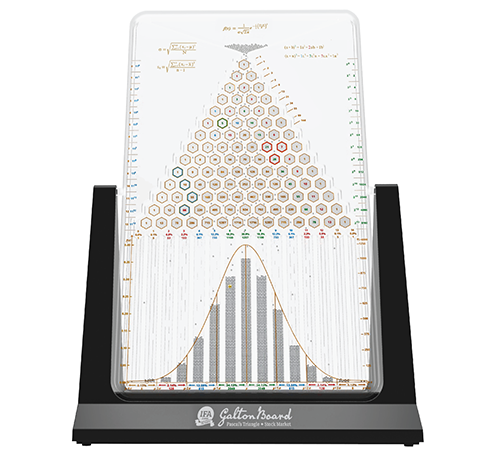
The Galton Board measures 12x8.5x4.5 inches and contains 6000 1 mm steel beads and one golden 2.2 mm bead. The number of beads was chosen based on bead reservoir size constraints and having the number of beads in the center bin (k = 7) minus twice its standard deviation (assuming the bead distribution in a bead bin is a Poisson distribution) be greater than the number of beads in the adjacent bins (k = 6 or k = 8) plus twice its standard deviation. Therefore, it is unlikely that either adjacent will have more beads than the center bin.
Hexagonal pegs have flat surfaces instead of round surfaces. The flat surface has one angle relative to the vertical direction compared to a range of angles for a round peg. The flat surface provides a more uniform sampling of each Bernoulli trial and therefore produces a binomial bead distribution that more closely approximates Pascal's triangle binomial distribution.
Durable construction using anti-static plastic with a stable base, has two US Patent Numbers D748,449 and 12,268,971 B1, has undergone extensive prototype testing, features easy, repeatable bead loading and cascade with no stuck beads, produces a binomial bead distribution that is very close to Pascal's triangle probabilities, has one golden bead, has a special channel in the middle of each bead bin to make the golden bead easily visible, comes with two stock market Clip-ons, the armature is in the proportions of the Golden Ratio, contains lots of information on the faceplate, comes with a detailed User Guide, has an associated website that contains a wealth of information about Galton Boards, and is a 2023 European Product Design Award winner.
To see the outcome of a single bead random walk through the Galton Board. The golden bead represents a single sample from the underlying bead distribution. Its location varies from cycle to cycle, illustrating that individual outcomes are random even when the overall distribution is stable and predictable. The exact location of where a golden bead will land is unknown, but its distribution is known from the central limit theorem. Because the golden bead has undergone 14 samples of the random variable during its random walk, the golden bead bin value satisfies the conditions for the central limit theorem: the sampled value will be normally distributed with the binomial distribution sigma. Therefore, the golden bead will be between +/- 1 sigma, +/- 2 sigma, and +/- 3 sigma from the mean mu of the normal distribution 68%, 95%, and 99.7% of the time. Conversely, the golden bead will be outside the +/- 1 sigma, +/- 2 sigma, and +/- 3 sigma intervals 32%, 5%, and 0.3% of the time.
The first IFA Galton Board was a desktop version called The Random Walker that first appeared in 2017.
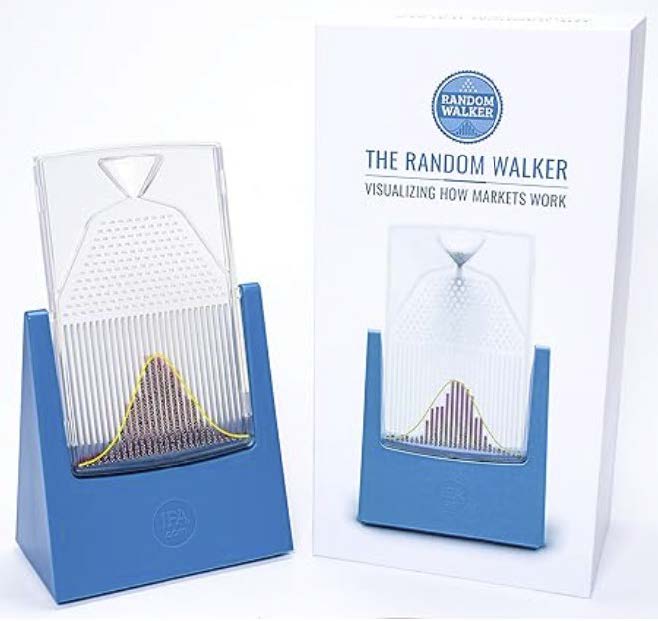
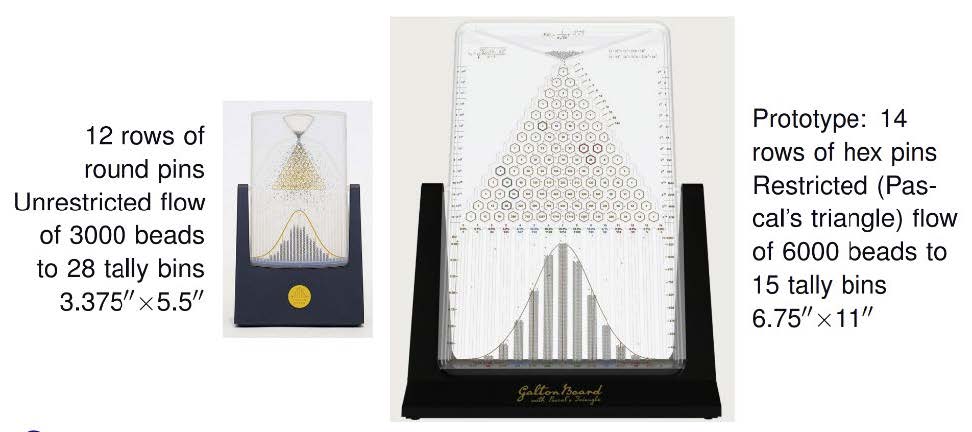
Since then, several updated versions of the desktop were produced beginning in 2018. The desktop version binomial bead distribution did not closely approximate the Pascal's triangle probabilities, so it was phased out and the design of a new, larger, and improved Galton Board was begun in 2021.
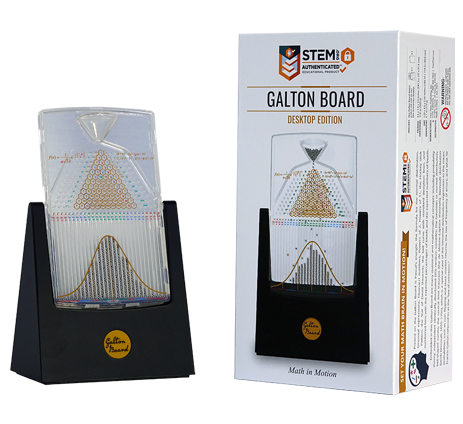
The new Pascal's triangle Galton Board was released in 2023 after undergoing 32 revisions. The new Galton Board produces a binomial bead distribution that closely matches Pascal's triangle probabilities.The IFA Simple Galton Board is 6.5 inches tall and 4.5 inches wide. It contains 4,280 steel beads, was released in October 2025, and includes a 32 page full color User Guide available in multiple languages. For more information, see the Galton Board page at IFA.com.
How many different bead paths are there for the center bead bin, how many paths for the edge bins, and how many total different bead paths for the IFA Galton Board?
The 15 paths P are given by row 14 of Pascal's triangle for k = 0 to 14:
k 0 1 2 3 4 5 6 7 8 9 10 11 12 13 14
P 1 14 91 364 1001 2002 3003 3432 3003 2002 1001 364 92 14 1
There are 3432 possible paths to the center bin (k = 7). The sum of all possible paths is 2**14 = 16384.
The probability that a bead will fall into the center bin is the number of paths to the center bin divided by the total number of paths = 3432/16,384 = 0.2095. About 21% of the beads will land in the center bin.
The IFA Galton Board has 6000 beads. Multiplying 6000 by the probability of landing in the center bin = 6000*0.2095 = 1257 beads.
The armature is a golden rectangle that has dimensions that are 1 to 1.618, the Golden Ratio. The Golden Ratio was referred to as the divine proportion by the ancients.
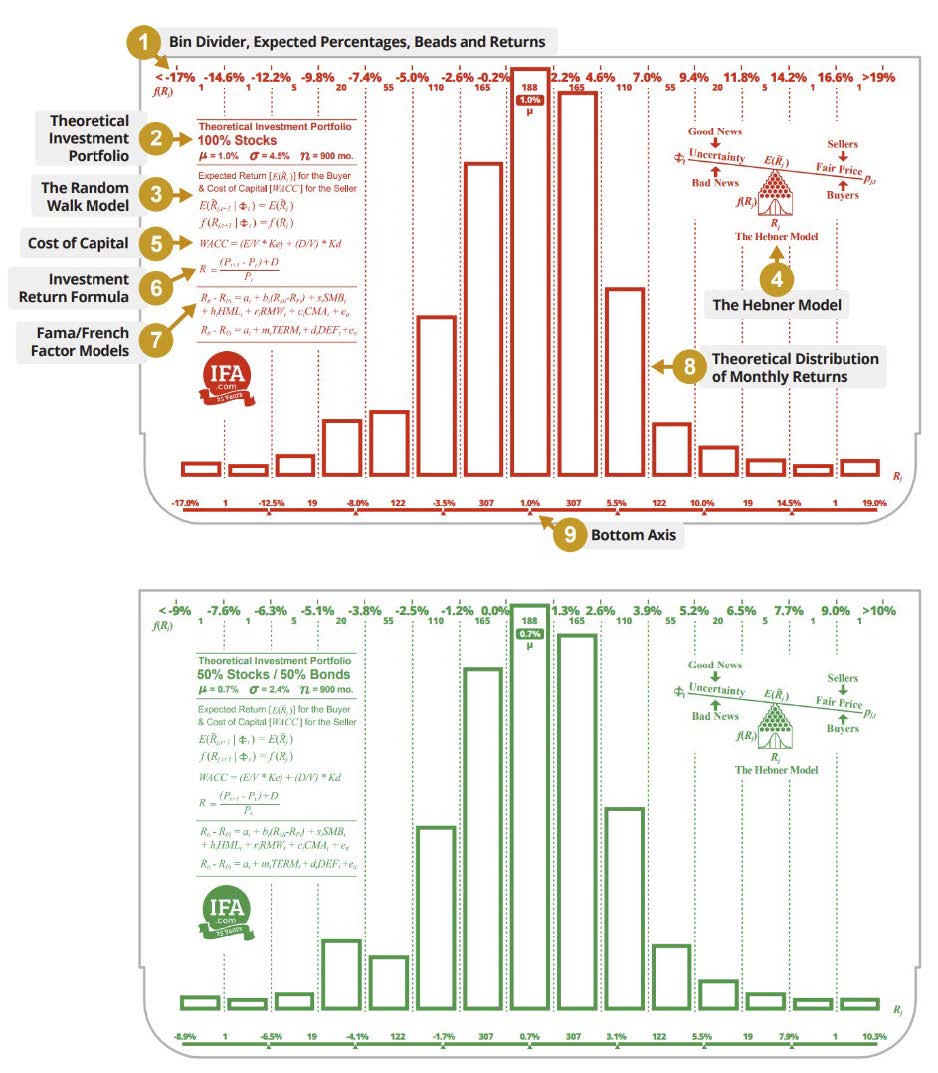
They overlay the normal distribution portion of the Galton Board with two sets of historical set of 900 monthly returns for a 100% stock (red) and a 50% stock, 50% bond (green) portfolios. Note that the X-axis returns are different. The mean and standard deviation for the 100% stock portfolio are 1.0% and 4.5%. The mean and standard deviation for the 50%/50% portfolio are 0.7% and 2.4%.

Philip Poissant of Poissant Design Associates Inc in Canada and Mark Hebner, creator of the IFA Galton Board. This Galton Board was given the award in the Education Tools: Teaching Aids Category because of its unique design that incorporates so many elements of math, science, art, and functionality that had never been done before in the 150-year history of the Galton Board.
Yes. The IFA Galton Board comes with a 32-page full color User Guide that discusses all the topics in this Q&A set. The User Guide starts off with an introduction, followed by a 20-bullet discussion of the Galton Board faceplate, a 9-bullet discussion of the 2 stock market Clip-ons, the binomial distribution, coefficients, and expansion, combinatorics, Sierpinski triangle, and the IFA Galton Board App.

Yes. It was awarded the STEM.org Authenticated Seal in 2018 and the 2023 European Product Design Award in the category of Education Tools: Teaching Aids. The User Guide can be used for teaching the various probability and statistical aspects of this Galton Board. There are many videos available online at galtonboard.com that use the IFA Galton Boards to teach statistical concepts like the central limit theorem.
More than 60,000 IFA Galton Boards have been sold worldwide since 2017.
CATEGORY 9: THE FACEPLATE OF THE IFA GALTON BOARD
Pascal's triangle and some associated number patterns, the normal distribution, the mean, the population and sample standard deviations, the central limit theorem, the binomial theorem, the binomial coefficients, the binomial distribution, bead bin probabilities, number of expected beads in each bin, Galton degrees, combinatorics, powers of 2 and 11, Fibonacci numbers, and the Golden Ratio.
Each binomial coefficient on a hexagonal peg is the number of different paths a bead can take to reach that peg location after falling through the n rows of pegs above. Normalizing these numbers by 2**n for row n of Pascal's triangle gives the binomial distribution for n Bernoulli trials and p = 0.5. The IFA Galton Board binomial bead distribution closely approximates Pascal's triangle binomial probability distribution.
The maximum number of sigmas S in a Galton Board with a Pascal's triangle binomial bead distribution for n Bernoulli trials is the number of binomial bins n + 1 divided by the binomial distribution standard deviation sqrt(n)/2:
S = (n+1)/[sqrt(n)/2] = 2(n+1)/sqrt(n).
Another way to calculate S is to use the normal distribution with the 0.5 continuity correction:
S = (x_max-x_min)/sigma = = [(n+1/2)-(-1/2)]/[sqrt(n)/2] = 2*(n+1)/sqrt(n).
Either way, for n = 14, S = 2*15/sqrt(14) = 8.02. Therefore, the X-axis range is from mu-4*sigma to mu+4*sigma for a level IFA Galton Board.
Because the binomial distribution is discrete and the normal distribution is continuous, a continuity correction to the binomial distribution improves the approximation. When computing the probability that a discrete binomial variable x equals exactly k, it is better approximated by the area under the normal curve from k-0.5 to k+0.5, rather than just at the point k. The continuity correction matters most when n is small. For the IFA Galton Board's 14 rows, it provides a modest improvement over the uncorrected approximation.
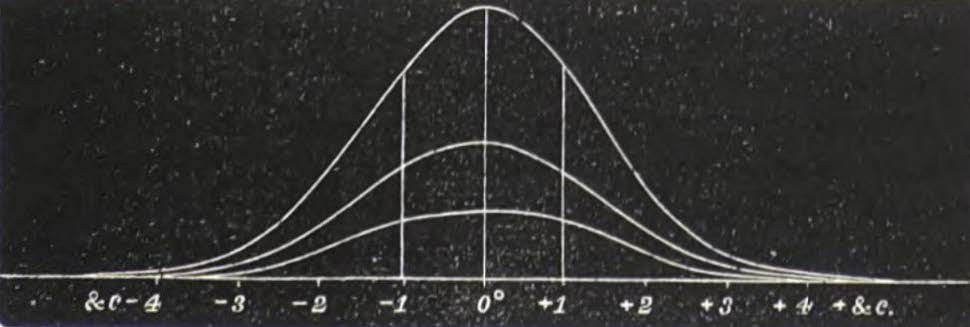
Sir Francis Galton used a degree scale, indicated by the circles on the X-axis, that is based on the probable error instead of the sigma scale. The probable error is 0.6745 sigma. The probable error interval from -0.6745 sigma to 0.6745 sigma contains 50% of the area of the normal distribution. The range of the X-axis in degrees is -4.0089/0.6745 to 4.0089/0.6745 or -5.94 to 5.94 degrees. Here is a plot by Galton of the normal distribution in Galton degrees (February 2, 1877)
The first is the discrete symmetric binomial distribution created by the 6000 beads from the 14 Bernoulli trials for each bead, one trial for each peg hit. The second is the continuous normal distribution or bell-shaped curve fitted to the binomial distribution. This continuous normal distribution closely approximates the discrete binomial distribution by the de Moivre-Laplace theorem.
The probabilities and number of beads expected in each of the 15 bead bins for a Pascal's triangle Galton Board are listed above each bin. These probabilities are calculated using the 15 binomial coefficients in Pascal's triangle row 14 divided by the total 2**14 = 16384. The probabilities and number of beads expected in the eight 1 sigma intervals of the normal distribution are shown below the X-axis.
The left Y-axis scale is for the normal distribution probability density function f(x). The peak value of f(x) occurs at x = mu. For the case of sigma = 1, f(mu) = 1/sqrt(2*pi) = 0.3989. The left Y-axis scale ranges from 0 to 0.4 for sigma = 1. For sigma not equal to 1, the f(x) scale would peak at f(mu) = 1/[sigma*sqrt(2*pi)] = 0.3989/sigma. The right Y-axis scale is the number of beads from 0 to 1250. The expected maximum number for 6000 beads in the center bin is 1257.
The IFA Galton Board App is more interactive and flexible than the IFA Simple Galton Board. It allows you to pause and resume bead flow, adjust speed, follow a single golden bead, reset instantly, change visual themes, view educational explanations, and connect probability concepts to portfolio and market-return data. These features make it easier to study and demonstrate probability concepts in a controlled way. The main drawback of the app is that it uses a computer simulation rather than real beads and real physics. It also requires a compatible device and power, and it lacks the tactile, hands-on experience of a physical board.
CATEGORY 10: THE IFA GALTON BOARD APP
It is a computer simulation of a Galton Board using 600 beads that produces a binomial distribution of beads. It is available for iPhones and iPads in the Apple App store. The App works in portrait mode. The binomial bead distribution will be symmetric if the display device is level. Otherwise, the bead distribution will be skewed. The App contains a wealth of information about the various aspects of a Galton Board and how it applies to IFA Index Portfolios. There are 18 information "i"'s available on the Pascal's triangle screen to click on to learn about 18 aspects of the Galton Board.
To provide IFA clients and other interested people with a fun and educational way to learn about the Galton Board and its application to returns for various index funds. There are several different modes of bead flow control to aid in visualizing "order out of apparent chaos."
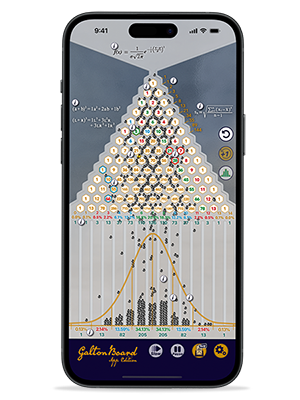
The faceplate of the App looks similar to the IFA Galton Board. Hitting the "play" button starts a cascade of 600 "steel" beads and one golden bead falling through the 14 rows of Galton Board pegs. There is sound provided to hear the cascade of beads. The bead flow speed can be controlled in two ways: using the "slow" button and/or putting the Apple device in a more horizontal position. The beads are accrued in the 15 bead bins at the bottom. The golden bead is easily visible. Hitting the reset button moves the beads back to the reservoir and the bead cascade repeats. There are options to pause the bead cascade, run 1 golden bead at a time, change the Galton Board background from gray (Pascal's triangle) to teak or marble, and to keep the "i" icons locked on for study purposes. There is a Market Coin option that helps to illustrate that each peg on the Galton Board represents a 50/50 chance of a bead going left or right, just like a flip of a coin. There are links to IFA.com, galtonboard.com, and IFA Index Portfolio data.
Yes. You can run just one golden bead at a time using the gold "+1" button to watch its random walk. Holding this button down for 2 seconds will keep the golden beads running one-at-a-time until 600 beads have been sampled.
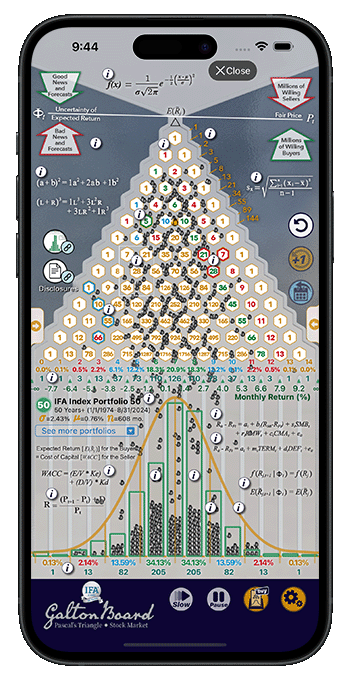
Clicking the Stock Market Data option in the Galton Board settings and hitting the back button will change the screen from Pascal's triangle to the stock market screen that has a wealth of information about index funds, hypothetical monthly returns, and The Hebner Model. There are 8 new "i" icons to click on to learn more about the financial applications of the Galton Board.
 Home
Home Taxes
Taxes About Us
 888-643-3133
 Contact Us
 Newsletter Subscribe
 eMoney
 IFA Apps
 Index Funds Book on Kindle
 Index Funds Audiobook
 Careers
 Facebook
 X
X LinkedIn
 Instagram
 Videos
 Youtube
 Glossary
 Terms
Terms Disclosures
 Index Descriptions
 Form CRS