Flip a Galton board containing thousands of steel beads. Watch them cascade through 14 rows of hexagons. In two seconds, chaos resolves into a perfect bell curve. Flip it again — a different path for every bead, but the same distribution emerges. This isn't magic. It's the Central Limit Theorem made visible. And it illustrates why short-term market movements are difficult to predict and why market timing strategies often fail, according to historical evidence.
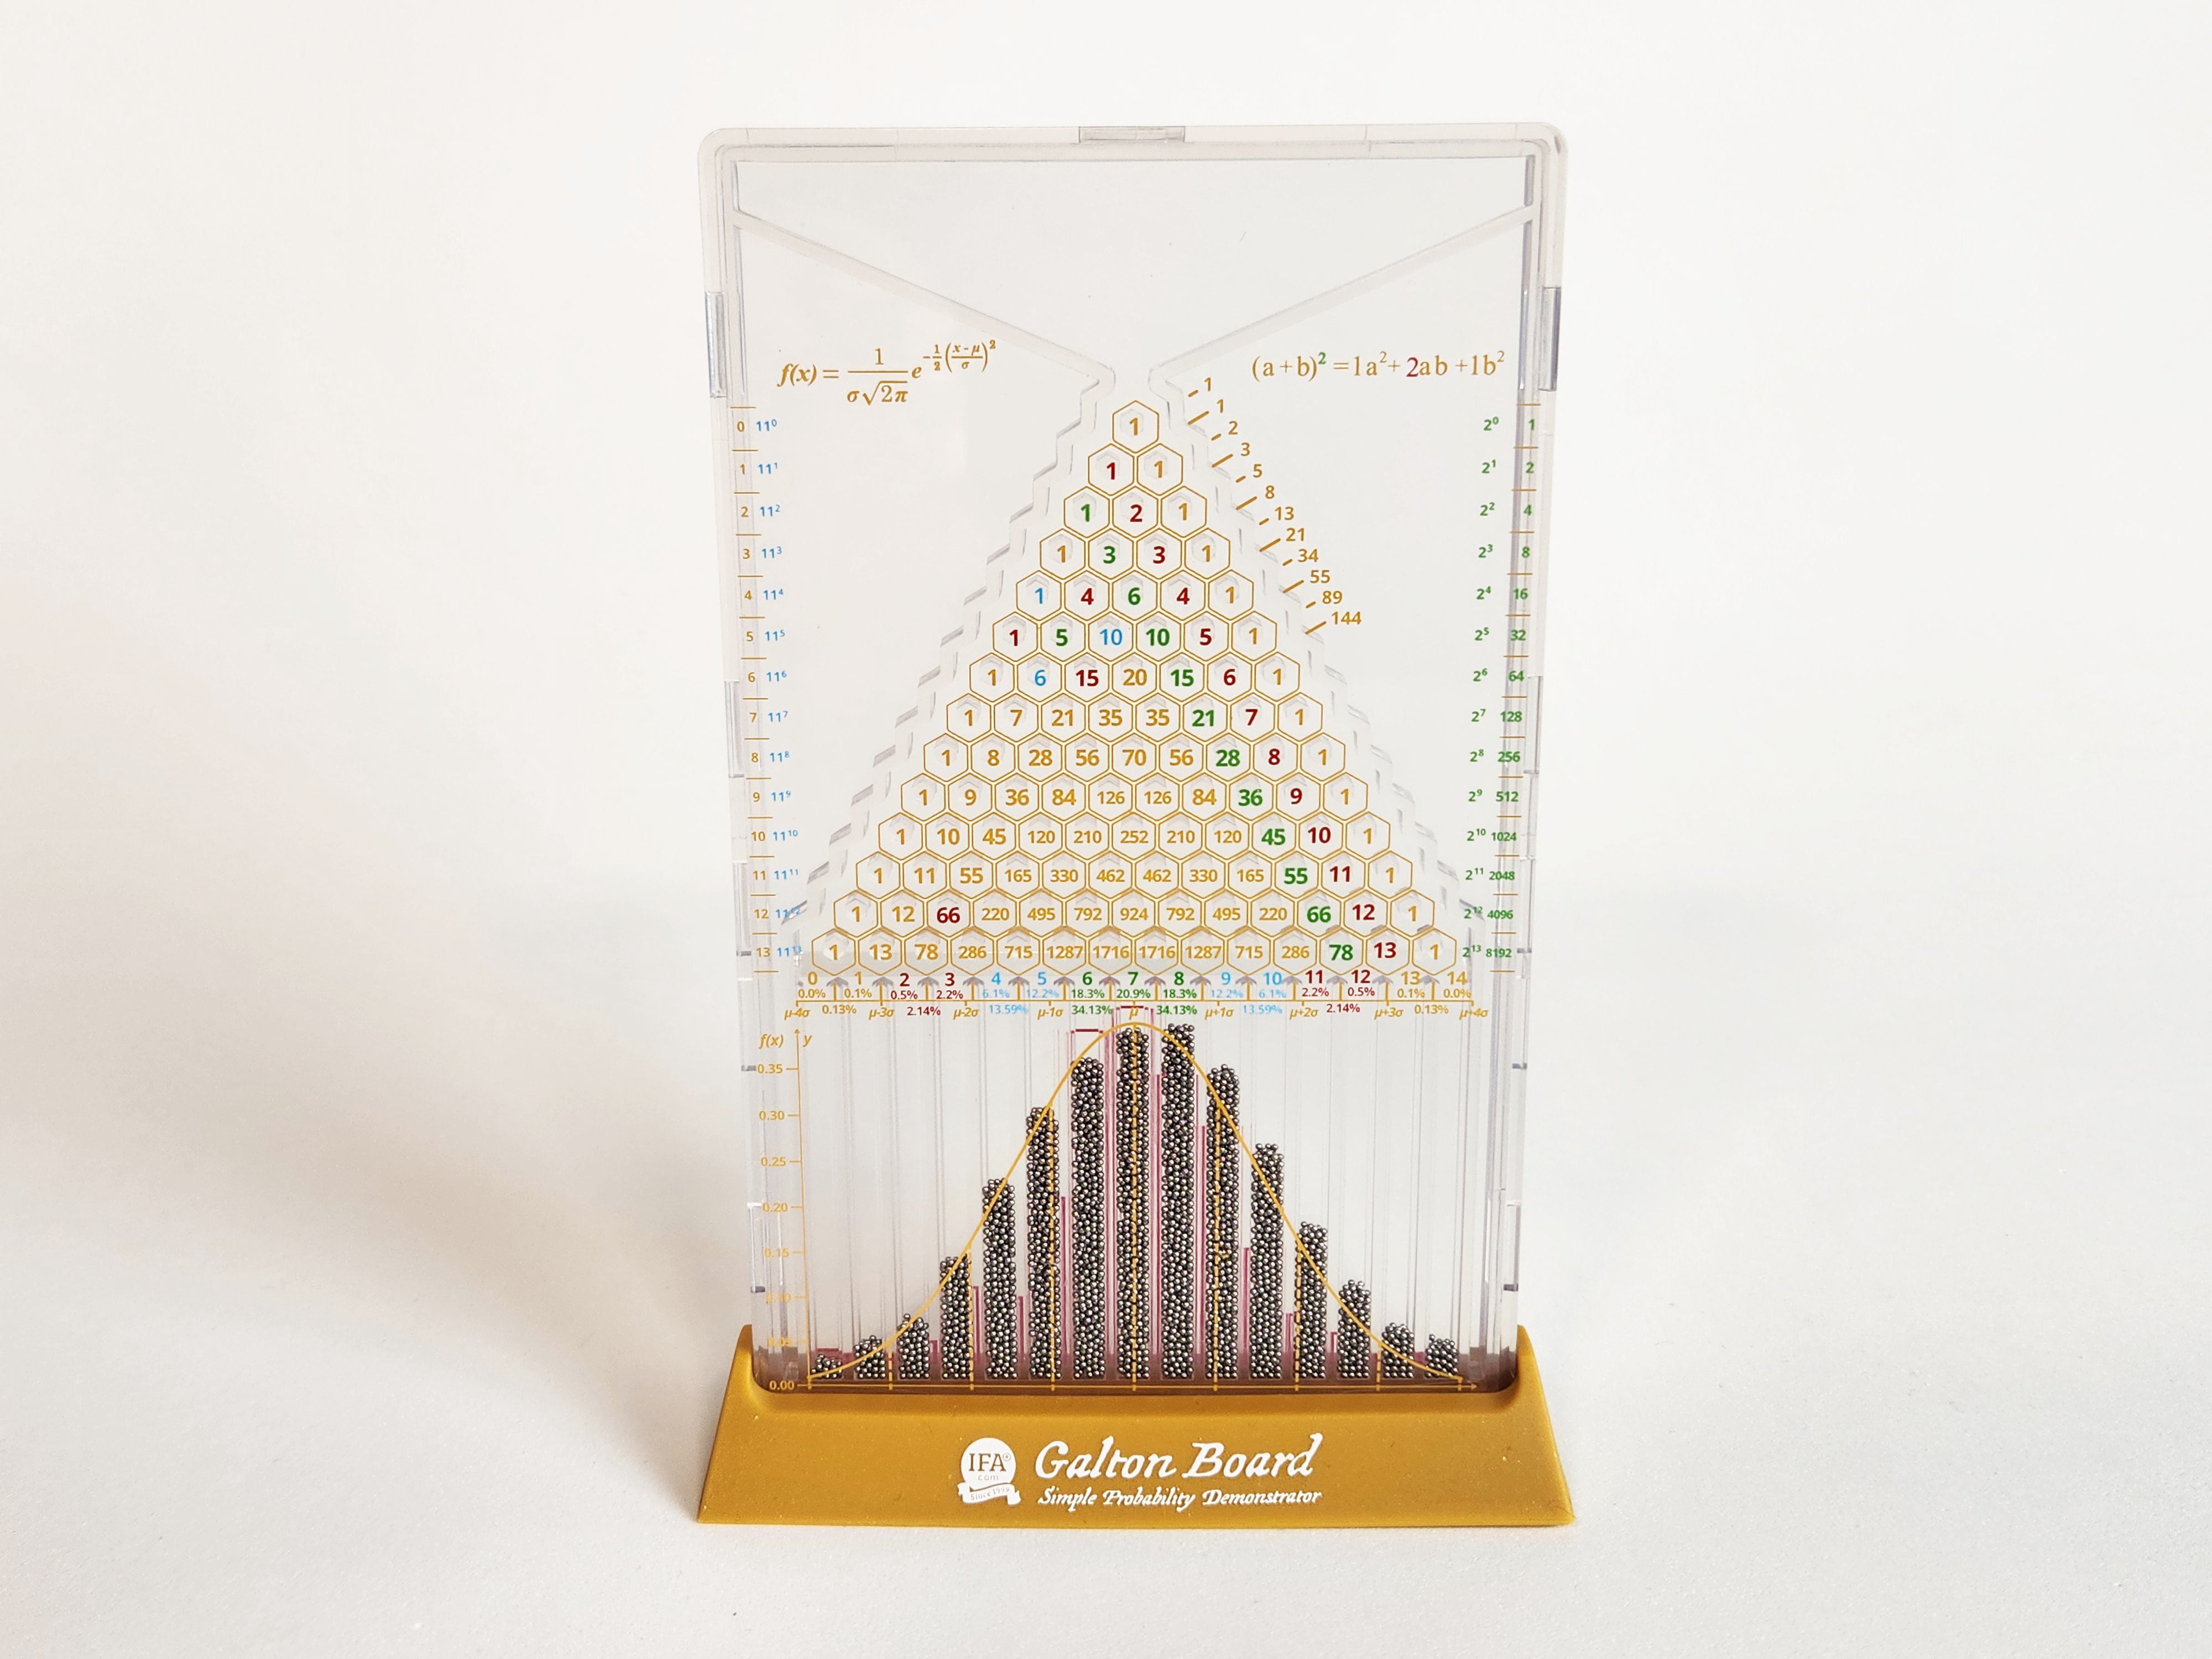
The metallic rush sounds like rush hour on the subway — 4,280 steel beads pouring into the reservoir as you flip the board upside down. Flip it back and for two seconds you watch apparent chaos: beads ricocheting off 105 hexagons, bouncing left and right through 14 rows. Then they settle into 15 bins at the bottom, forming the same shape every time. A perfect bell curve.
You can buy one of these boards yourself. And once you do, you'll flip it obsessively, watching one particular bead — larger, golden — bounce unpredictably through the hexagons. This time it lands in bin seven. Next flip: bin nine. Then five. Then eight. You cannot predict where it will land. But you can observe a consistent pattern in bead distribution -- the pattern that emerges when all 4,280 beads complete their journey.
This is the Galton Board. And it illustrates why short-term stock market returns are generally unpredictable whilst very long-term returns have historically shown more stability.
The Victorian polymath's insight
Sir Francis Galton — Charles Darwin's half-cousin, pioneer of fingerprint analysis and weather mapping — called the device he invented in 1873 the quincunx. The name comes from Latin, describing five objects arranged like the five-spot on a die: four at the corners, one in the center. In this Galton board each dot of the quincunx is represented by a hexagon.
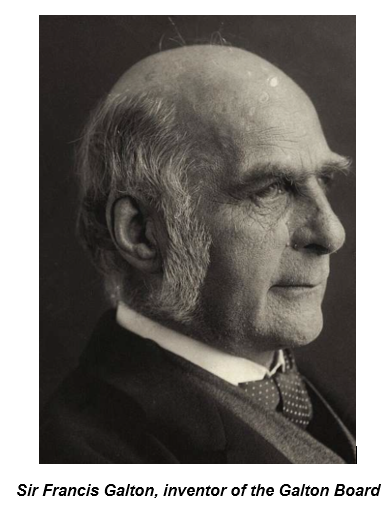
Galton wrestled with a profound question: How do predictable patterns emerge from unpredictable individual events? In his 1889 book Natural Inheritance, he described what fascinated him: "I know of scarcely anything so apt to impress the imagination as the wonderful form of cosmic order expressed by the Law of Frequency of Error. The law would have been personified by the Greeks and deified, if they had known of it. It reigns with serenity and in complete self-effacement amidst the wildest confusion. The huger the mob, and the greater the apparent anarchy, the more perfect is its sway."
What Galton grasped: "a number of small and independent accidents befall each bead in its career." At each hexagon, the bead faces a binary choice — bounce left or right. Fourteen rows mean 14 such choices per bead. With 4,280 beads, you're watching 59,920 coin flips or independent trials unfold in seconds.
The numbers on the hexagons — Pascal's triangle — show how many paths lead to each bin. One way reaches the leftmost bin (14 consecutive left bounces), one way reaches the rightmost bin (14 right bounces). But 3,003 different paths lead to the middle bin. That's why the center bins fills up with the most beads.
From Victorian England to the Paris Bourse
Twenty-seven years later, in 1900, a young French mathematician named Louis Bachelier stood before an academic committee at the Sorbonne defending his doctoral thesis, Théorie de la Spéculation. His supervisor, Henri Poincaré, noted the topic was "far away from those usually considered by our candidates" but appreciated its originality.
Bachelier had spent time observing the Paris stock exchange, the Bourse, watching traders scream prices and make hand signals. What struck him was how prices moved in random patterns, buffeted by countless small forces.
Each piece of news, trade, or sentiment shift was like one of Galton's hexagons — a collision sending the price left or right relative to an average, and ultimately have the same effect on returns. Bachelier realized that predicting up or down direction of the market was futile. The best assumption at any moment in time was that the price is equally likely to move up or down, just like a coin flip.
"There is no useful information contained in historical price movements," he wrote. "The mathematical expectation of the speculator is zero." John Bogle later added that after fees, the speculator had a negative expected return.
This was the random walk hypothesis — five years before Einstein's work on Brownian motion. Bachelier's work was ignored for half a century until Paul Samuelson discovered it and brought to the attention of the academic community.
What Bachelier understood, and what the Galton Board demonstrates, is that whilst individual price movements are random, their aggregate distribution is not. Monthly stock returns, aggregating thousands of price collisions, form a predictable distribution.
The golden bead and the futility of forecasting
Among the steel beads on the latest version of the Galton Board, designed by IFA founder Mark Hebner, sits one larger golden bead. Can you predict which bin it will land in? Of course not. The golden bead represents tomorrow's market movement, next month's return, that stock your brother-in-law swears will double.
But whilst you cannot predict where the golden bead lands, you can predict the distribution of possible outcomes. The percentages above each bin aren't forecasts — they're probabilities. Bin seven has a 20.9% chance of catching any bead. The outer bins: less than 1% each.
This distinction — between forecasting the unpredictable and characterizing the distribution of possible outcomes — is fundamental to proper risk management. It's the difference between gambling and investing.
Historically, stock prices have risen on approximately 54% of trading days. While this does not guarantee future results, markets have historically had a slight upward bias, or "drift" in academic parlance. Imperceptible over short periods, enormous over time.
The problem? Identifying which 54% of days will be positive. Individual moves defy prediction even though long-run patterns hold.
Why the physical object matters
You might ask: "If I understand this intellectually, why do I need the board?"
Because intellectual knowledge and emotional conviction occupy different brain regions. Everyone "knows" daily market movements are random. Yet investors check portfolios compulsively, respond to market commentary, and believe they can identify patterns in noise.
Seeing the distribution form in real time reinforces what data alone rarely achieves. For financial professionals, having this on your desk provides a daily reminder: humility beats hubris.
Each flip takes two seconds. You witness 59,920 binary trials fall into perfect order. And you internalize what every market timer learns the hard way: reversion to the mean is inevitable, but individual outcomes are not.
Who needs this
The portfolio checker who logs in daily, convinced they see patterns, needs this. So does the finance student learning about efficient markets who needs to feel why the theory holds. And the CNBC watcher who absorbs market commentary and believes the experts know something.
But perhaps most of all, this belongs on the desk of anyone who advises others about money. When clients panic during declines or chase performance after run-ups, you can show them charts. Or you can hand them the board, let them flip it a dozen times, and watch understanding dawn.
The intellectually curious — those fascinated by where mathematics meets human behavior — will find endless depth here. The board embodies the Central Limit Theorem, demonstrates the Law of Large Numbers, and explains why active investors faces daunting, if not impossible, odds of beating a risk appropriate benchmark.
The invitation
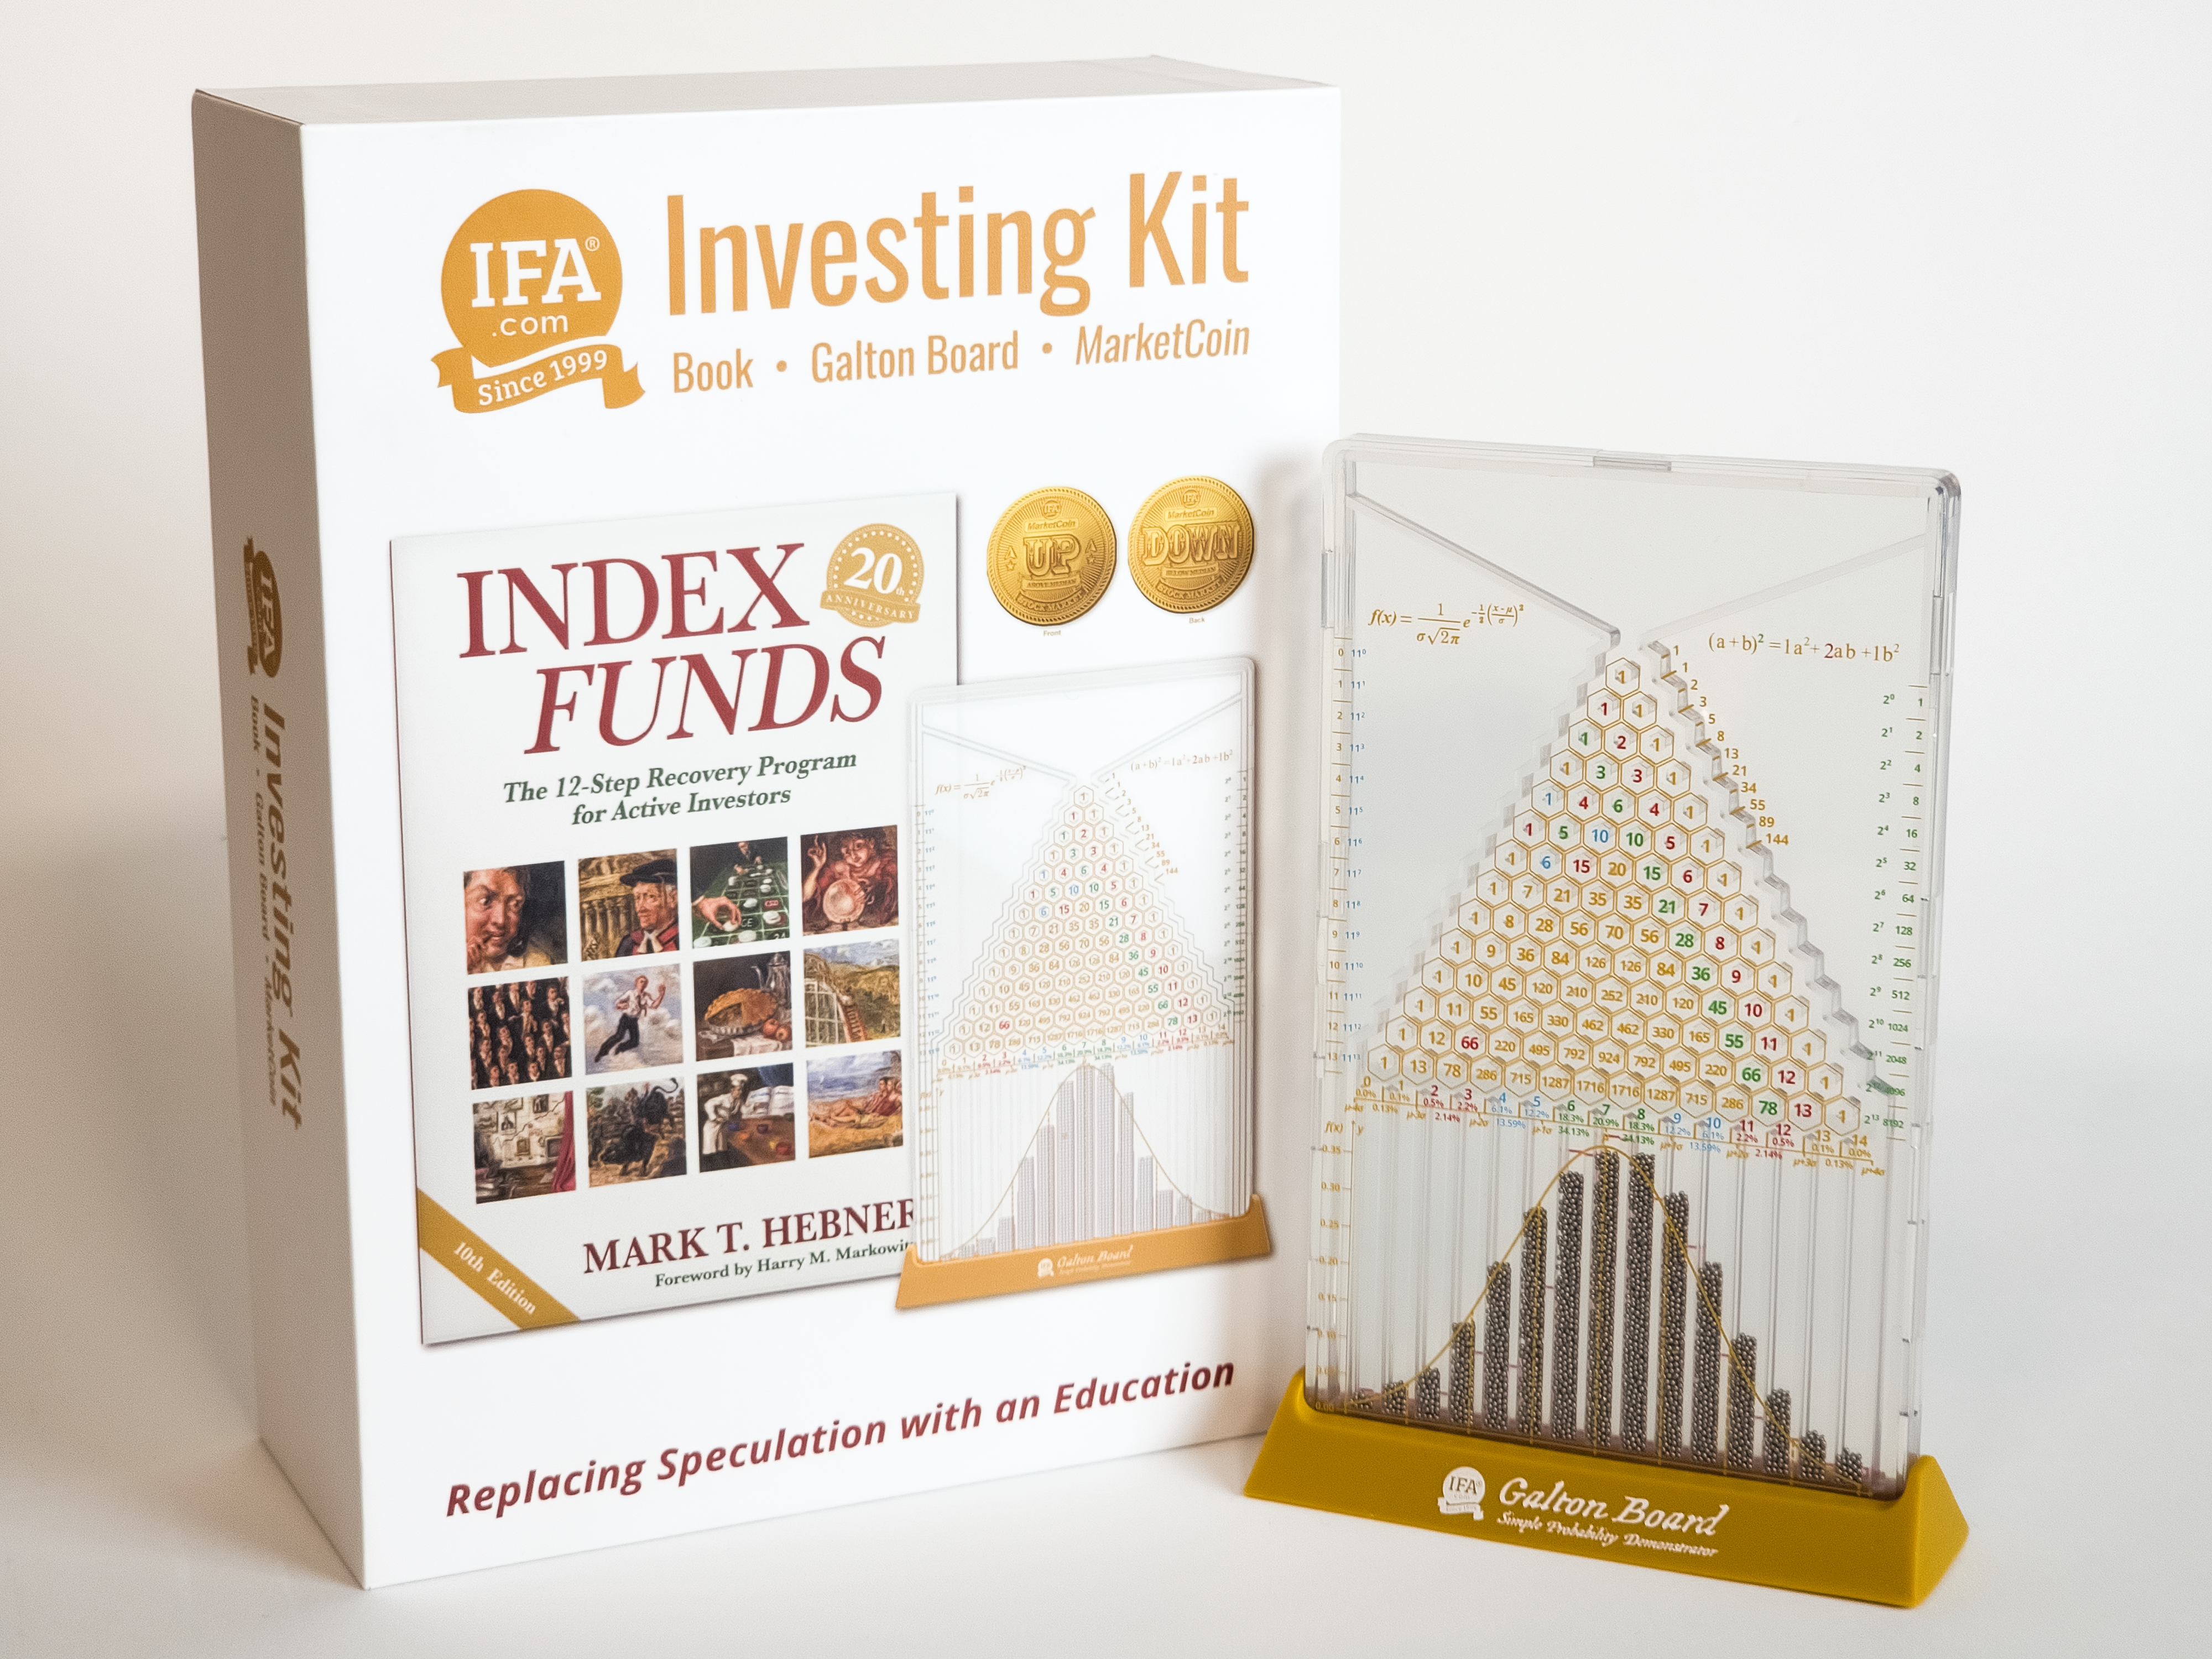
The latest version of the Galton Board is now available on Amazon. As well as the board itself, you'll receive a detailed 32-page user guide exploring the mathematical concepts in depth. It is also available as part of an Investing Kit, that includes the Index Funds book, the Galton Board, a MarketCoin and a User Guide.

Whether for yourself or someone who has an interest in probabilities, statistics, mathematics, or investing, the Galton Board keeps teaching. Not through admonishment or theory, but through the simple, undeniable experience of watching a repeatable pattern develop from apparent chaos.
Flip it yourself. Watch the all of the beads bounce unpredictably through the hexagons and keep an eye on the single random outcome of the golden bead.
Some investing lessons — patience, discipline, humility — can only be learned through experience. The Galton Board makes that experience tangible, repeatable, and impossible to dismiss.
The market doesn't care what you think you know. It's already told you the truth. You just needed the right tool to see it.
Can't wait for delivery? Download the Galton Board App
Watch the beads cascade on your phone, tablet or Mac desktop or laptop before the physical board arrives. The free app lets you flip the board repeatedly, track individual beads, and explore the mathematical concepts interactively.
Available now on iOS and Google Play.
ROBIN POWELL is the Creative Director at Index Fund Advisors (IFA). He is also a financial journalist and the Editor of The Evidence-Based Investor. This article reflects IFA's investment philosophy and is intended for informational purposes only.
This content is provided for educational purposes only and should not be construed as investment advice, a recommendation, or a guarantee of future results. Past performance is not indicative of future returns. Investing involves risk, including the possible loss of principal. The Galton Board and related materials, including the app, are educational tools designed to illustrate statistical concepts. They do not predict or guarantee investment outcomes and should not be relied upon for making investment decisions. For advice specific to your circumstances, please consult a qualified financial professional.
For more information about Index Fund Advisors, Inc, please review our brochure at https://www.adviserinfo.sec.gov/ or visit www.ifa.com.


 X
X