
 Risk Capacity
 Wealth Management
 Outsourced CIO
 Retirement Plans
 Institutional
 Financial
  Open an Account
 IFA App

 Articles
 Charts
 Investor Education ▾
 Fund
Fund
 Store
Store

 Taxes
Taxes Back-testing Disclosures
 Glossary
 Form CRS
Half the wealth the US stock market has created in a century now traces to just 46 companies, and the winners' list is shrinking fast. Stock market concentration has accelerated in recent years, and, as Robin Powell explains, the case for owning the whole market instead of betting on its winners has grown stronger.
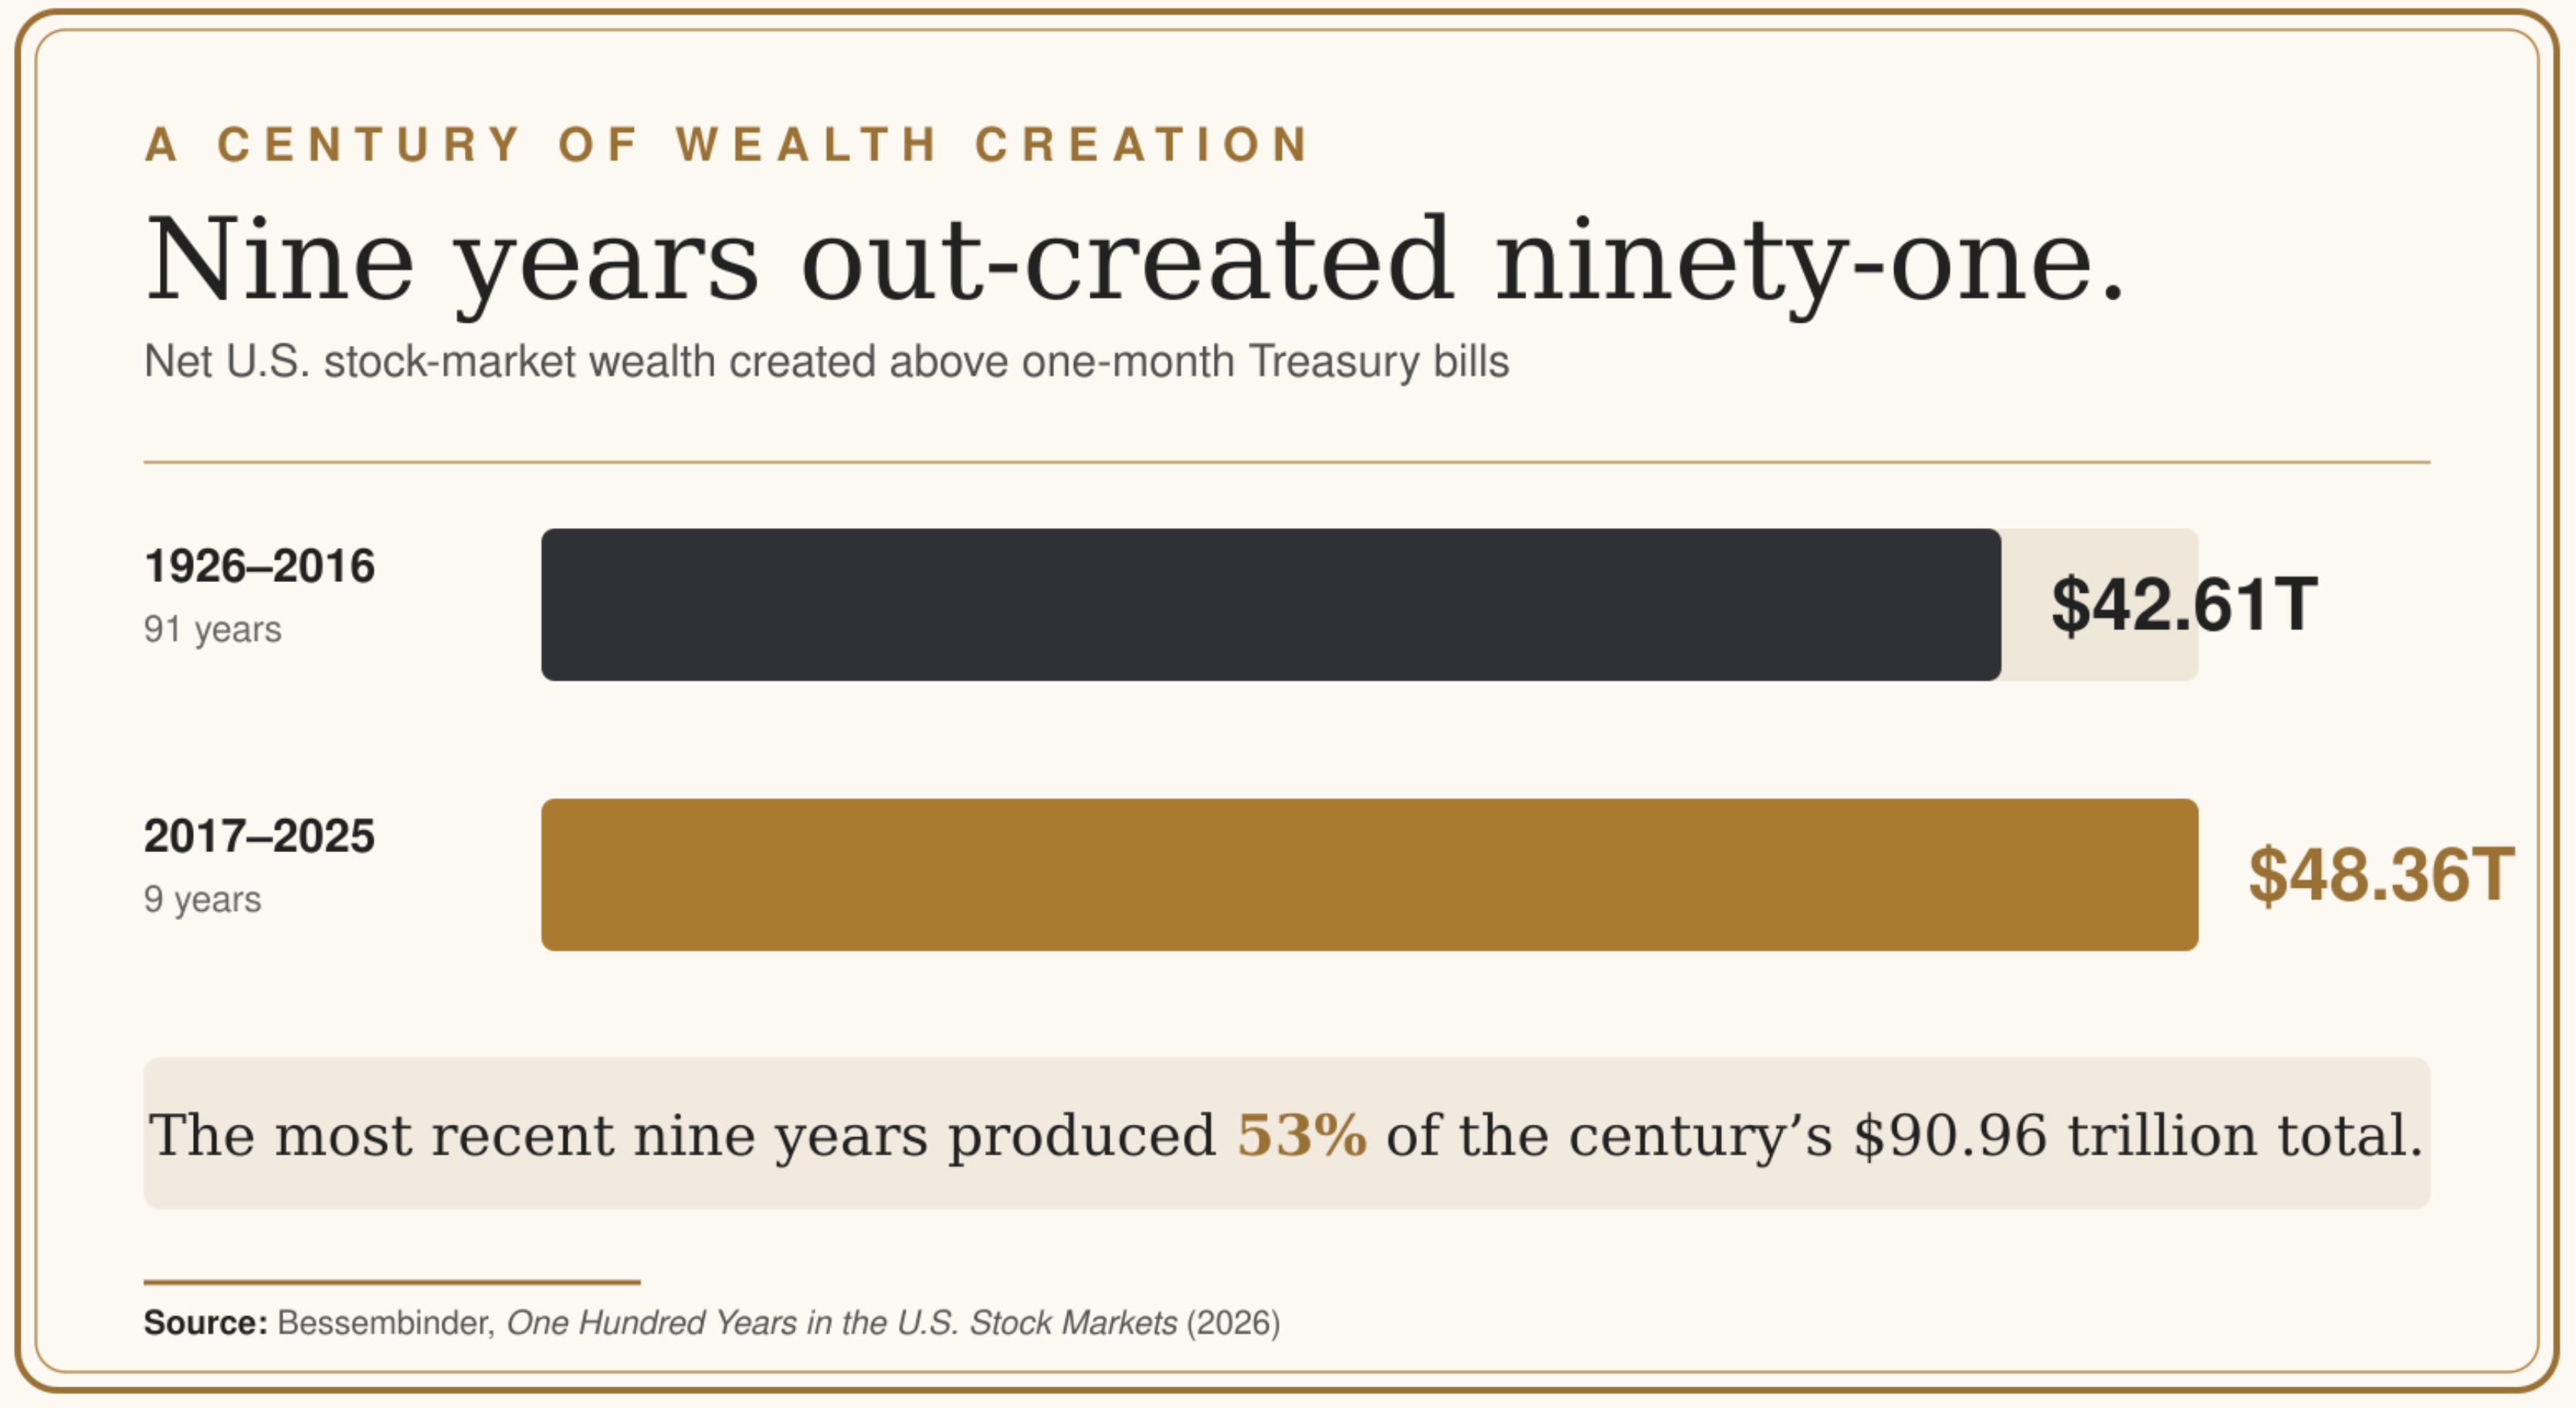
It took the market 91 years to generate its first $42.61 trillion in net wealth for shareholders — over and above what an investor in one-month Treasury bills would have earned. It took nine more to generate the next $48.36 trillion. Nine years out-created 91.
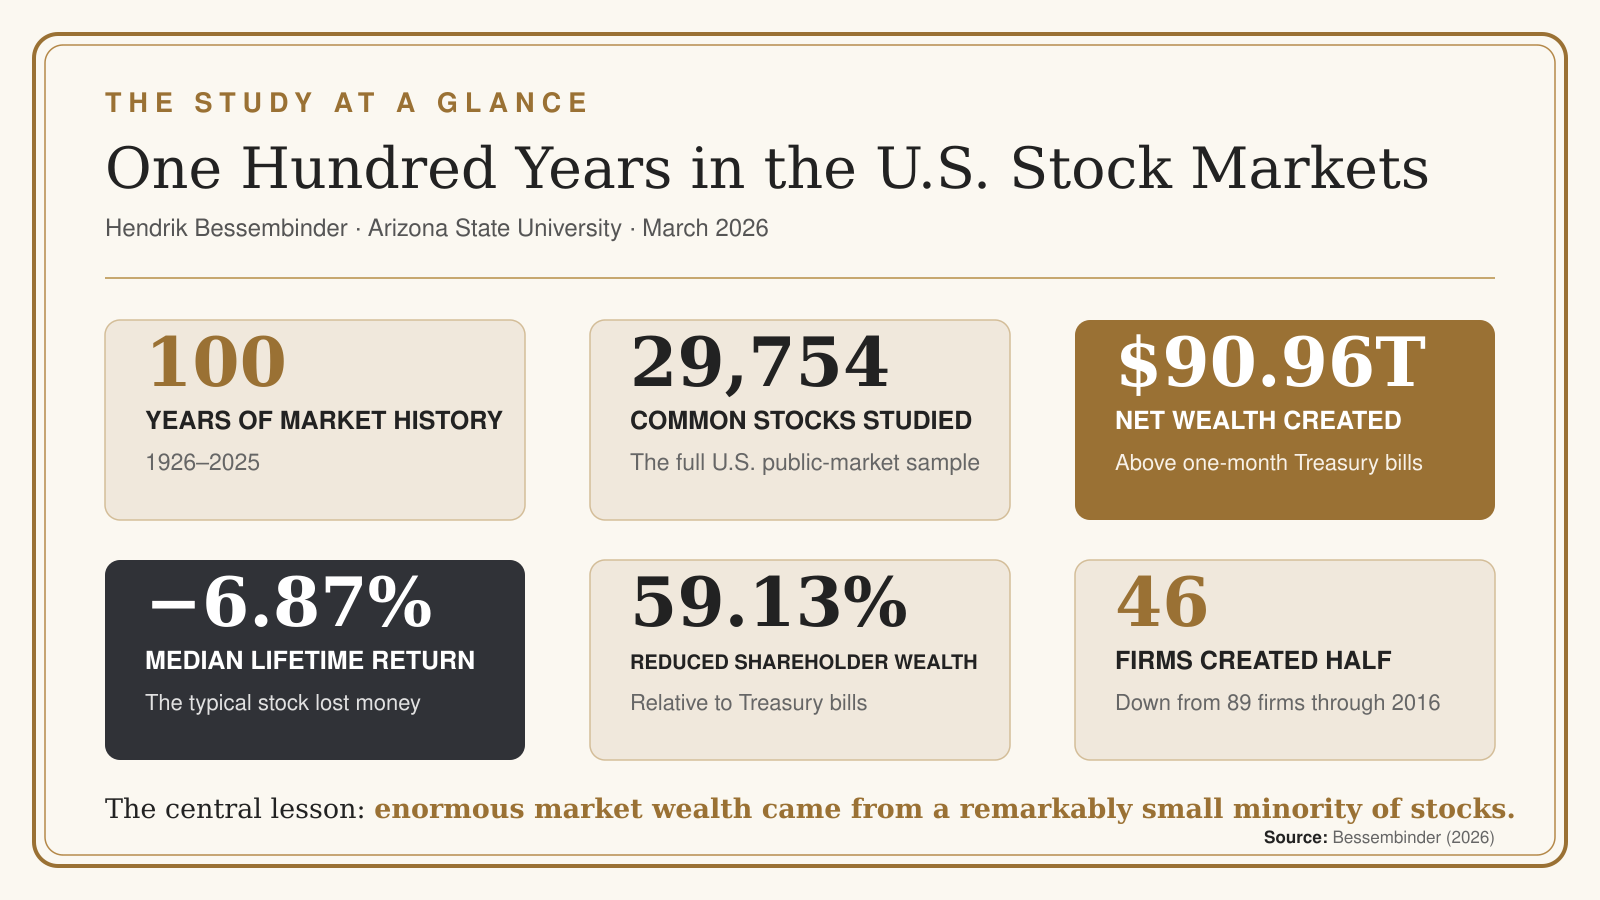
Those figures come from "One Hundred Years in the U.S. Stock Markets," a new working paper by Hendrik Bessembinder of Arizona State University, dated 03/21/2026. It extends his widely cited 2018 study in the Journal of Financial Economics to a full century of data: 29,754 stocks, 1926 through 2025. One caveat up front: the new paper hasn't yet been through peer review, though it follows the same methodology as the 2018 study, which has.
The paper has drawn widespread coverage, and much of it reads like an invitation to load up on the obvious winners. If you've felt that pull, you're in good company. In our view, it's also a mistake — one the paper's own numbers appear to argue against. We examined the earlier version of this evidence in April; the new numbers move the story on, and not in the direction most investors assume.
The Winners' List Has Nearly Halved
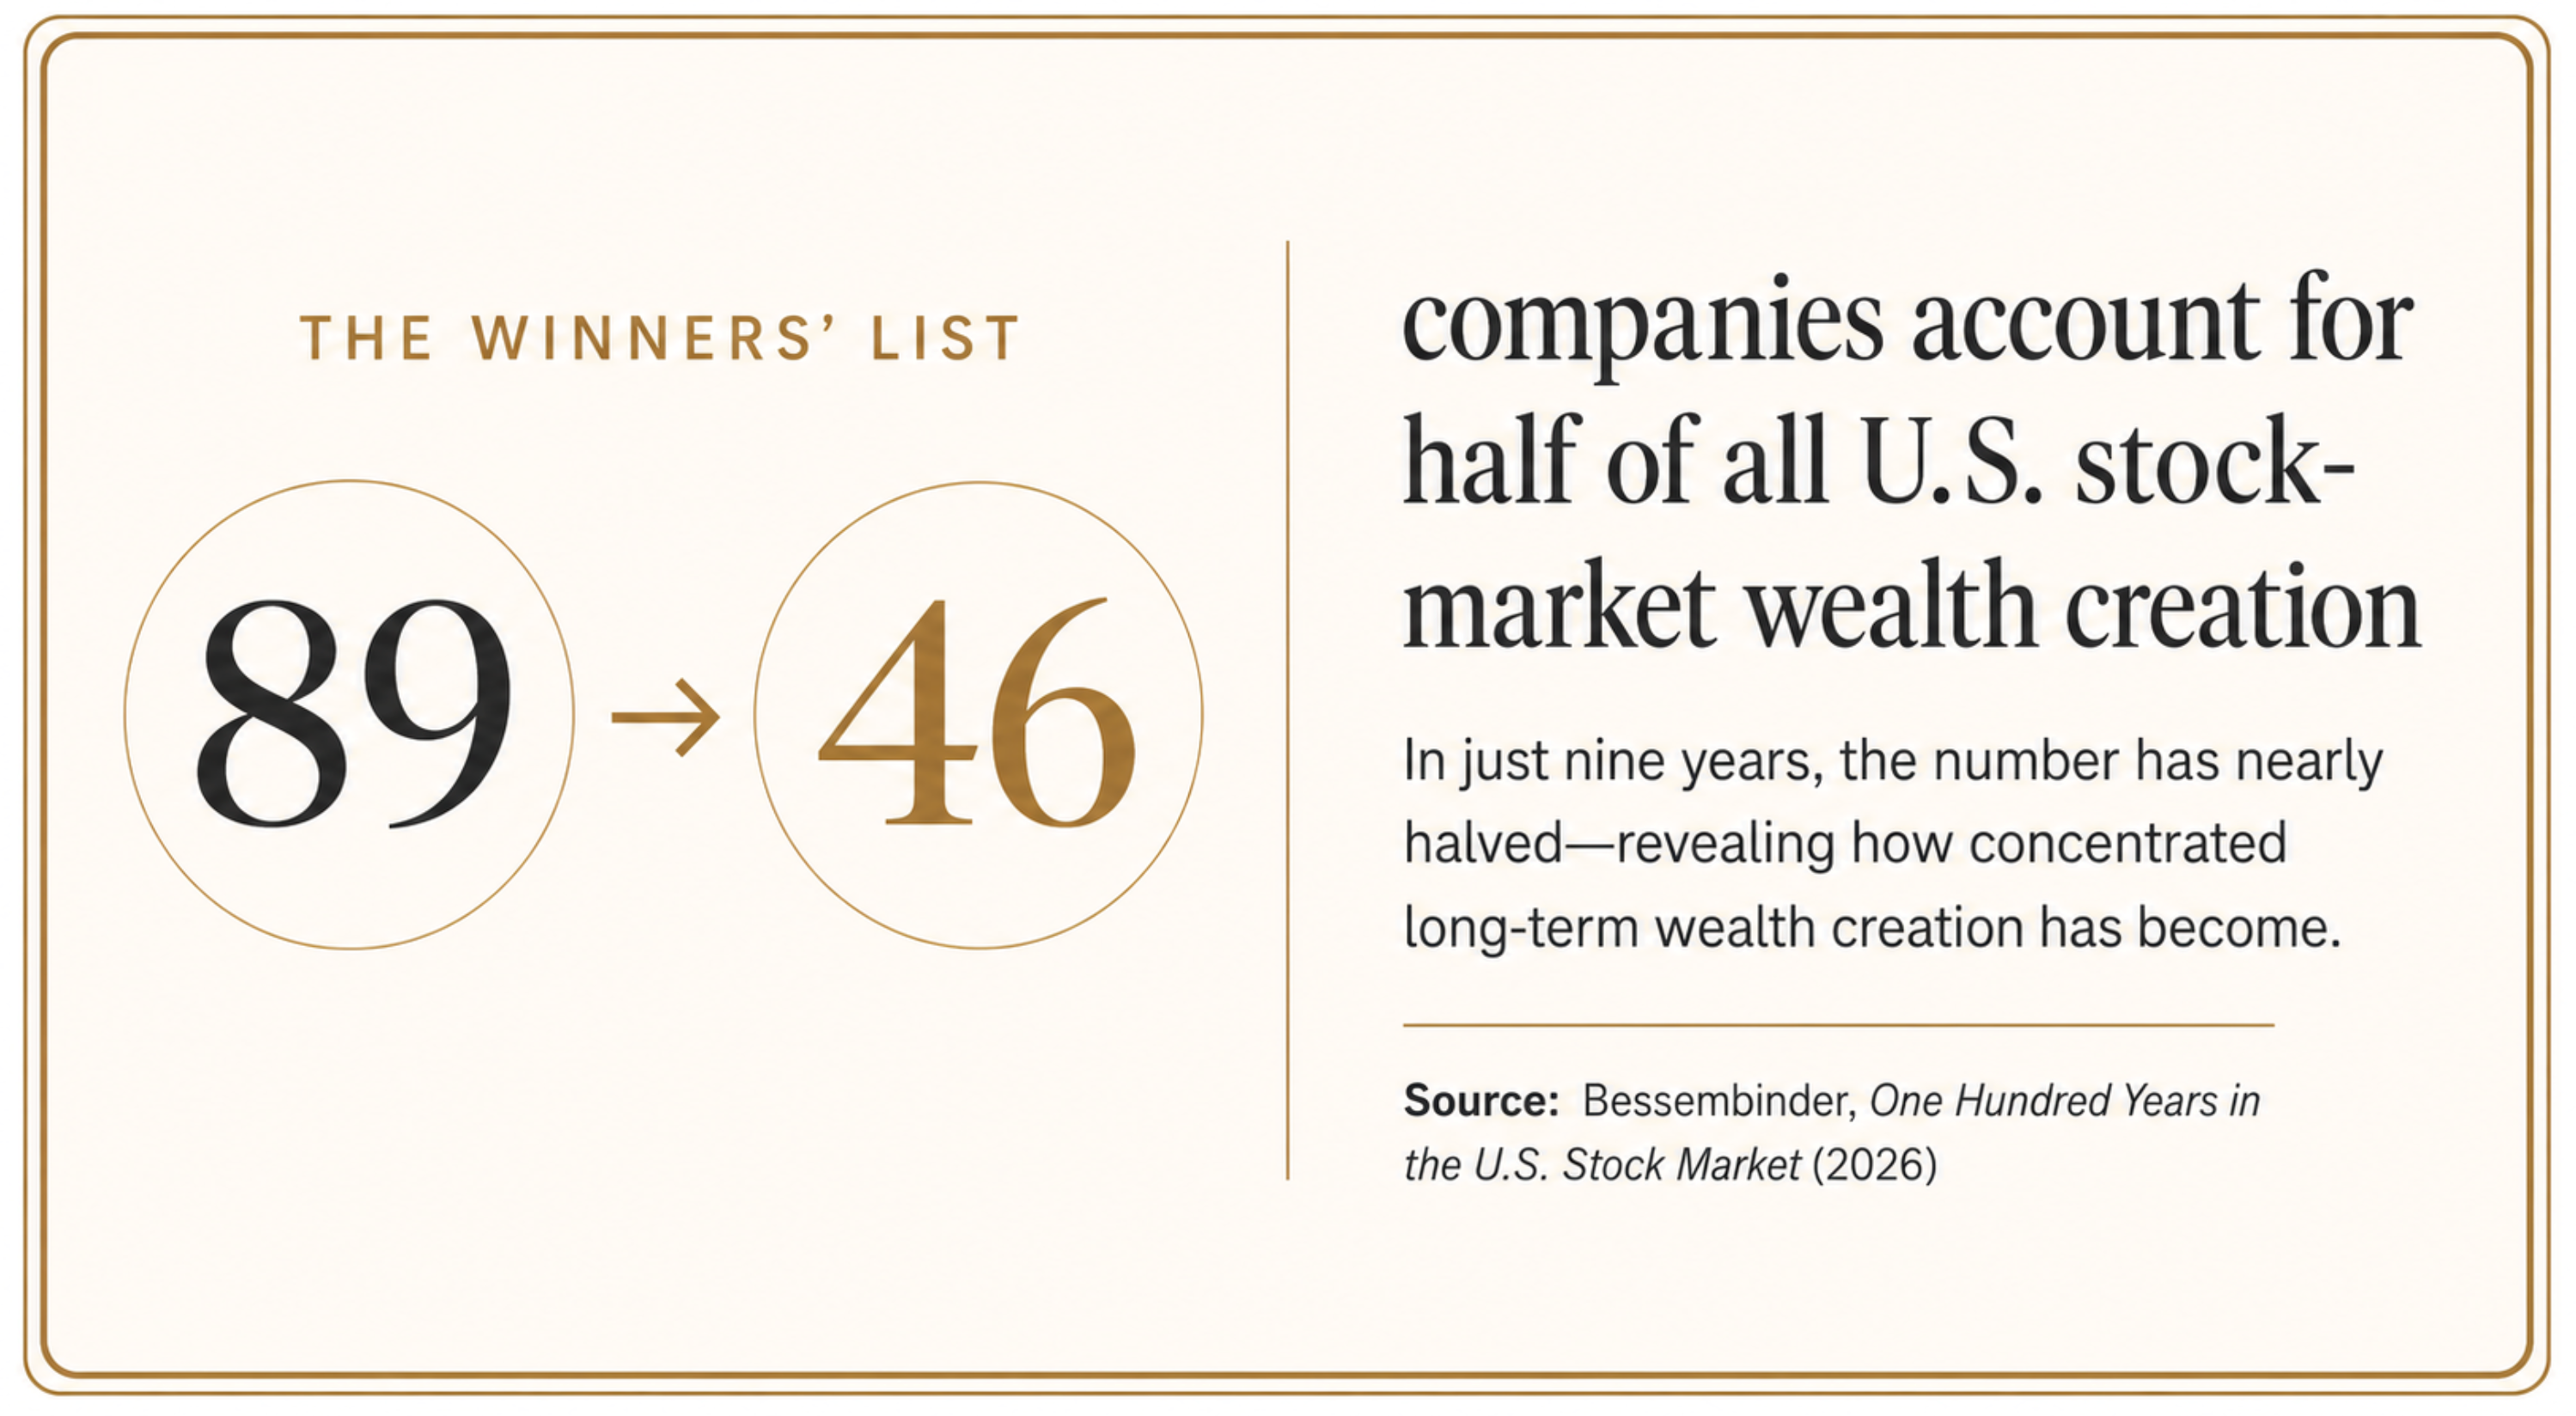
The number of companies responsible for half of everything the US stock market has ever created for shareholders has fallen from 89 to 46 — in nine years.
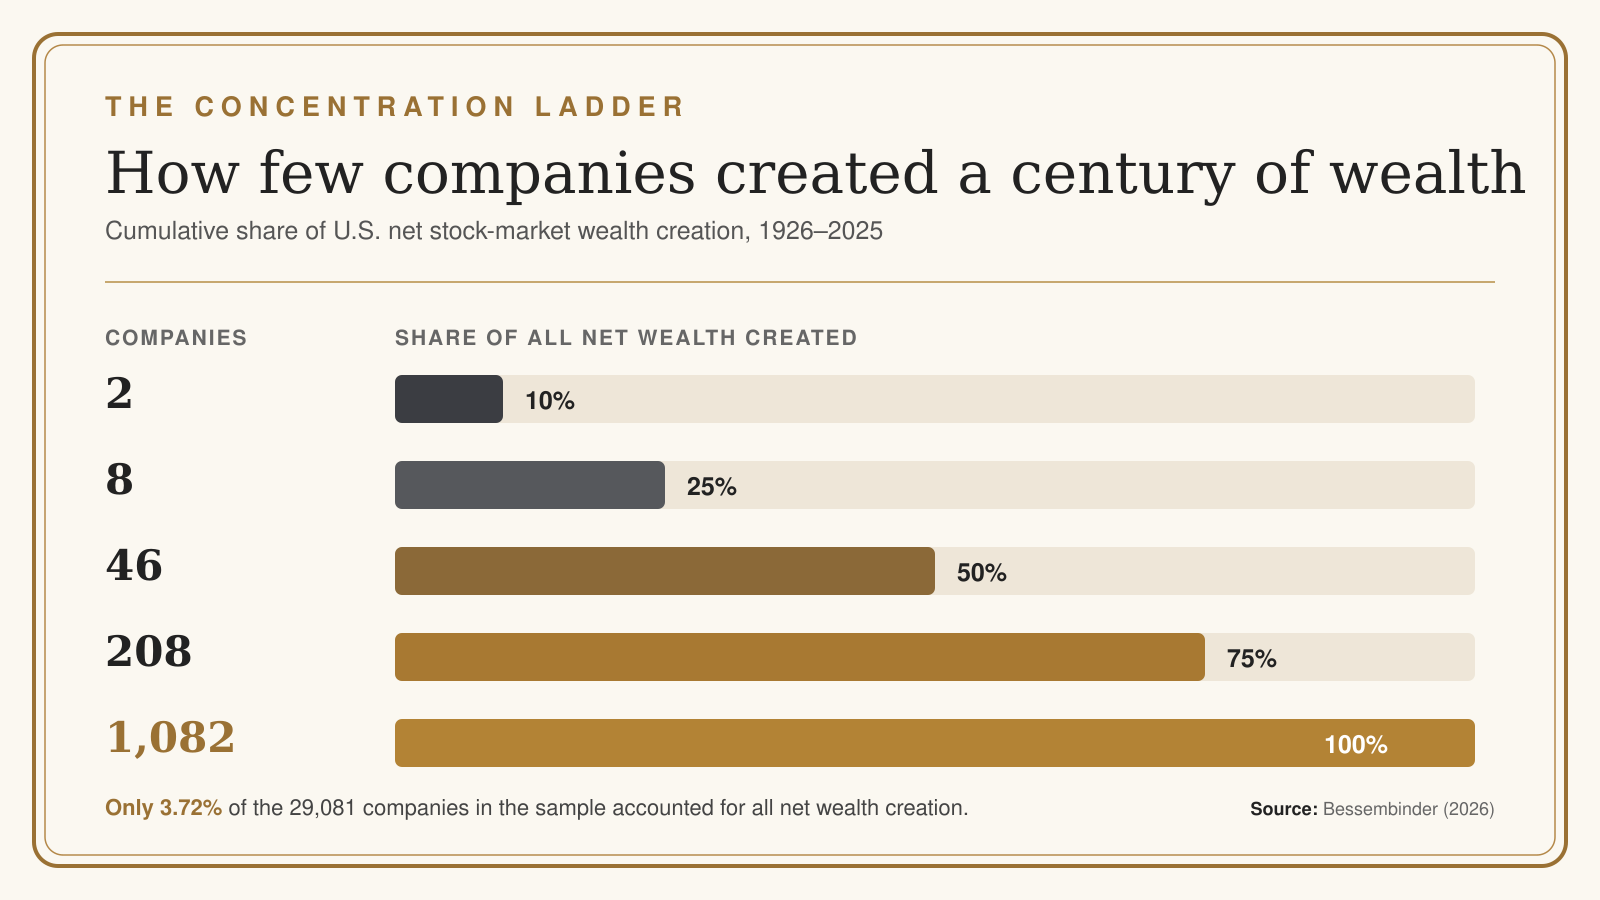
When Bessembinder published his original study, the count stood at 89. Those 89 firms accounted for half of the $42.61 trillion in net wealth the market had created from 1926 through 2016. Run the same analysis across the full century, and 46 firms account for half of roughly $91 trillion ($90.96 trillion, to be exact). The list didn't shrink because the old winners vanished; it shrank because a handful of recent arrivals created wealth on a scale that redrew the table. These are dollar figures for wealth creation, not percentage returns — a distinction that matters later.
The full ladder of stock market concentration is worth spelling out. Over the century, two firms account for 10% of all net wealth creation. Eight firms account for 25%. It takes 46 to reach half, and 208 to reach three quarters. In total, 1,082 companies account for all of it — 3.72% of the 29,081 firms that issued the sample's 29,754 stocks. (Some companies list more than one class of stock, which is why the two counts differ.) And the compression continues: from 2017 through 2025 alone, 13 firms account for half of the period's net wealth creation.
The company-level numbers tell the same story from a different angle. Through 2016, the biggest wealth creator in market history was Exxon Mobil, with 2.89% of the total. Since then, Nvidia alone accounts for 9.32% of all net wealth created post-2016. The top five lifetime creators — Apple ($5.02 trillion, or 5.5% of the century total), Nvidia ($4.58 trillion), Microsoft ($4.03 trillion), Alphabet ($3.57 trillion), and Amazon ($2.27 trillion) — together represent 21.4% of everything the market has produced in 100 years.
In April, working from the older datasets, we tracked this trend as 90 stocks, then 83, then 72 — the shrinking needle in the haystack. The full-century answer is 46.
Fewer Winners, Longer Odds
As the winners' list shrinks, the odds facing anyone trying to hold the right stocks get longer — and they were already poor.
Across all 29,754 stocks in the century-long sample, the median lifetime buy-and-hold return was −6.87%. That figure describes the middle of the distribution, not the tail. Only 48.22% of stocks produced any positive return over their lifetimes; only 41.17% beat one-month Treasury bills; and only 27.60% beat the value-weighted market. Measured against a T-bill benchmark, 59.13% of firms — nearly six in ten — reduced shareholder wealth over their time on the market. For most stocks in the historical sample, investors would have done better in T-bills — about as close to risk-free as investing gets. These are figures for individual stocks held over their lifetimes, incidentally, not the returns of an index.
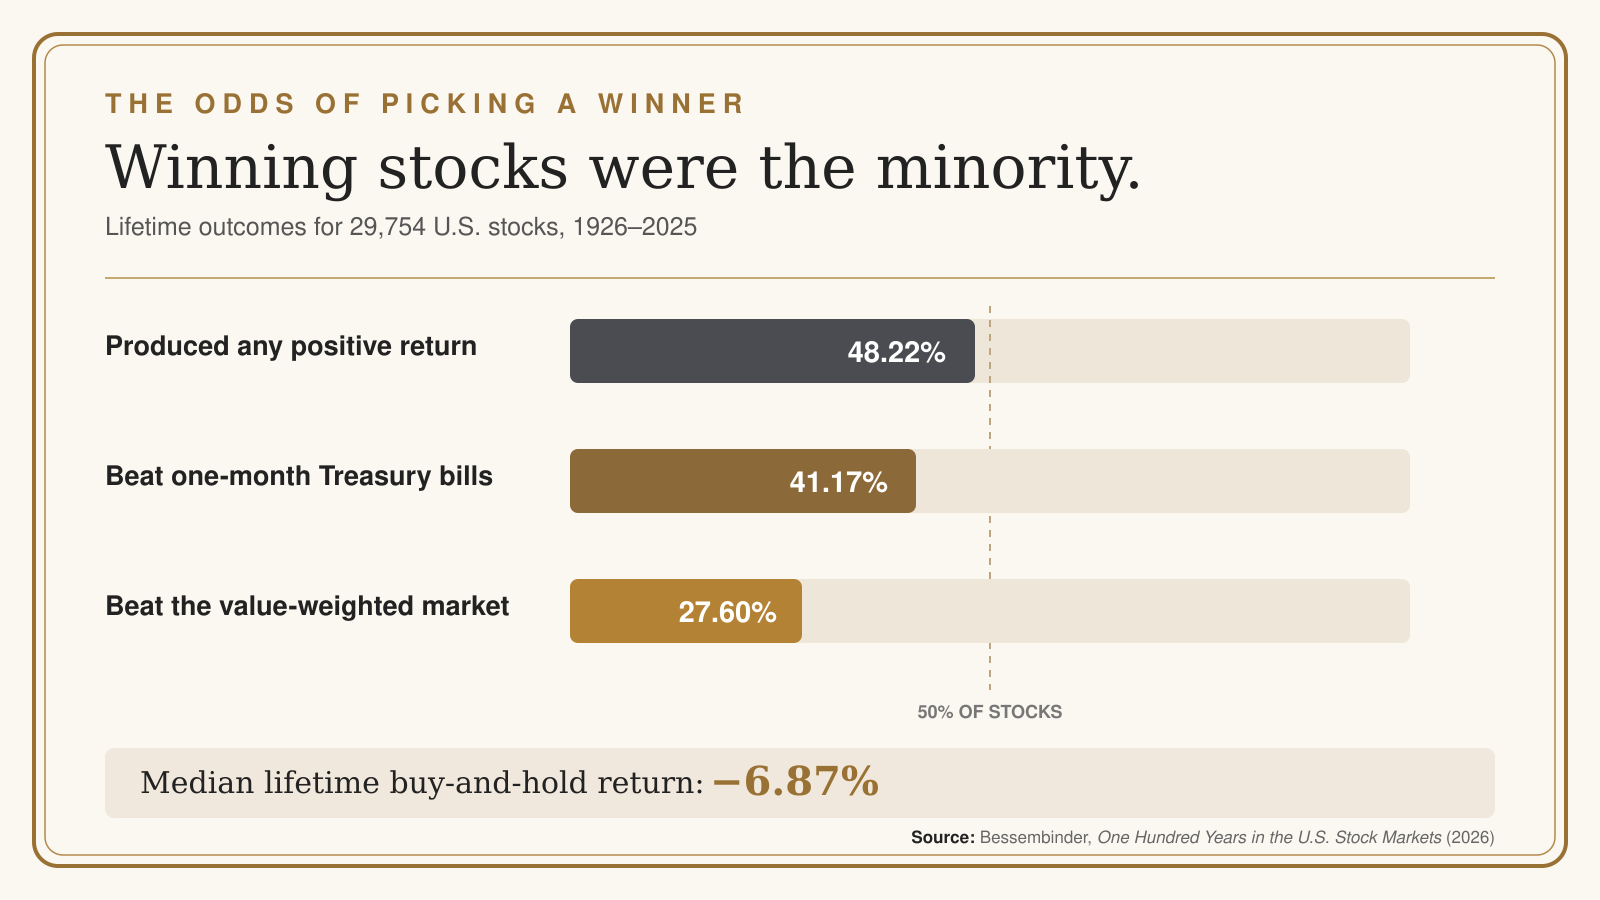
How do those numbers square with a market that created $91 trillion? Through skew. The average buy-and-hold return across stocks was 30,621%, dragged skyward by a handful of extreme winners while the typical stock went nowhere.
And the odds have been deteriorating. Across the first six decades of the sample, the median stock's ten-year return averaged 63.6%. Across the most recent four decades, it averaged 5.8%. The share of stocks beating T-bills over ten-year horizons fell from an average of 61.2% in the first six decades to 47.9% in the most recent four. Bessembinder attributes part of that deterioration to the surge of younger, smaller companies listing from the 1970s onward, citing earlier work by Fama and French. A necessary caution: all of this describes what happened, not what will — a century of record, not a promise.
So why does the market work this way?
Where the Skew Comes From
There's no conspiracy behind stock market concentration, and no accident either. Compounding does this to volatile returns, given enough time.
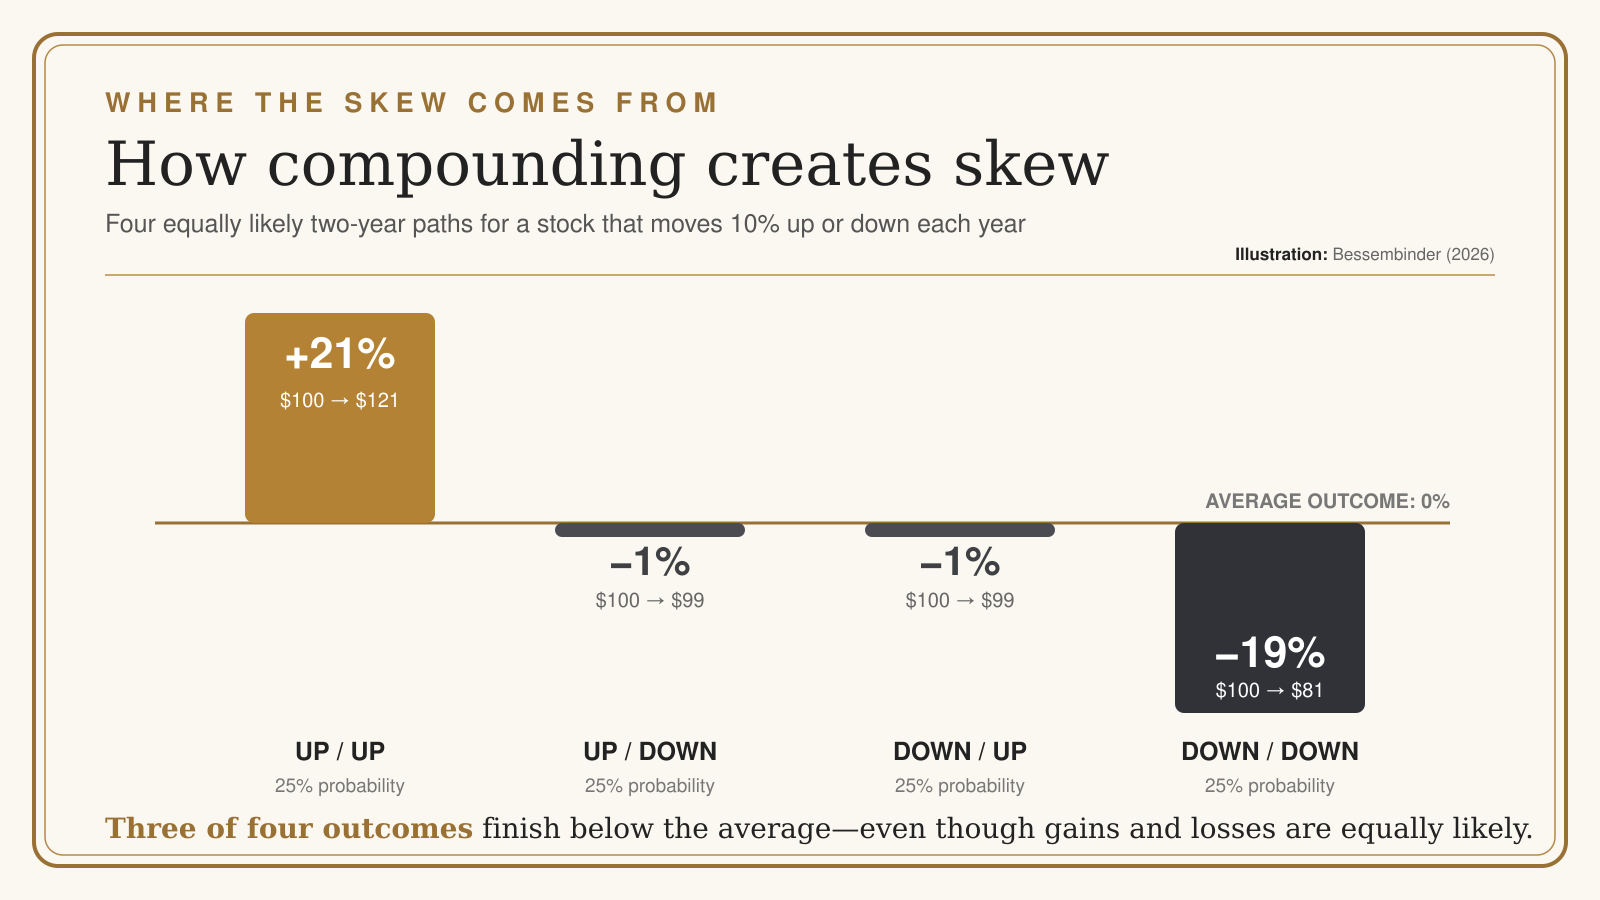
A stock can lose at most 100% of its value. Its upside has no ceiling. Bessembinder illustrates what that asymmetry does over time with a simple example. Take a stock that moves 10% a year, up or down. Two up years compound to a 21% gain. Two down years compound to a 19% loss. One of each leaves you down about 1%. Now look at the four equally likely outcomes together: they average out to roughly zero, but three of the four sit below that average, and only one — the double winner — pulls ahead. That is skewness, manufactured by nothing more than compounding. Stretch two years into decades across thousands of stocks, and the typical outcome falls further below the average while a shrinking handful of compounders pulls further ahead.
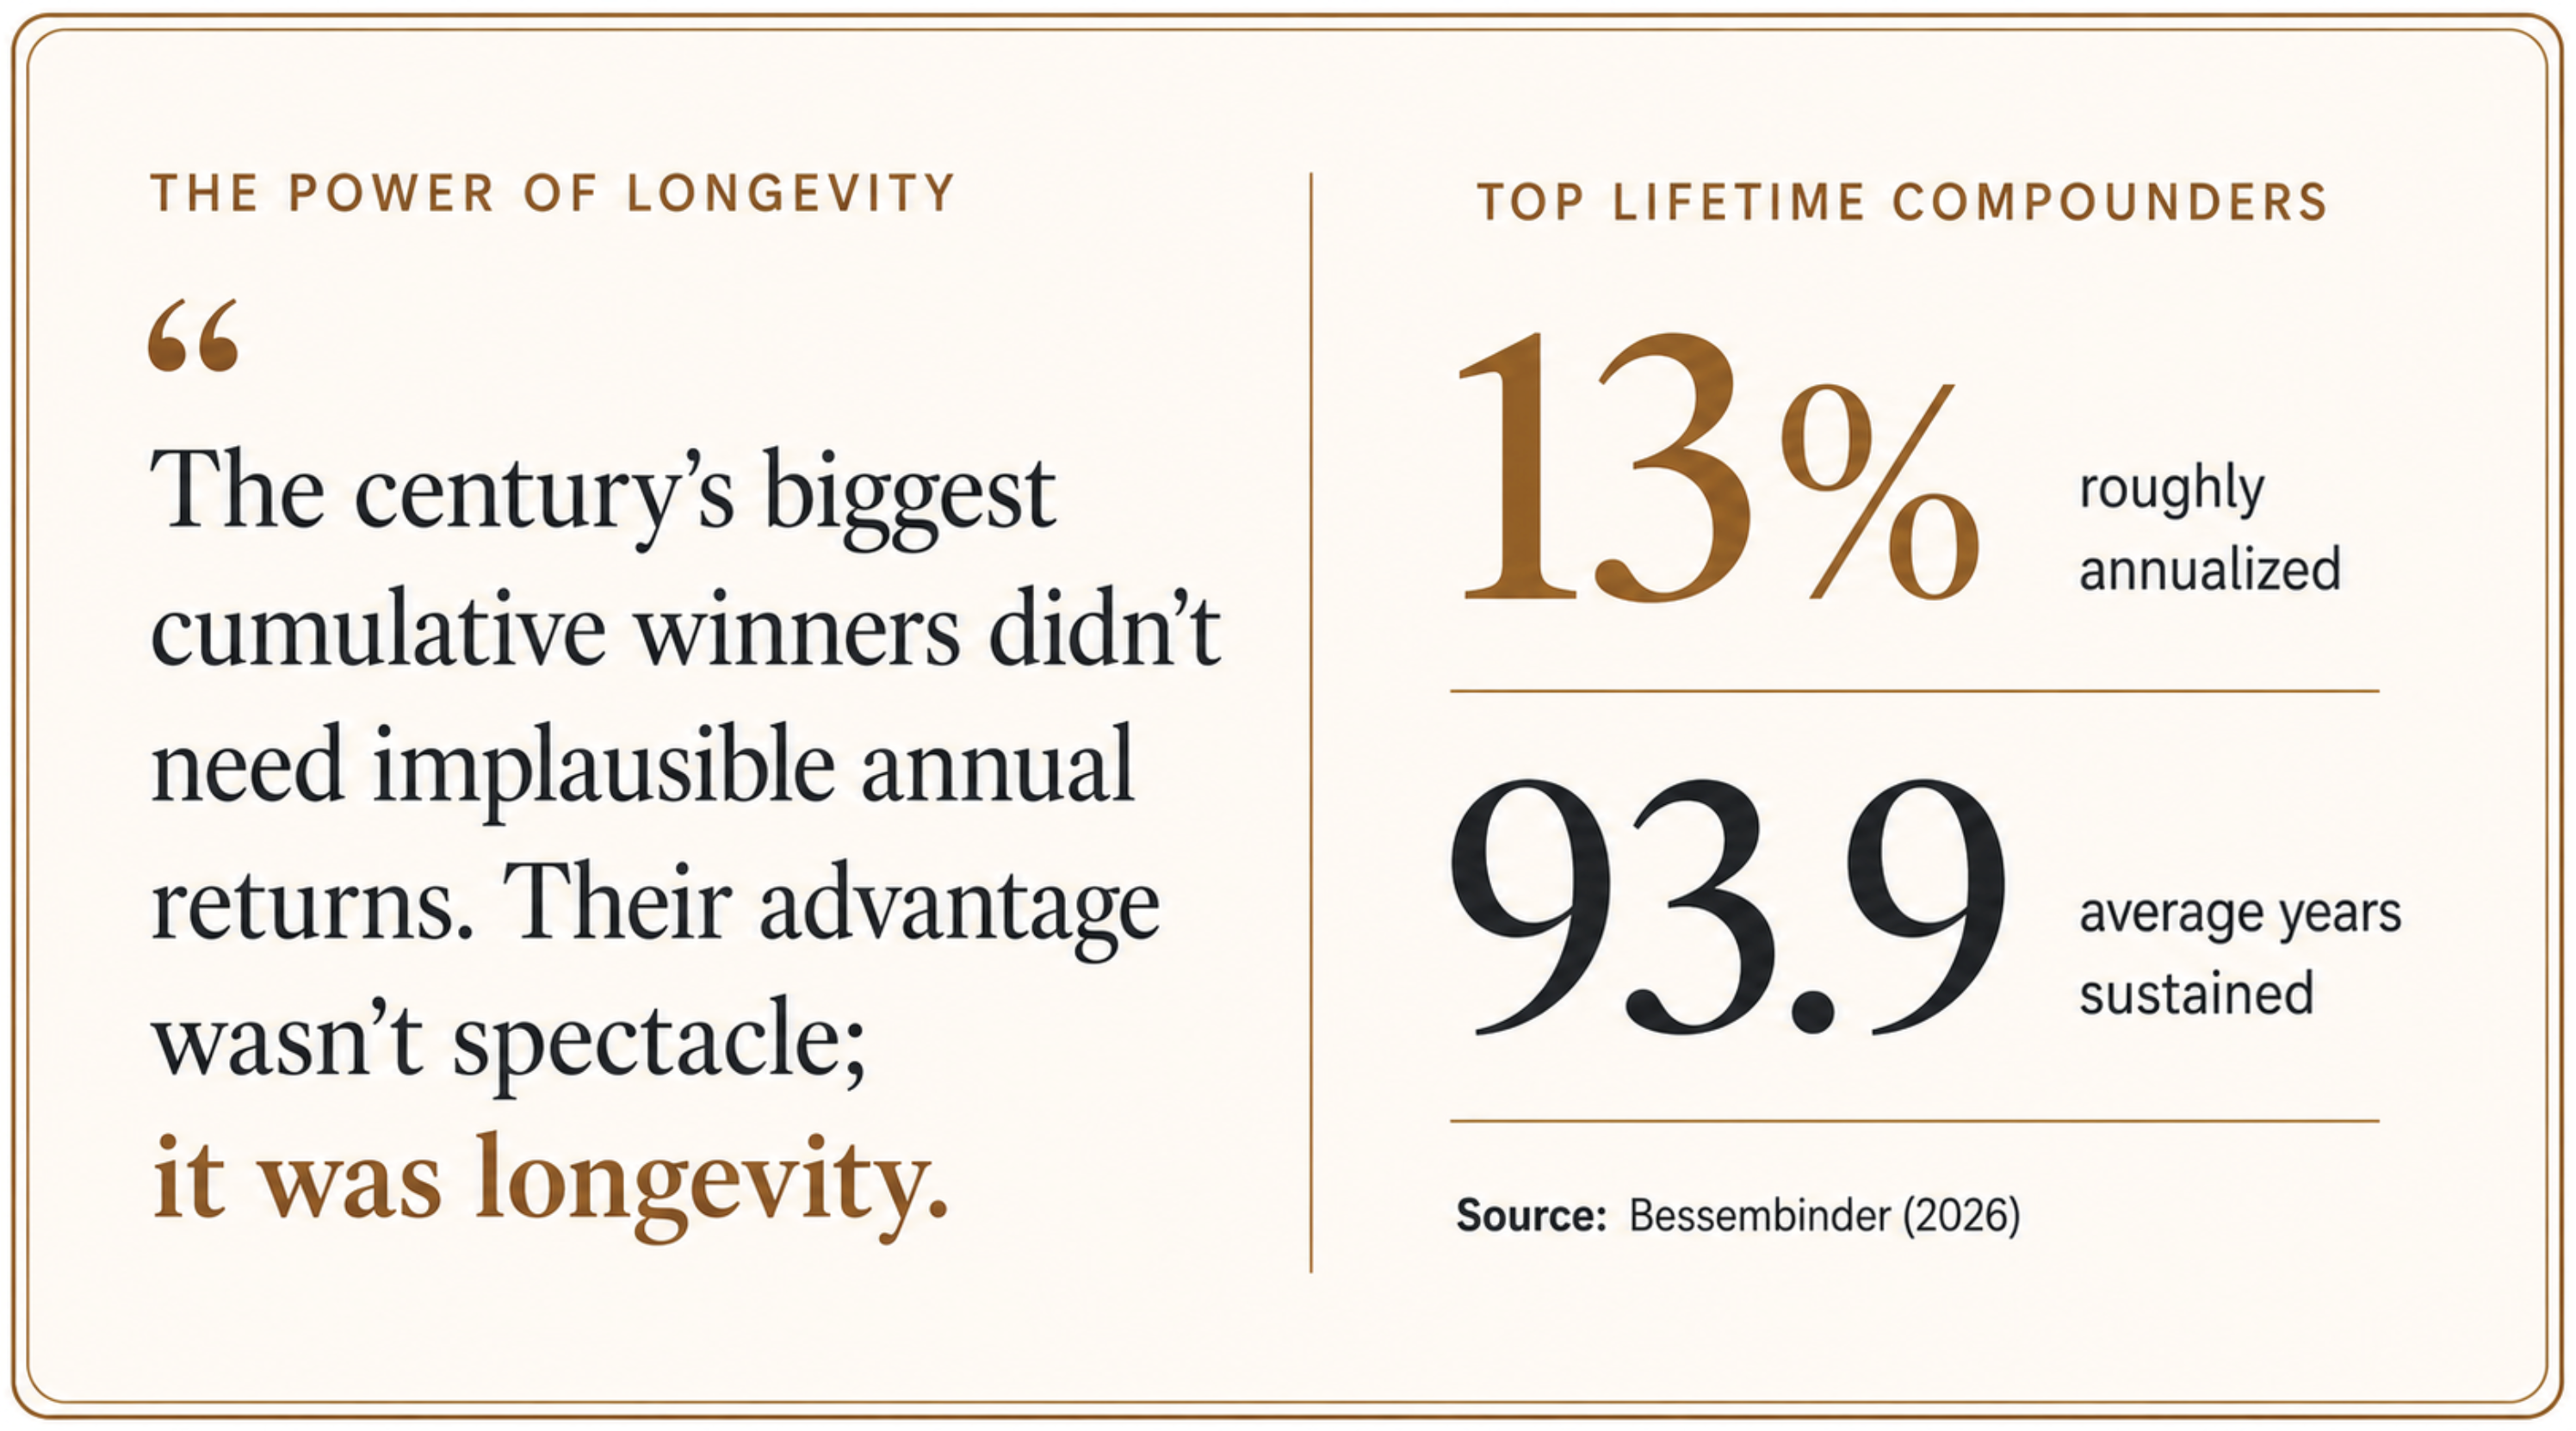
The counterintuitive corollary: the century's biggest cumulative winners didn't need implausible annual returns. The top lifetime compounders delivered roughly 13% annualized — strong, but hardly astronomical — sustained for an average of 93.9 years. Their advantage wasn't spectacle; it was longevity.
What the mechanics don't explain is the acceleration. Bessembinder explicitly declines to say whether concentration will keep intensifying. Candidate explanations exist — the "superstar firms" dynamics documented by Autor, Dorn, Katz, Patterson, and Van Reenen in 2020, for instance — but they remain candidates, and he doesn't endorse any of them.
Which brings us to the tempting thought: if a shrinking club of winners takes all, why not just own the winners?
Why Buying the Obvious Winners Doesn't Work
The most tempting response to this data — concentrating your portfolio in the companies that have already won — is one the data may provide less support for than some investors assume.
The misreading is understandable. Some commentary has treated this research as a case for holding fewer, bigger, proven winners, with broad diversification dismissed as a drag on returns. Bessembinder has heard of conferences where both sides of the diversification debate cite his paper. The data, though, pushes back on the concentrators in three distinct ways.
First, persistence. Across a full century, not one stock appears on both the list of highest cumulative returns and the list of highest annualized returns. The stocks with the most extreme annual performance were not the ones that created the most cumulative wealth. The stocks that compound fortunes and the stocks that dazzle over short periods are, historically, different stocks.
Second, predictability. The right tail isn't reliably where you'd think to look. Technology stocks, Bessembinder points out, are not disproportionately represented among the biggest lifetime wealth creators — and the century's second-highest lifetime compounder is Vulcan Materials, a company that sells sand and gravel.
Third, the odds of picking. In bootstrap simulations from his 2018 study, single-stock strategies beat the market roughly 4% of the time. When he posed that question to finance-professor colleagues — a story he told on the Rational Reminder podcast in February — their guesses came in above 50%. If the professionals who study markets for a living overestimate their odds by that margin, investors should be cautious about assuming success in selecting future winners.
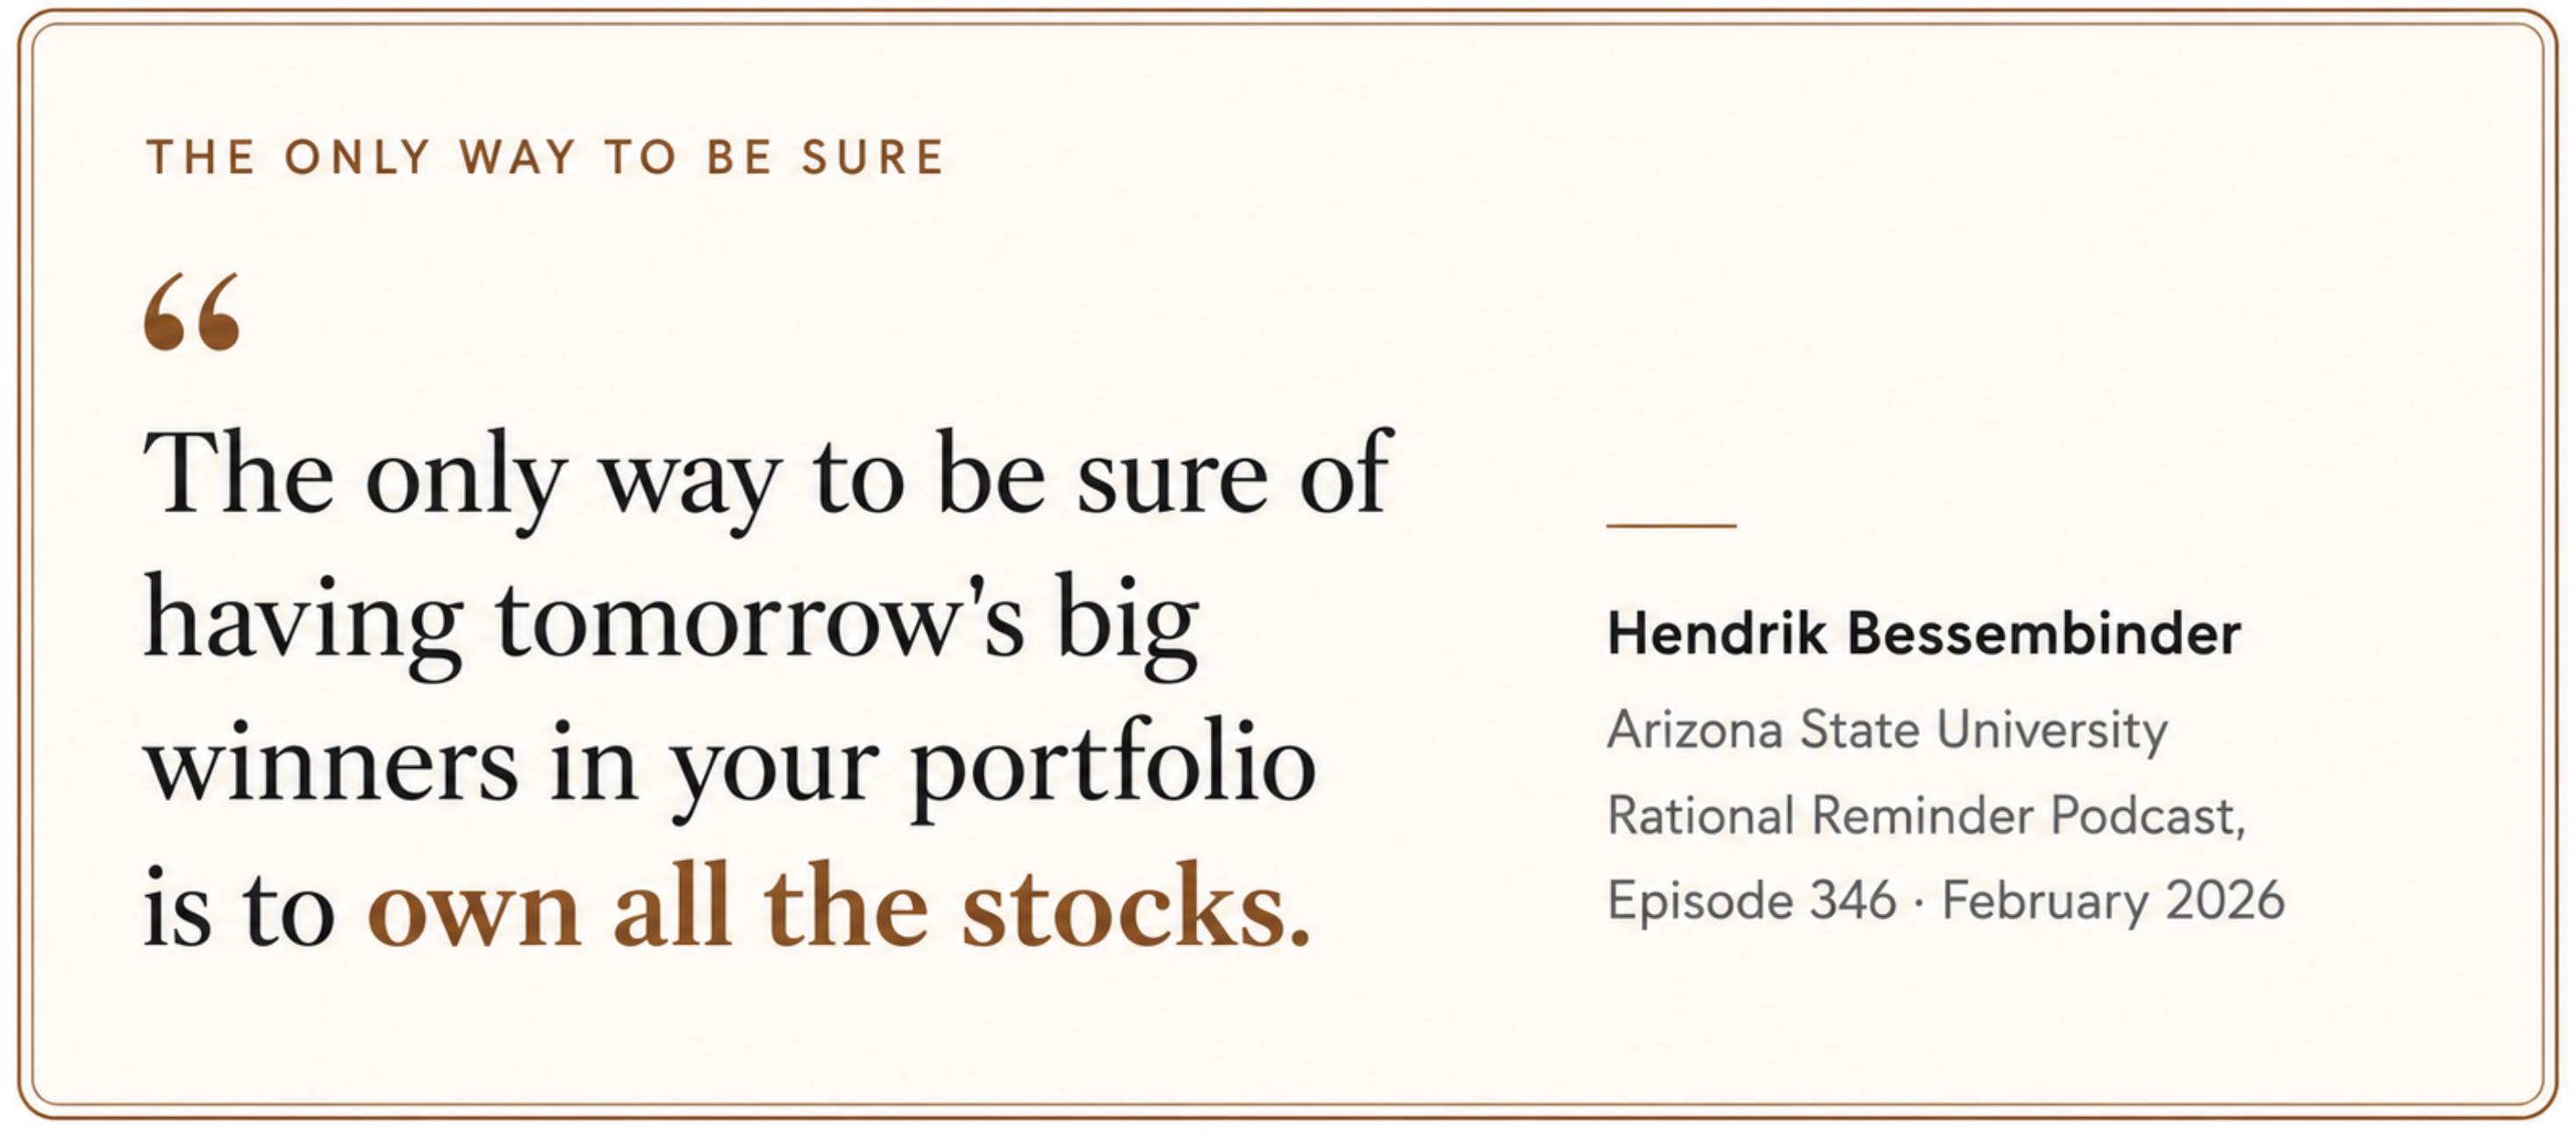
The deeper problem is the difference between looking backward and investing forward. A list of past winners is an observation, not a strategy; the list only exists once the returns are in. As Bessembinder put it on the same podcast: As Bessembinder stated, "The only way to be sure of having tomorrow's big winners in your portfolio is to own all the stocks." And for anyone still tempted, he offered a question worth taping to your monitor: "Are you really skilled, or are you overconfident?"
A fair objection: isn't a cap-weighted index itself concentrated in the same handful of names? It is — and that's the mechanism doing its job. A cap-weighted fund holds every company at its market weight, so as winners emerge it holds them automatically, at growing weight, without ever needing to identify them in advance.
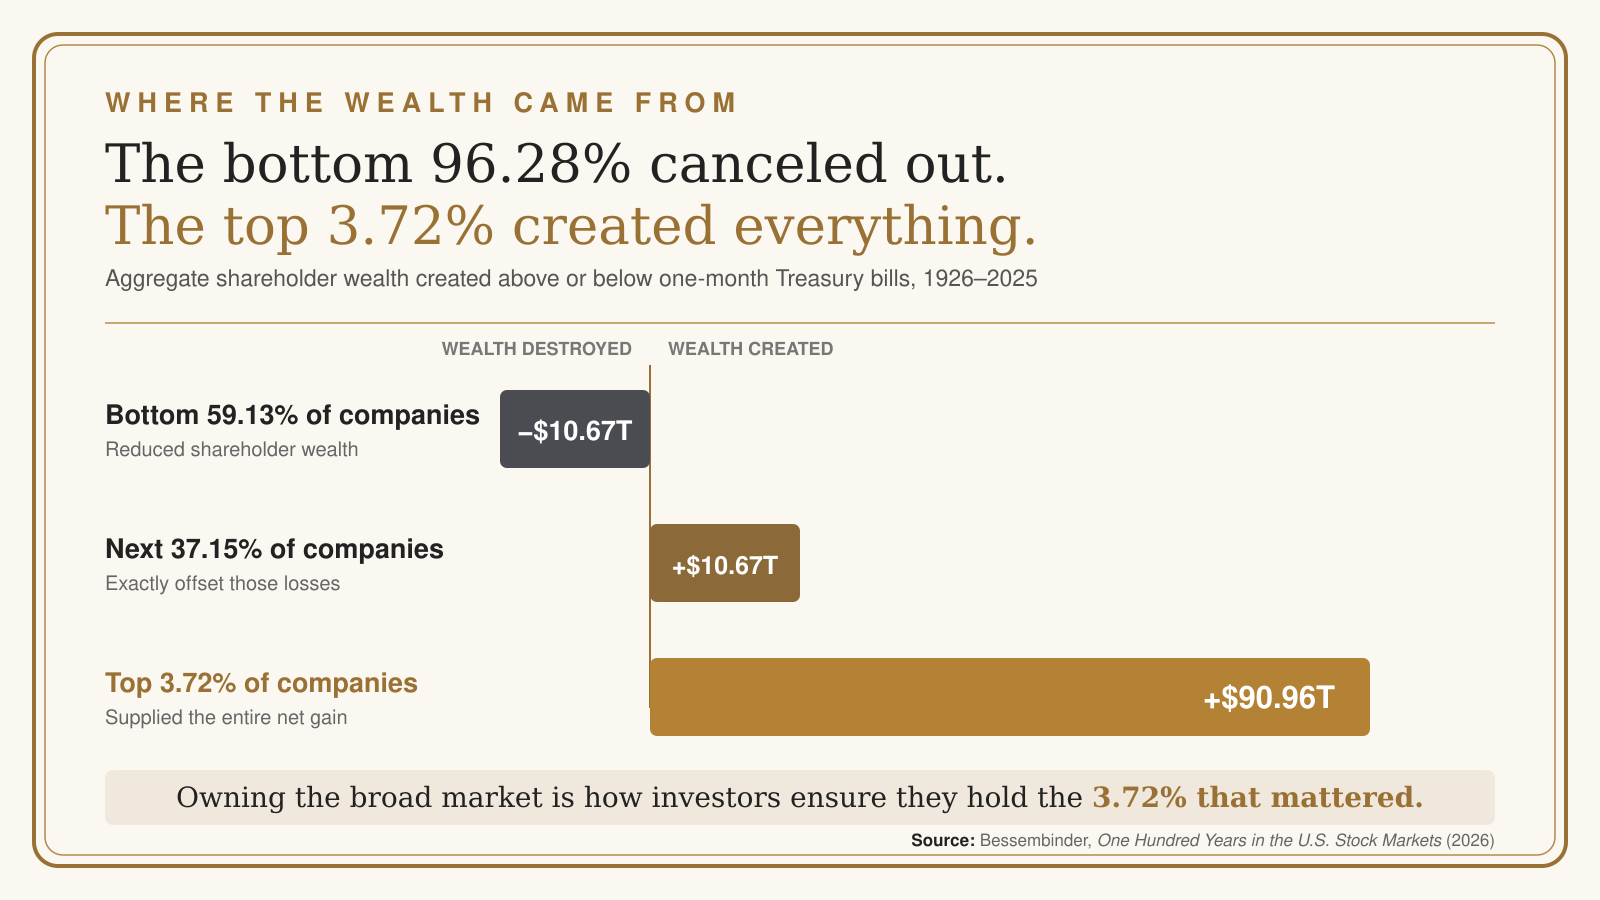
Nor is the price of owning everything else as steep as it looks. In aggregate wealth-creation terms, the bottom 96.28% of firms collectively matched Treasury bills: the 59.13% that destroyed $10.67 trillion of shareholder wealth were offset by the next 37.15%, which created just as much. The 1,082 firms at the top supplied all the net gain. No real portfolio maps neatly onto those aggregates — weighting and timing matter — but the arithmetic makes the point. The also-rans, collectively, were not the drag they are often assumed to be, and owning all of them is how a diversified portfolio ends up holding the 3.72% that mattered.
Plan on the Median, Not the Mean
The same skew that builds the winners' list is sitting inside your retirement plan.
In a right-skewed distribution, most outcomes fall below the average — that was the lesson of the two-year example above, and Bessembinder notes it never entirely disappears, even for diversified portfolios held over long horizons. Diversification mutes the skew dramatically; it doesn't erase it. His practical guidance follows: if you must anchor a plan on a single number, the median is more informative than the mean — and better still is looking at the whole distribution of outcomes, which is what good planning simulations do.
That caution lands hardest in decumulation. A withdrawal plan anchored to average-return assumptions leans on the very number the skew inflates, and retirees have less time and less flexibility than savers to recover if reality comes in below it.
Three practical steps follow. First, audit your concentration — the positions you chose deliberately and the ones that drifted into dominance as they grew — so you know what share of your wealth rides on a handful of names. Second, if you're tempted to concentrate further, put Bessembinder's question to yourself — skilled, or overconfident? — before acting. Third, investors may wish to consider asking a fiduciary advisor to stress-test their plan against the distribution of possible outcomes, not merely average assumptions.
The Only Way to Be Sure
A century of data leaves us with one comparison and one question. The comparison: nine years out-created ninety-one, and whatever the next nine years create, the question that matters for your portfolio is whether the companies that create it are in there. Nobody knows their names yet — which, in our view, is a compelling argument for broad market ownership.
The question comes from Bessembinder himself, at the close of his paper: will artificial intelligence "accelerate the tendency toward 'winner take all' outcomes," or will its broad adoption level the playing field and allow a larger number of specialized firms to thrive? He doesn't claim to know. Neither should we.
That uncertainty is easier to live with than it sounds. The winners' list has changed constantly for a century, and it may keep shrinking. Broad market ownership is one strategy that does not require investors to identify in advance which companies may become future winners.
Resources
Autor, D., Dorn, D., Katz, L. F., Patterson, C., & Van Reenen, J. (2020). The fall of the labor share and the rise of superstar firms. The Quarterly Journal of Economics, 135(2), 645–709.
Bessembinder, H. (2018). Do stocks outperform Treasury bills? Journal of Financial Economics, 129(3), 440–457.
Bessembinder, H. (2026). One hundred years in the U.S. stock markets. SSRN working paper.
Fama, E. F., & French, K. R. (2004). New lists: Fundamentals and survival rates. Journal of Financial Economics, 73(2), 229–269.
Rational Reminder Podcast. (2026, February). Episode 346: Hendrik Bessembinder.
ROBIN POWELL is the Creative Director at Index Fund Advisors (IFA). He is also a financial journalist and the Editor of The Evidence-Based Investor. This article reflects IFA's investment philosophy and is intended for informational purposes only.
DISCLOSURES:
This article is for informational purposes only and does not constitute investment advice, an offer, or a solicitation to buy or sell any security. This material includes general educational information and should not be interpreted as individualized investment advice or a recommendation to take any specific action. Past performance is not indicative of future results. All examples and data cited are based on historical analysis and may not reflect future market conditions. Investing involves risks, including the possiblity of loss and principal. The mathmatical principles discussed illustrate theoretical concepts and should not be interprested as guarantees of investment outcomes. Diversivication does not ensure profit or protect against loss.
Any discussion of regulatory actions is based on publicly available information and should not be interpreted as representative of industry-wide practices. There is no guarantee that reducing turnover or fees will result in improved investment outcomes.
The information discussed is general in nature and may not be suitable for all investors. Examples and studies cited reflect specific time periods and may not be representative of all market conditions or investor experiences. Individual circumstances vary, and readers should consult a qualified professional regarding their personal situation. Index Fund Advisors, Inc. (IFA) believes the information to be accurate but does not guarantee its completeness or accuracy. This article was sourced and prepared with the assistance of artificial intelligence (AI) technology.For more information about Index Fund Advisors, Inc, please review our brochure at https://www.adviserinfo.sec.gov/ or visit www.ifa.com.
















 Home
Home 888-643-3133
 Contact Us
 Newsletter Subscribe
 eMoney
 IFA Apps
 Index Funds Book on Kindle
 Index Funds Audiobook
 Careers
 Facebook
 X
X LinkedIn
 Instagram
 Youtube
 Terms
Terms Index Descriptions