
 Risk Capacity
 Wealth Management
 Outsourced CIO
 Retirement Plans
 Institutional
 Financial
  Open an Account
 IFA App

 Articles
 Charts
 Investor Education ▾
 Fund
Fund
 Store
Store

 Taxes
Taxes Back-testing Disclosures
 Glossary
 Form CRS
The small cap value premium re-emerged in 2026. Then it went away again. Then it came back. Anyone holding out for the numbers to settle first was holding out for something short-run returns never do.
Look at what your portfolio told you about the small cap value premium this year, at four separate moments.
On December 31, 2025, small caps and value stocks had lagged for so long that dropping them would have felt less like panic and more like tidying up. Two months later they were the best thing you owned, and adding to them was the obvious call. By the end of June, growth had taken the lead back, and February's conviction looked like a mistake you were fortunate not to have made. By the end of July, value was ahead again.
Four moments. Four conclusions a sensible person could have reached. All four contradicted by the market within weeks.
The urge to wait for the numbers to settle before touching anything is close to universal, and it feels like discipline. But seven months of relative returns were never going to settle into a verdict. Short-run performance is a running score. It tells you where things stand, and nothing about where they go next.
Evidence is a slower thing: what holds up across decades and across markets. Confuse the two and every quarter arrives looking like a reason to do something.
Which leaves the question the rest of this piece is about. What is an investor supposed to do with a scoreboard that reverses faster than they can act on it?
The Two Months That Rewrote an Entire Year
In January and February, US small cap and value stocks moved so sharply that a full year's relative performance flipped from negative to positive while most of that year stayed where it was.
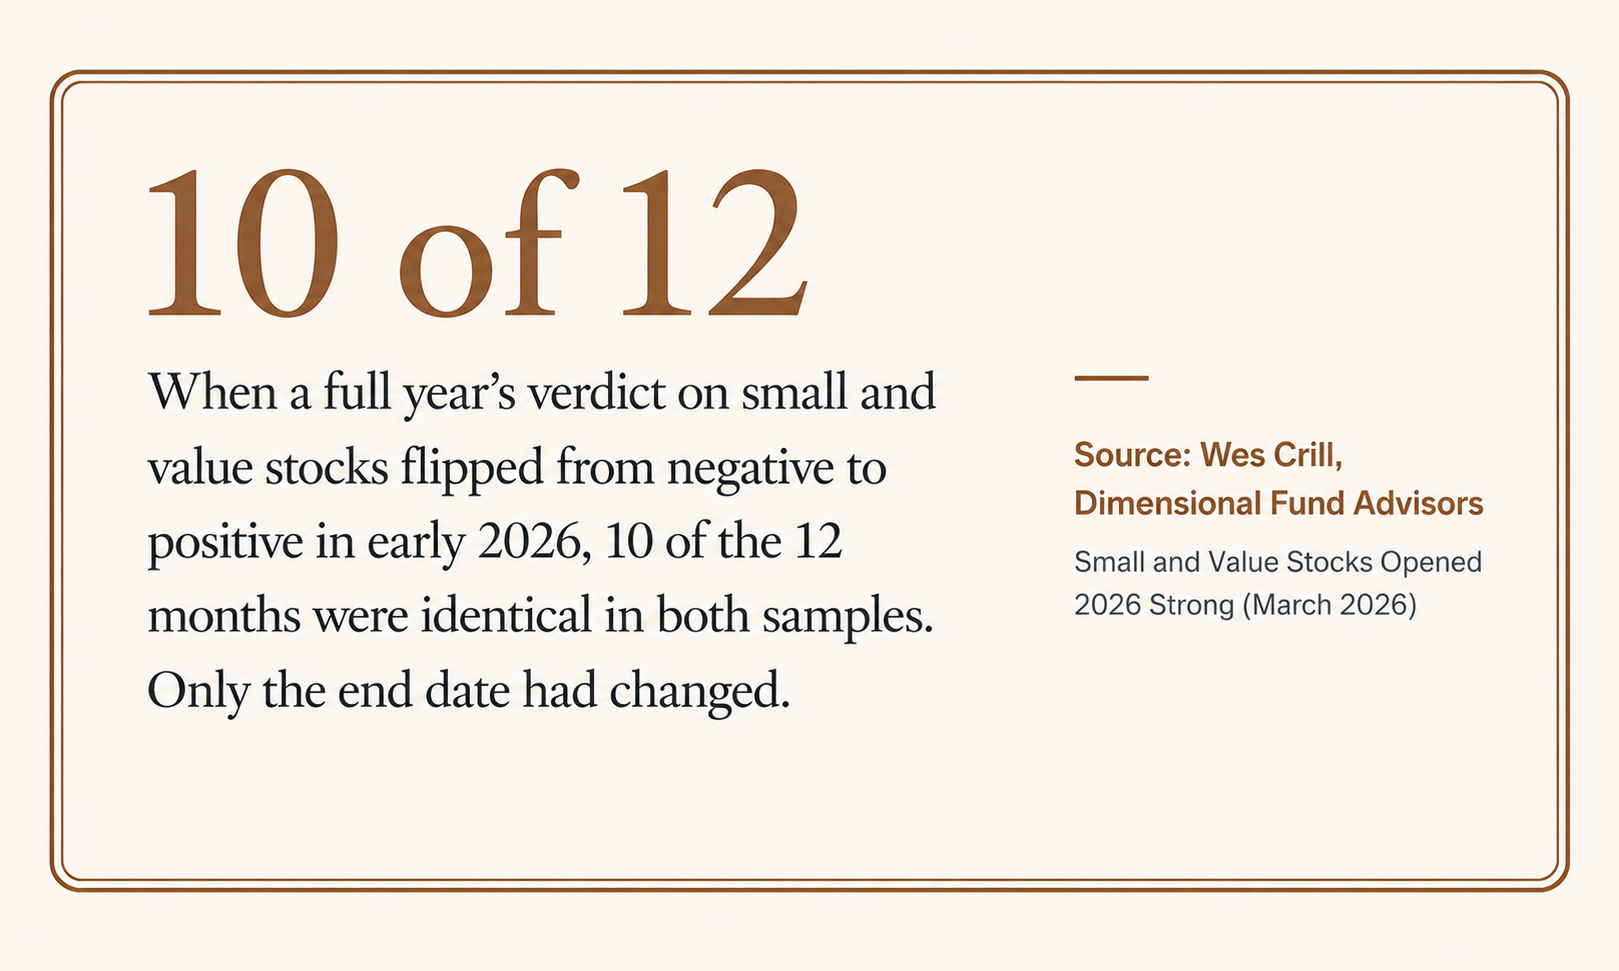
Wes Crill, a senior client solutions director at Dimensional Fund Advisors, set out the arithmetic in a paper published on March 23, 2026 and reprinted on ifa.com. "Relative returns for small versus large and value versus growth all flipped from negative to positive when the one-year end date moved from December to February," he wrote. "That's despite 10 of the 12 months being identical in both samples."
Across those two months, the return difference between large cap value and large cap growth was 12.1 percent, the fifth largest gap among all rolling two-month periods since January 1979.
But the size matters less than what it did to the scoreboard. Two months of fresh data reversed the verdict on a full year, and nothing new had been learned about the other 10 months. They were the same 10 months either way. The signal moved because the calendar stopped somewhere else.
Crill's own conclusion was about market timing: missing periods of outsized returns dents long-term performance. A second lesson runs underneath it. The numbers investors think they are waiting for depend on decisions they didn't make and mostly aren't aware of — starting with the date they happen to check.
Then Value Handed Some of It Back
By the second quarter, the reversal had partly reversed. An investor who waited until spring for confirmation received confirmation of the opposite.
IFA's own Q2 2026 Market Review, published on July 27, 2026, shows growth ahead of value on both size bands for the quarter. US Small Growth returned 18.66 percent against 11.22 percent for US Small Cap Value. US Large Growth returned 10.76 percent against 10.59 percent for US Large Value. Those are IFA index returns, which are hypothetical, back-tested, and shown before advisory fees.
Vanguard described the same stall from a different angle. In a note published on July 22, 2026, it reported that growth stock valuations climbed from the 58th percentile to the 77th over the quarter, while value stock valuations barely moved and stayed closer to fair value than growth or small cap stocks. Its summary was flat: "The strong second-quarter rebound interrupted the first-quarter rotation into value stocks." Vanguard cautions, though, that valuations predict poorly over the short and intermediate term and shouldn't drive an allocation change.
Value then regained the lead over the course of July, and on the year to date it was a long way ahead again. Confirmation arrived, expired, and arrived again inside seven months.
What Counts as Value Depends on Who Is Counting
Part of the value index's 2026 performance has a duller explanation than value stocks beating growth stocks. Some of it came from FTSE Russell moving several of the market's largest growth companies into the value column.
Russell indices are reconstituted periodically, and in June 2026 the style assignments changed. FTSE Russell's own reconstitution release describes Apple and Microsoft moving from fully growth classifications to a blend of growth and value, Amazon shifting substantially toward value, and Alphabet transitioning to 100 percent growth.
The effect is visible in the index's top holdings. As of July 31, 2026, the largest constituent of the Russell 1000 Value Index is Amazon, with Apple second and Microsoft third. Apple and Microsoft also sit in the top ten of the Russell 1000 Growth Index.
None of which makes the Russell figures wrong. They measure broad style performance by published rules. But a headline value index return measures a set of companies a committee reassigned, not some timeless economic category. Index providers draw the line in different places, and they redraw it — so a fund carrying the word in its name doesn't guarantee the exposure an investor assumes they are buying.
So there are two moving parts. When you stop the clock changes the answer. Where the line is drawn changes it too. Both are choices made by somebody else. Read the scoreboard below with that in mind.
Value Led in Both Markets. Small Caps Only in One.
Through July, value outperformed in both the US and international markets. Small caps beat the broad market at home and lagged it abroad.
Every figure that follows is a gross total return in US dollars, for the year to July 31, 2026, taken from the index providers' own factsheets.
In the US, the Russell 1000 Value Index returned 20.67 percent against 0.32 percent for the Russell 1000 Growth Index, with the broad Russell 1000 between them at 9.93 percent. That 20-point spread is the figure the previous section should make you cautious about: some of it is Amazon. The Russell 2000, which covers US small caps and escapes the style reassignment, returned 18.85 percent.
Overseas, the pattern splits. MSCI World ex USA Value returned 17.59 percent against 11.85 percent for MSCI World ex USA. But MSCI World ex USA Small Cap returned 9.55 percent. It lagged.
Small and value get discussed as though they were a single trade. They are two dimensions of expected return, and their realized premiums differ across periods and markets, as they did here inside seven months. That divergence is why they are worth treating separately.
It's also the argument for holding both. If every component of a globally diversified portfolio outperformed at the same time, the diversification would be doing less work than the label suggests. And none of these figures says anything about what comes next: past performance is not a guide to future returns.
The Premium Was Paying Before Anyone Noticed
This year isn't where the story starts. The evidence sits in the longer record, and it doesn't depend on how a commercial index provider assigned Apple.
Larry Swedroe made the case in May, in "The Curious Case of 'Dead' Factors." Working from academic index definitions that don't get rebuilt when a committee meets, he showed the Fama-French US small value index returning 19.7 percent annualized from October 2020 through March 2026, against 13.8 percent for the total US market. Dimensional's International Small Value index ran at 19.1 percent annualized through April 2026, against 12.9 percent for the broader international market.
The tilt shows up in commercial indices too, which is why the international small cap figure above understates what a value investor overseas experienced. MSCI's World ex USA Small Cap Value Weighted Index, which reweights that index toward cheaper stocks on sales, book value, earnings, and cash earnings, returned 39.50 percent in 2025 and 12.73 percent for the year to July 31, 2026, against 34.07 percent and 9.21 percent for the index it reweights. Both sets are net returns, rather than the gross figures quoted earlier.
The premium had been running well above its long-run history for five years before this year's headlines arrived to announce it.
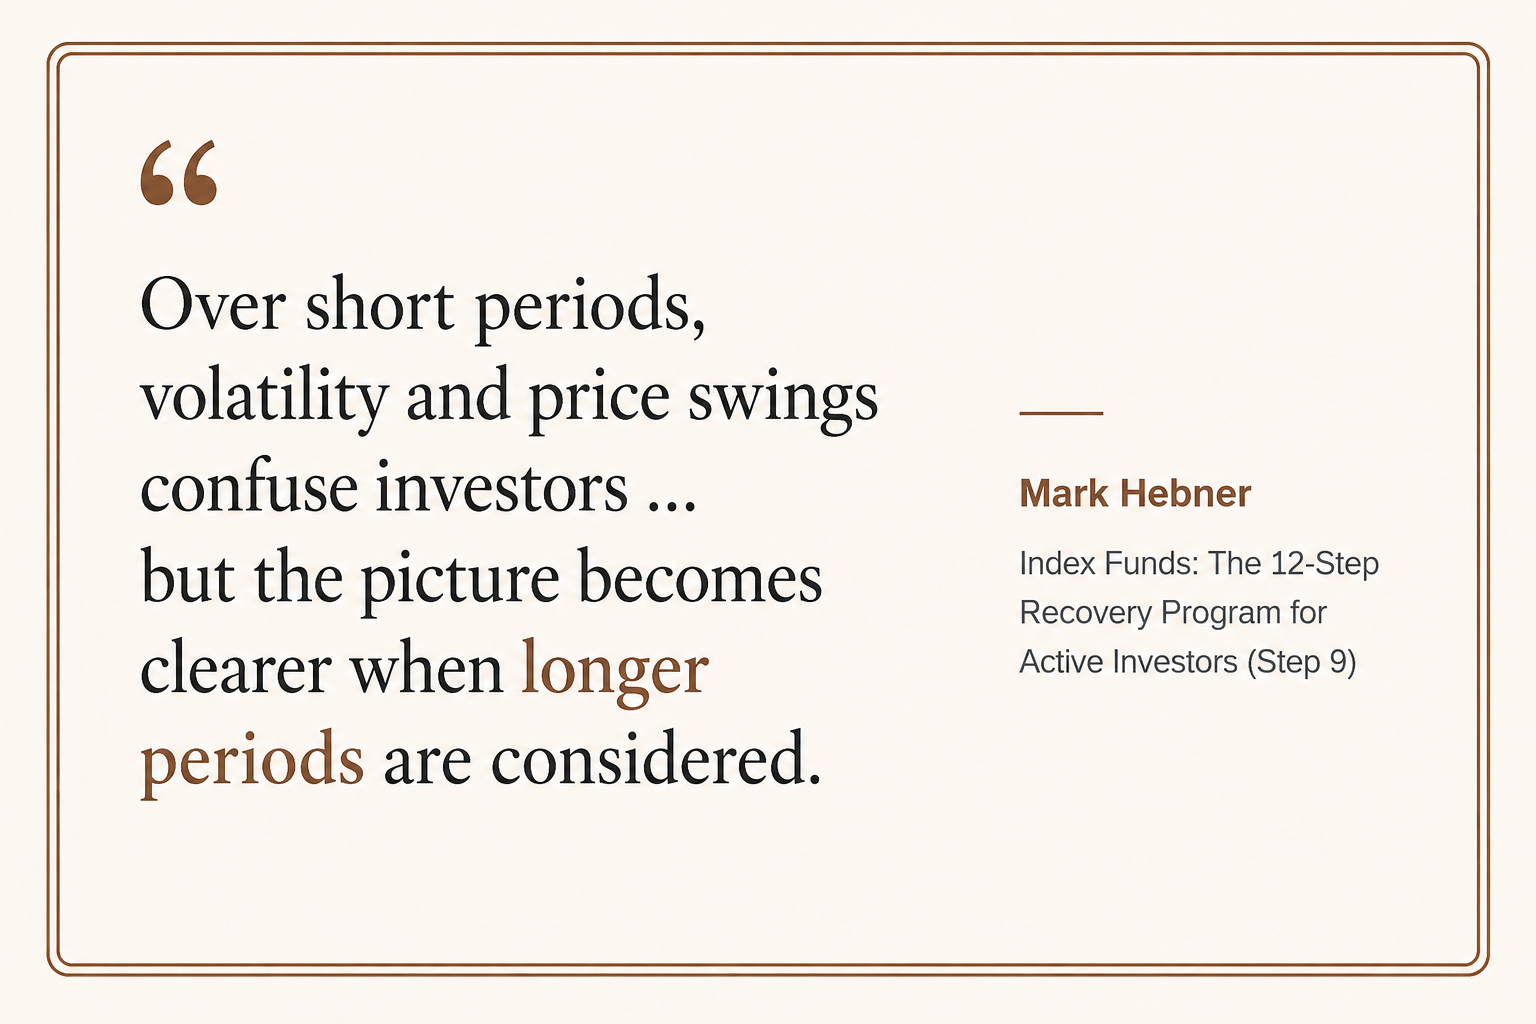
Whatever their precise source — and both risk-based and behavioral explanations have their advocates — factor premiums have historically arrived unpredictably and in concentrated bursts. Value stocks carry lower prices relative to earnings or book value. Smaller companies are less established and more exposed to economic and financing conditions. Greater uncertainty is a common reason that the expected return may be higher, which is also why the premium can go missing for years at a stretch. It isn't a contractual payment.
Human behavior reliably converts that unpredictability into missed returns. Vanguard supplied the behavioral half in passing: the second-quarter valuation expansion happened as "investors rotated back toward AI beneficiaries and cyclical segments following the outperformance of value stocks in the first quarter." Investors rotated away, that is, immediately after being handed what they had been waiting for.
"Investors often make a critical mistake: they extrapolate recent history indefinitely," Swedroe wrote. "When a premium underperforms for an extended period, it is declared dead. When it rebounds, the shift is often dismissed as temporary or overlooked entirely."
What a Year Like This Actually Asks of You
The useful response to 2026 is to check that the allocation was built on something other than last year's returns.
Go back to the four snapshots. Each looked like a moment to act on. None of them was.
The questions worth asking after a year like this are not about what value did last quarter. Is the allocation written down anywhere? Can you explain why you hold these exposures, in terms that would have applied equally in 2019? Are you more concentrated than you meant to be? Have your circumstances or your capacity for risk changed? Is a scheduled rebalance due? And, given how the value line moved this year: do you know what your value fund counts as value?
The reasons not to act are easier to list, because this year has supplied most of them. Value recently beat growth. Small recently beat large. A commentator has announced a new regime. You missed the first leg and don't want to miss the rest.
Small cap and value stocks can underperform the broad market for years, and carry risks it doesn't. Any investment can lose value. Anyone holding these exposures should be prepared for another long stretch like 2014 to 2020. That possibility is part of what the exposure is, not a sign that something has stopped working.
The purpose of owning exposure to the small cap value premium was never to predict when it would pay off. It was to be invested when it does.
ROBIN POWELL is the Creative Director at Index Fund Advisors (IFA). He is also a financial journalist and the Editor of The Evidence-Based Investor. This article reflects IFA's investment philosophy and is intended for informational purposes only.
Data sources include Dimensional Fund Advisors, FTSE Russell, MSCI, Vanguard, and other third-party sources believed to be reliable; however, accuracy cannot be guaranteed.
Index returns discussed are unmanaged and not available for direct investment. Where noted, certain performance figures may be hypothetical, back-tested, gross of fees, or derived from third-party sources.
DISCLOSURES:
This article is for informational purposes only and does not constitute investment advice, an offer, or a solicitation to buy or sell any security. This material includes general educational information and should not be interpreted as individualized investment advice or a recommendation to take any specific action. Past performance is not indicative of future results. All examples and data cited are based on historical analysis and may not reflect future market conditions. Investing involves risks, including the possible loss of principal. The mathematical principles and academic research discussed illustrate theoretical and historical concepts and should not be interpreted as guarantees of investment outcomes. Diversification does not ensure profit or protect against loss.
Any discussion of regulatory actions is based on publicly available information and should not be interpreted as representative of industry-wide practices. There is no guarantee that reducing turnover or fees will result in improved investment outcomes.
The information discussed is general in nature and may not be suitable for all investors. Examples and studies cited reflect specific time periods and may not be representative of all market conditions or investor experiences. Individual circumstances vary, and readers should consult a qualified professional regarding their personal situation. Index Fund Advisors, Inc. (IFA) believes the information to be accurate but does not guarantee its completeness or accuracy. This article was sourced and prepared with the assistance of artificial intelligence (AI) technology.For more information about Index Fund Advisors, Inc, please review our brochure at https://www.adviserinfo.sec.gov/ or visit www.ifa.com.













 Home
Home 888-643-3133
 Contact Us
 Newsletter Subscribe
 eMoney
 IFA Apps
 Index Funds Book on Kindle
 Index Funds Audiobook
 Careers
 Facebook
 X
X LinkedIn
 Instagram
 Youtube
 Terms
Terms Index Descriptions