After more than a decade in the wilderness, international value stocks have staged a notable comeback in recent investment history. The numbers tell a remarkable story: year-to-date through July 31, 2025, international value stocks (MSCI EAFE Value Index) delivered 18.98% returns while their US counterparts (S&P 500 Pure Value Index) managed 5.48% — a 13.5 percentage point gap that would have seemed unlikely during the long years of US market dominance.
This isn't just a temporary blip. Since 2020, international value has quietly outpaced US value in cumulative terms, despite the latter's strong showing in 2020-2021. The pendulum has shifted, with international value leading on 1-year, 3-year, and 5-year horizons as of mid-2025.
From Tears to Triumph
Recent research from Verdad Capital captures the emotional journey perfectly, describing international value investors as having "sowed in tears" through the valley of underperformance since 2010, only to finally "reap with cries of joy" as the harvest arrives*. Since July 2020, value has outperformed growth by 11.6% annualized in developed international markets — a vindication of decades of academic research.
The reversal follows a familiar pattern of cyclical leadership between US and international markets. Historical data shows these cycles have historically lasted for several years, suggesting the current shift could continue, though there is no guarantee.
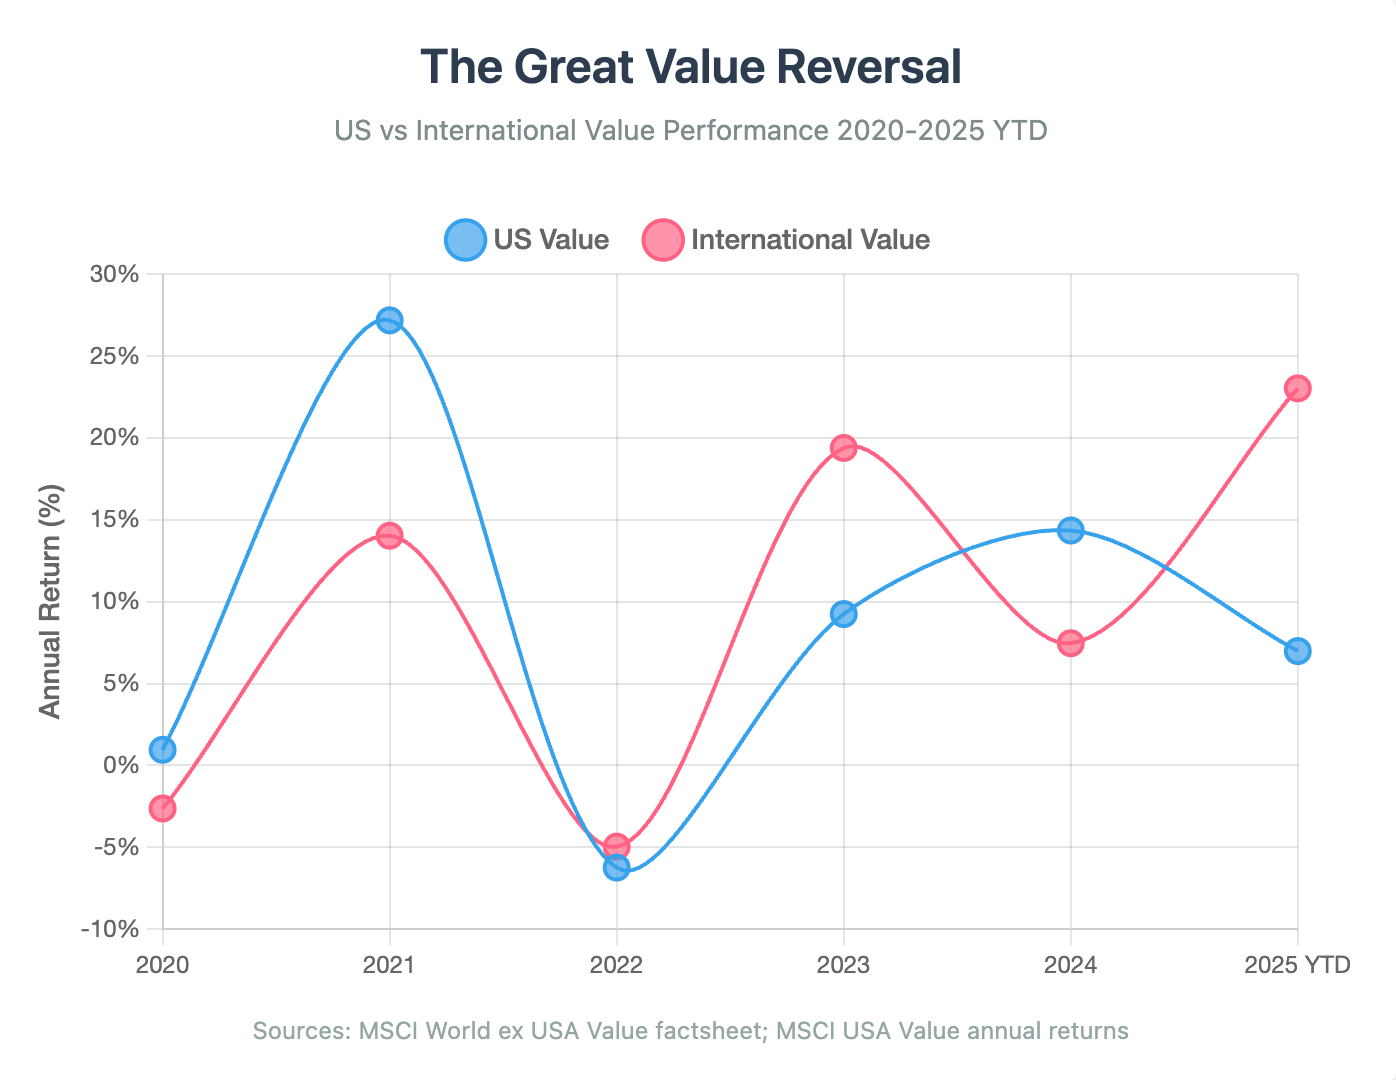
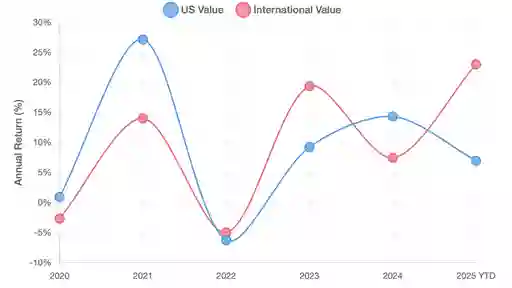
The chart below illustrates this dramatic turnaround, showing how international value went from trailing US value in 2020-2021 to delivering superior performance in 2022, 2023, and especially 2025 year-to-date.
Three Structural Tailwinds
The resurgence isn't accidental. Three powerful structural forces have aligned to drive international value's outperformance:
Currency Effects
The weakening US dollar since late 2022 has provided a consistent tailwind for international returns when measured in dollar terms. Currency moves of this magnitude have historically persisted for notable periods, giving international stocks a structural advantage.
Sector Composition Advantage
International value indices carry heavy weightings in financials (~39%) and energy (~9%) — sectors that thrived as central banks raised rates and commodity prices surged following Russia's invasion of Ukraine. US value, by contrast, carries greater exposure to technology and communication services, which faced headwinds during the rate-hiking cycle.
European banks like HSBC, Banco Santander, and BNP Paribas benefited directly from steeper yield curves, while energy giants Shell and TotalEnergies capitalized on elevated oil prices. This sector tilt gave international value portfolios natural exposure to the macro themes driving markets.
The Valuation Gap Opportunity
Perhaps most compelling is the "double discount" that international value stocks currently trade at. As of July 2025, international value stocks trade at 12-13x forward earnings compared to ~20x for US value stocks. Simultaneously, international markets trade at their widest discount to US markets since 1976.
Verdad's analysis shows valuation spreads within international markets have reached levels last seen during the dot-com bubble, when value versus growth spreads widened to extreme levels before mean-reverting dramatically.
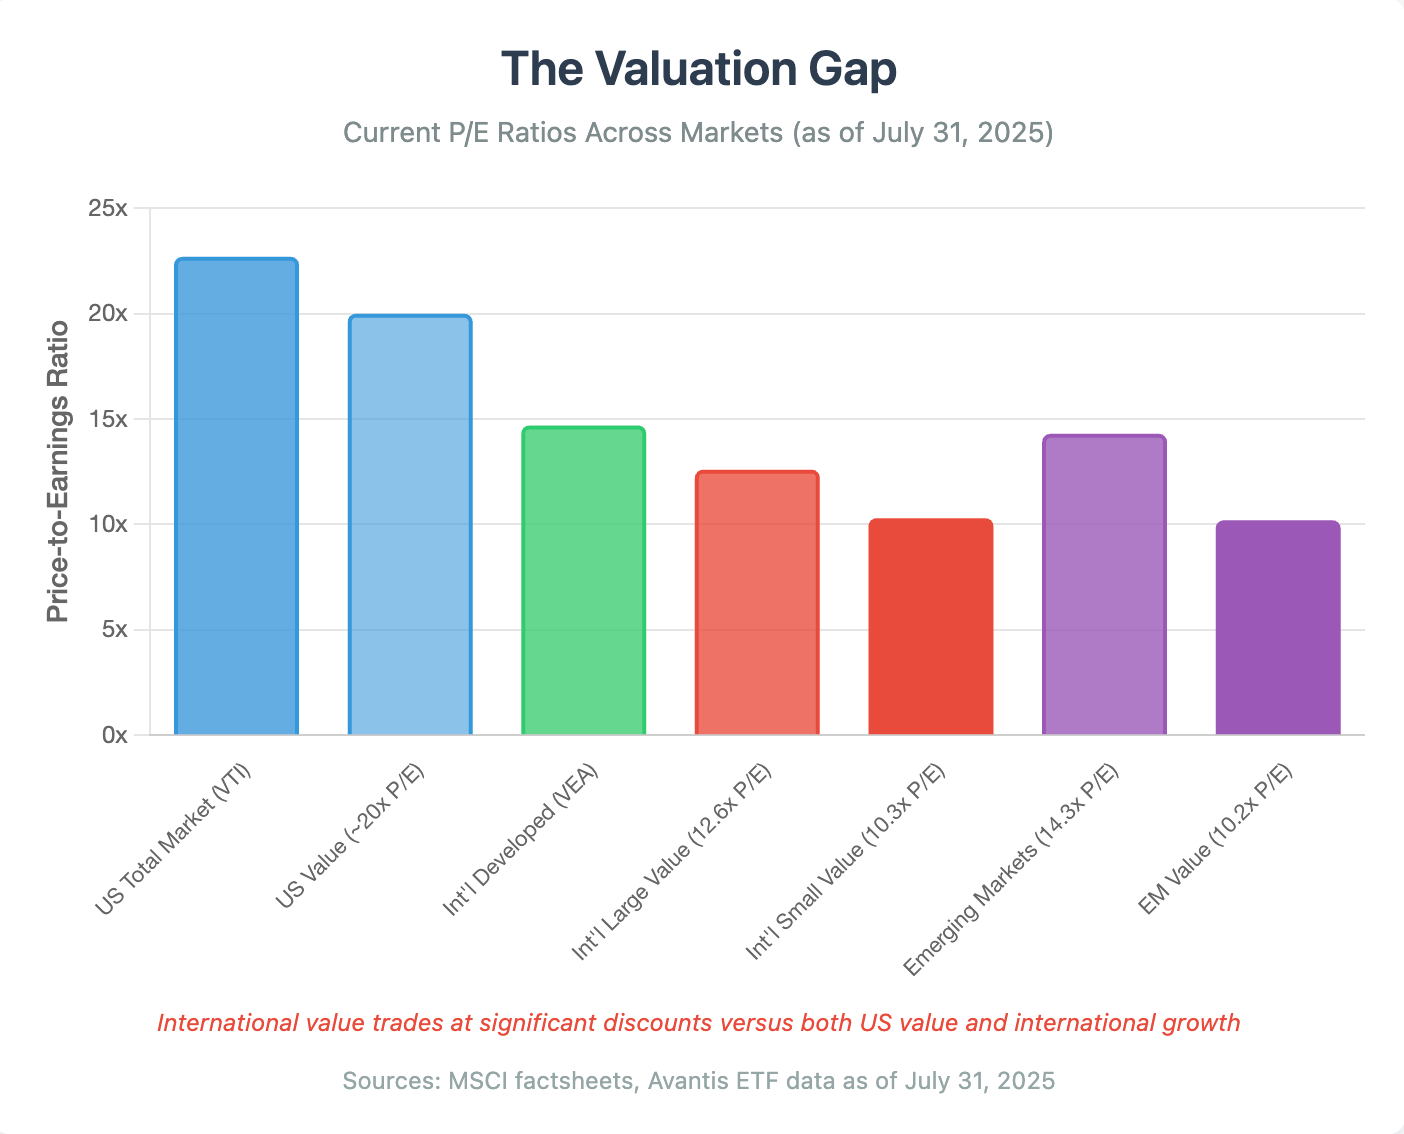
The current valuation gap is clearly visible in the chart below, which shows how international value stocks trade at significant discounts to both US markets and broader international indices.
Academic Vindication
The recent outperformance is consistent with decades of academic research. A comprehensive review of seven landmark studies spanning from 1926 to 2024 reveals consistent findings: value premiums exist across all major developed markets, with Japan showing particularly strong and persistent outperformance.
Research by Asness, Moskowitz, and Pedersen (2013) found "significant return premiums for value in every stock market," with the strongest performance in Japan. Fama and French (2012) documented value premiums across North America, Europe, Japan, and Asia-Pacific regions in their seminal work Size, value, and momentum in international stock returns. That paper showed global HML (High minus Low book-to-market) returns of 0.45% per month with t-statistics of 2.85, demonstrating statistical significance across international markets.
More recent work by Hou, Karolyi, and Kho (2011) confirmed value's effectiveness across 40 countries, finding significant value premiums in approximately 70% of markets at the 5% level.
Crucially, McLean and Pontiff's (2016) research on factor decay found that value-related predictors remain more robust after publication than most other market anomalies, suggesting the premium has structural underpinnings rather than being a temporary statistical artifact.
Lower Prices, Higher Expected Returns
Interviewed about the value premium by IFA's Murray Coleman in August 2024, Marlena Lee, head of the global investment solutions group at Dimensional Fund Advisors, said this: "All other things being equal, the lower the price paid for a security — measured by market capitalization or relative price — the higher the expected return.
There are numerous academic studies documenting the existence of those premiums covering over 40 countries and nine decades of stock data."
There is, in other words, a very supported academic case for investors considering exposure to value stocks.
As Mark Hebner notes in Step 9 of his award-winning book Index Funds: The 12-Step Recovery Program for Active Investors, "By overweighting value stocks in a portfolio, investors may capture the value premium, which has historically rewarded patient, long-term investors with higher returns than the market as a whole.
"The value premium is not guaranteed, but over decades of data, value stocks have delivered higher average returns than growth stocks, compensating investors for bearing the additional risk inherent in companies that are often out of favor."
Regional Dynamics
The resurgence in international value spans multiple regions, each with distinct drivers:
Japan leads the charge, benefiting from corporate governance reforms and record shareholder distributions. Japanese firms announced unprecedented shareholder payouts in the first half of 2025, building on three consecutive record years. Rising interest rates have particularly benefited Japanese financial stocks like Mitsubishi UFJ and Sumitomo Mitsui Financial.
Europe has seen improving investor confidence as measured by the Sentix Economic Index, which tracks sentiment among over 1,000 investors. The index improved from deeply pessimistic readings of -18 at the start of 2025 to neutral territory by mid-year, as eurozone inflation returned to the ECB's 2% target and Germany approved a €1 trillion infrastructure package.
Emerging markets present a fascinating case study. Chinese internet giants like Alibaba — once among the world's largest growth stocks — now appear in value indices after government intervention decimated their valuations. This rotation from former growth darlings into value territory helps explain emerging markets' strong value performance.
The Persistence Factor
Recent analysis of rolling periods since 1926 by Dimensional Fund Advisors** shows that value beats growth 59% of the time over one-year periods, rising to 77% over ten years for international markets.
Such variability is inherent to risk-based premiums. Even the S&P 500 has lagged Treasury bills for stretches of more than 13 years, including 1929–43, 1966–82, and 2000–12 — yet each time, strong recoveries followed.
Value strategies follow the same pattern: temporary underperformance is part of the cycle, not a sign the approach is flawed.
Portfolio Implications
Current valuations indicate the opportunity remains attractive. Avantis's international value ETFs trade at P/E ratios of 12.6x for large caps and 10.3x for small caps, compared with 14.7x for broad international markets and 22.7x for the US total market.
Historical data from 1979–2019 shows a clear link between valuation spreads and subsequent value premiums. When spreads are above their historical medians, as they are now, future value outperformance has tended to be well above average.
For investors, the most effective approach is to maintain steady exposure to international value rather than trying to time style shifts. The recent gains also reinforce the case for geographic diversification within factor strategies.
Looking Ahead
The great value reversal abroad should provide comfort to value investors everywhere.
Far from being "broken," global market patterns suggest value's revival abroad is part of a cycle, not a structural shift. If the strategy had truly failed, we would see it everywhere. Yet European and Japanese companies, many with deep ties to US markets, are leading the charge.
Rising correlations, compelling valuations, and favourable macro winds all point in the same direction: this run may have further to go.
After more than a decade in the wilderness, international value is in harvest season, and disciplined investors could be set to reap the rewards.
ROBIN POWELL is the Creative Director at Index Fund Advisors (IFA). He is also a financial journalist and the Editor of The Evidence-Based Investor. This article reflects IFA's investment philosophy and is intended for informational purposes only.
Footnotes:
*: Brian Chingono, Resurgent International Value, Verdad Weekly Research
**: https://www.ifa.com/charts/190h
"Any references to specific companies (e.g., HSBC, Banco Santander, BNP Paribas, etc.) are provided strictly as illustrative examples of broader market or sector trends. They should not be construed as recommendations, endorsements, or advice to buy or sell any particular security."
Disclosure:
"This article is intended for informational and educational purposes only and reflects the perspective of Index Fund Advisors (IFA), with which the author is affiliated. It should not be interpreted as an offer, solicitation, recommendation, or endorsement of any specific security, product, or service. All information provided is based on sources believed to be reliable and accurate at the time of publication; however, no assurance can be given that this information is complete or up-to-date. Readers are encouraged to consult with a qualified investment advisor for personalized guidance tailored to their individual financial circumstances.
Investing involves risks, including the potential loss of principal. There are no guarantees that any investment strategy will achieve its objectives, and past performance is not indicative of future results. Any references to historical data or academic studies, while accurately reported, are not exhaustive and may vary depending on methodology, time frame, or market conditions. Investors should consider consulting additional recent studies and conducting their own due diligence before making financial decisions.
This article may include references to third-party insights, research, and data. While these have been carefully cited, IFA does not assume liability for errors or omissions in third-party materials. Furthermore, market conditions and investment assumptions discussed in this article are not guarantees of future outcomes and should not be interpreted as forecasts.
For additional information about Index Fund Advisors, Inc., you are encouraged to review IFA's Form ADV Part 2A brochure, available at https://www.adviserinfo.sec.gov/ or www.ifa.com. This document provides detailed information about our services, fees, and potential conflicts of interest.


 X
X