
 Risk Capacity
 Wealth Management
 Outsourced CIO
 Retirement Plans
 Institutional
 Financial
  Open an Account
 IFA App

 Articles
 Charts
 Investor Education ▾
 Fund
Fund
 Store
Store

 Taxes
Taxes Back-testing Disclosures
 Glossary
 Form CRS
The first half of 2026 demonstrated how quickly markets can recover from uncertainty. After a spring decline driven by geopolitical concerns—including conflict involving Iran—global equity markets rebounded strongly and approached record highs by midyear. The S&P 500 gained roughly 10% and the Nasdaq rose 14% through June 19, led by technology and AI-related companies. Developed international markets produced returns similar to the U.S., while emerging markets significantly outperformed both.
Despite rising oil prices and geopolitical tensions, global markets remained resilient. Historical evidence shows stock market performance is not closely tied to oil prices alone. Likewise, gold did not serve as a reliable hedge during this period. Since the onset of the Iran conflict, gold prices fell while U.S. equities gained, reinforcing the importance of understanding the role each asset plays within a diversified portfolio. Historically, equities have provided higher long-term returns than many lower-risk asset classes, while gold's long-term return expectations are less clear.
Inflation remained a concern during the first half of the year. Under new Federal Reserve Chairman Kevin Warsh, the Fed kept short-term interest rates unchanged as inflation moved higher. As a result, expectations for future rate cuts diminished, and bond yields rose. The 10-year U.S. Treasury yield approached 4.5%, causing Treasury prices to decline modestly. Broader bond market returns were essentially flat.
A notable shift occurred within equity markets. Small-cap and value stocks outperformed larger growth-oriented companies, reversing trends seen in recent years. Emerging markets also led developed markets. These leadership changes underscore a key lesson for investors: it is extremely difficult to predict which regions, sectors, or investment styles will outperform next. Even over the past five years, some of the strongest-performing asset classes may surprise investors.
The first half of 2026 reinforces the benefits of broad diversification and long-term discipline. Rather than attempting to forecast market winners or reacting to headlines, investors are generally better served by maintaining exposure across global markets. Because leadership frequently shifts among regions, sectors, and company types, a diversified portfolio helps investors participate wherever future opportunities emerge.
(We highly suggest you watch Mark Hebner's breakdown of the quarter two market review. As always if you have any questions related to some of the new allocations please reach out to your wealth advisor.)
Domestic Equities
All nine of IFA's domestic equity indexes posted double digit returns for the quarter. Small Growth(SG) and Large Company(LC) had the best performance in the first quarter with a 18.66%(SG) and a 15.88%(LC) return. Coming in with the third highest return for the quarter was U.S. Small Company(SC) with a 15.20% return followed by U.S. Core Equity 2(UCE) with a return of 13.97%. The U.S. Large Company High Profitability Index came in with a return of 13.31%. Rounding out the bottom four were U.S. Mid Cap(MD) which finished the quarter up 11.34% and U.S. Small Cap Value(SV) which finished with an 11.22% return. The US Large Growth(LG) finished up 10.76% and U.S. Large Value(LV) finished up 10.59%.
International Equities
All International Indexes finished the quarter in positive territory. The IFA International Large Company High Profitability(IHP) Index posted a positive return of 8.75% while the IFA International Core Equity(ICE) Index returned 7.64% for the quarter followed by the IFA International Small Company(IS) Index returning 7.03%. To round out the bottom two the IFA International Value(IV) Index returned 5.23% and the IFA International Small Cap Value(ISV) Index which returned 5.04% for the quarter.
Emerging Markets Equities
Stocks issued by companies based in developing countries had positive results for the quarter with all of IFA's Emerging Market Indexes posting positive returns. The IFA Emerging Market High Profitability Index led the way coming in with a 28.05% return followed by the IFA Emerging Markets Index returning 21.62%. The IFA Emerging Markets Value Index came in third with a 20.29% return for the quarter. The IFA Emerging Markets Core 2 Index returned 20.04% and the IFA Emerging Markets Small Cap Index returned 10.38% rounding out the bottom two for the quarter.
Real Estate Equities
IFA's Global REIT Index ended the quarter up posting a positive return of 9.52%.
Fixed-Income
All eight of IFA's fixed-income benchmarks produced positive returns for the first quarter. The IFA Global Credit Index finished the quarter with a postive 2.16% return. The IFA Global Core Ex-US Fixed Income Index came in second with a 1.88% return for the quarter and the IFA Five-Year Global Fixed Income Index came in third finishing the quarter up 1.11%. The IFA Two-Year Global Fixed Income Index came in with a return of 0.85% while the IFA One-Year Fixed Income Index finished up 0.61%. Rounding out the bottom three were the IFA Core Fixed Income Index finishing with a 0.60% return followed by the IFA Short Duration Fixed Income Index finishing with a 0.51% return and the IFA Short Term Government Index finishing the quarter with a 0.07% return.
IFA Index Portfolios
The second quarter of 2026 proved how quickly markets can recover from one quarter to the next with all IFA portfolios finishing in positive territory. For the quarter, our all equity Portfolio 100 returned 12.57% while our portfolio 10 made up of 90% bonds and 10% equity posted a 2.21% return. Below is an overview of how several IFA Index Portfolios performed in Q2 as well as during the previous quarter. All of these returns are shown net of IFA's maximum annual 0.90% advisory fee through June 30, 2026.
Each quarter, we monitor our recommended funds for clients. As part of that process, we've developed a rating system. For a summary of those results, please feel free to check IFA's latest Performance Monitoring Report (PMR).
IFA encourages both novice and experienced investors to discuss their financial situation and investment goals with an IFA wealth advisor, tailoring strategies to their personal risk capacity and long-term objectives. Besides offering an online Risk Capacity Survey, we provide to each client a complimentary and holistic financial plan.
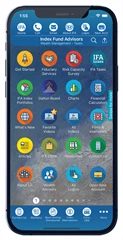
The wealth of IFA's educational materials are available for Apple iOS and Android devices via the IFA App. This free App is available to download from both the Apple App Store and the Google Play Store for Android.
Prior performance is not indicative of future results. Investors should review complete performance data over time before making investment decisions.
Footnotes
- Dimensional, Midyear Review: From Spring Slump to Summer Surge, June, 2026
Disclosure:
Performance results for actual clients investing in accordance with the IFA Index Portfolio Models may differ from backtested data due to factors such as fund implementation, market conditions, cash flows, mutual fund allocations, index changes, rebalancing, deviation from advice, retained securities, tax strategies, fees, and timing of fee deductions.
Diversification is a prudent investment approach, but it does not assure a profit or protect against loss in declining markets, nor does it eliminate all investment risks. Performance data presented is for illustrative purposes, and readers are encouraged to consider longer-term performance horizons, such as one-year, five-year, and ten-year periods, when making investment decisions. Comprehensive performance data, including net-of-fee results for these periods and additional disclosures, is available upon request.
This information is not an offer, solicitation, or recommendation for any security, product, or service. No investment strategy guarantees success, and all investing carries risks, including the potential loss of principal. Performance results may include both live and hypothetical data, which do not represent actual client portfolios and should not be interpreted as indicative of future results.
Hypothetical performance relies on assumptions, including fixed market conditions, periodic rebalancing, and historical data, and does not account for real-world factors such as transaction costs, tax implications, behavioral tendencies, or cash flows, which can affect results. References to diversification, portfolio construction, or market trends are intended for educational purposes and should not be considered prescriptive or guaranteed strategies for success.
The data provided is based on information believed to be accurate as of the date of publication but may change as market conditions evolve. Investors are encouraged to consult with a qualified advisor to assess personal financial goals and risk capacity. Additional information is available by reviewing IFA's ADV Brochure at https://www.adviserinfo.sec.gov/ or visiting www.ifa.com."











 Home
Home 888-643-3133
 Contact Us
 Newsletter Subscribe
 eMoney
 IFA Apps
 Index Funds Book on Kindle
 Index Funds Audiobook
 Careers
 Facebook
 X
X LinkedIn
 Instagram
 Youtube
 Terms
Terms Index Descriptions