Pioneers of Probability: Francis Galton

Disclosure:
This video is for informational and educational purposes only and is not intended as investment advice or a recommendation of any particular investment strategy. The Galton Board is a simplified illustration of probability concepts and should not be understood as a model of actual securities-market returns. Market returns are influenced by numerous factors, are not perfectly random or normally distributed, and may exhibit characteristics including volatility clustering, skewness, and fat tails. Historical examples and statistical concepts discussed herein do not guarantee future investment results. Opinions and interpretations expressed are subject to change.
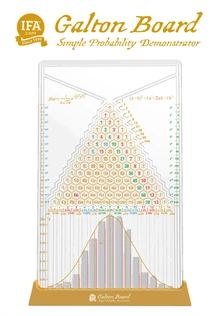
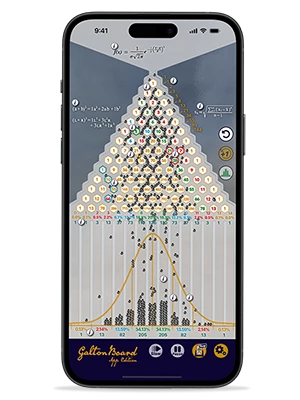
Take a handful of beads and drop them, one at a time, through a lattice of pegs arranged in a honeycomb pattern. Each bead hits the first hexagon and bounces left or right with equal probability. Then it hits the next hexagon. Left or right again. And the next. And the next — through row after row of hexagons, each collision a separate random event, until the bead finally falls into one of the bins at the bottom. Where will it land? Any single bead is unpredictable. Random. Chaotic. You cannot know, watching it bounce, where it will end up. But drop a thousand beads. Watch the bins fill. And something remarkable happens — something that should, by now in this series, feel almost inevitable. Order emerges. The bins in the middle fill fastest. The bins at the edges fill slowly. The accumulated beads form a smooth, symmetric shape — rising to a peak at the center, falling away on both sides, tailing off toward the edges. A bell curve. Built from pure randomness, one collision at a time. This is the Galton Board. And the man who built it — Sir Francis Galton — used it to make visible something that probability theorists had been proving mathematically for 150 years. Welcome to Pioneers of Probability with me, Mark Hebner.
Francis Galton was born in 1822 in Birmingham, England, the younger cousin of Charles Darwin. He was a polymath of the Victorian era — explorer, meteorologist, statistician, and inventor. He pioneered the use of fingerprints for identification. He invented the concept of correlation. He was the first person to draw a weather map. And he built the device thatis widely used to demonstrate probability concepts. His statistical work began where Quetelet left off. Quetelet, who we met in episode 16, had shown that human characteristics followed normal distributions in large populations. Galton pushed further asking "What mechanism produces the bell curve in human populations, generation after generation?" The answer was regression to the mean — the systematic tendency for extreme values to moderate over time, the population always pulling back toward the center. That discovery was the seed of modern regression analysis and the concept of correlation, which underpins virtually every quantitative relationship studied in social science and finance.
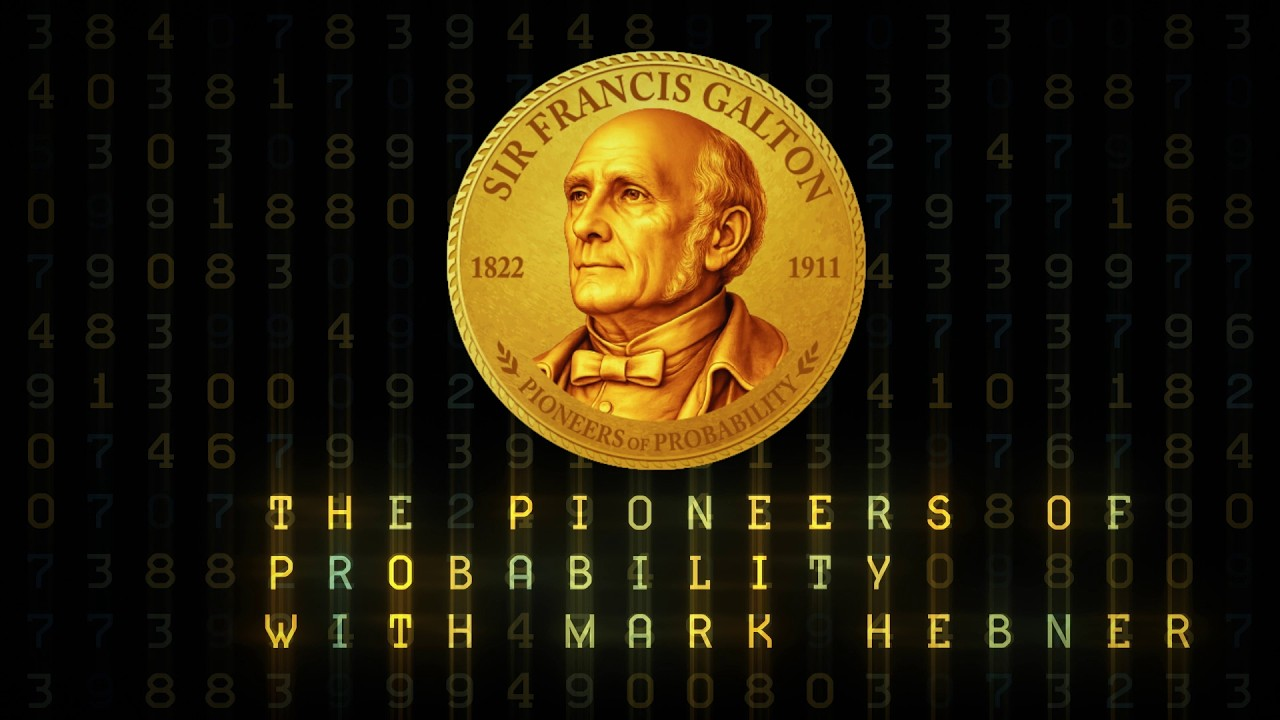
The Galton Board is a demonstration of this mathematical principlemade physical. Each bead falling through the hexagons is performing a random walk — a coin flip at every hexagon: heads, the bead goes left; tails, it goes right. This is the Bernoulli trial, the binomial distribution, and de Moivre's normal approximation — all made visible in a single device. The honeycomb pattern is not arbitrary. It is a physical embodiment of Pascal's Triangle. The number of ways a bead can reach any given hexagon corresponds exactly to the numbers in Pascal's Triangle — the same triangle Blaise Pascal used to solve the Problem of Points four centuries ago. The Galton Board is Pascal's Triangle made three-dimensional, set in motion, and filled with beads. It was this deep similarity between coin flipping and the binomial distribution that inspired IFA's MarketCoins® — commemorating the pioneers whoshowed howthe mathematics of a coin flip scales, through the hexagons of the Galton Board, intoa bell curve, providing a simplified illustration relevant to understanding distributions of market returns.
Galton's statistical contributions were transformative and lasting. Regression to the mean. Correlation. The systematic application of statistics to human populations. These tools are now so fundamental to empirical science that most researchers use them daily without knowing their origin. Galton also coined the word eugenics — a discredited ideology aimed at improving the humans — a permanent reminder that descriptive tools are not always prescriptive ones. The Galton Board itself carries no such taint. It is a demonstration ofa mathematical principle— order emerging from chaos, randomness resolving into pattern. That part of Galton's legacy is purely and permanently beautiful.
IFA's Galton Board incorporates patented design features, and, along with the MarketCoins, is used as the firm's investor education arsenal. The direction of market movements can be illustrated using concepts fromthe Galton Board —with short-term direction difficult to predict, as the Markov chain analysis of our final pioneer will show. But the magnitude of those movements reflects more complex dynamics — fat tails, clustering, and skew that the simple bell curve does not fully capture. The Galton Board illuminates one essential truth: that direction is difficult to predict, and that randomness plus aggregation plus timecan produce observable distributions that investors can use to better understand market behavior. It is often used as a visual illustration in discussions of passive investing — showing how aggregation and low-cost exposure to broad market distributions are commonly emphasized by index investors.
In 1907, Galton published Vox Populi — Voice of the People — showing that the crowd's average estimate of an ox's weight at a country fair was 1,197 pounds, just one pound off from the actual 1,200. The aggregate of hundreds of independent, imperfect estimates converged on the truth with a precision no individual achieved — a pattern some point to as an analogy for index investing, whichrelies on market prices reflecting the aggregate actions and information of market participants rather than attempting to consistently identify mispriced securities. Sir Francis Galton built the first quincunx in 1873 to demonstrate a mathematical truth he had discovered by studying the heights of peas and the statures of men. IFA built their first one in 2008 — with pegs arranged in a honeycomb pattern that make each binary decision visible — to demonstrate the same truth to every investor willing to watch. The beads fall. The hexagons deflect. Each bounce a coin flip. Each Bernoulli Trial - a step toward the bell curve that eighteen pioneers across eight centuries helped us understand. Randomness becomes pattern. Chaos becomes order. One hundred and thirty years apart. The same lesson. We are seventeen steps into an 800-year story. Only one more to go.