
 Risk Capacity
 Wealth Management
 Outsourced CIO
 Retirement Plans
 Institutional
 Financial
  Open an Account
 IFA App

 Articles
 Charts
 Investor Education ▾
 Fund
Fund
 Store
Store

 Taxes
Taxes Back-testing Disclosures
 Glossary
 Form CRS
Pioneers of Probability: Adolphe Quetelet

Disclosure:
This video is for informational and educational purposes only and does not constitute a solicitation or recommendation to buy or sell any security. The historical and mathematical concepts discussed are intended to illustrate the development of probability theory and its relevance to investing. Past performance is not indicative of future results. All investing involves risk, including the possible loss of principal. This video contains AI-generated content. Index Fund Advisors, Inc. is a registered investment adviser. For additional information, please visit adviserinfo.sec.gov or www.ifa.com.
In 1846, a dataset appeared in the Edinburgh Medical and Surgical Journal that would change the history of statistics. As a matter of course, a Scottish army surgeon had measured the chest circumferences of 5,738 soldiers, ranging from 33 to 48 inches. Arranged by frequency, they formed a shape you'll recognize by now: a bell curve — smooth, symmetric, centered on the average, tailing off in both directions.
But here is what made this dataset different.
The chest circumferences were not measurement errors — not approximations to some true value all the soldiers shared. Each measurement was real, exact, and different. The variation was not noise. The variation was the phenomenon itself. For Gauss whom we met in episode 14, the normal distribution described how imperfect instruments scatter around a true value.
Here, there was no single true value — there were 5,738 true values, each soldier's actual chest, approximately distributed across a range, following the bell curve with striking regularity.
The man who understood what that meant for the study of human beings and society was a Belgian astronomer named Adolphe Quetelet.
Welcome to Pioneers of Probability with me, Mark Hebner.
Adolphe Quetelet was born in 1796 in Ghent, received his doctorate in mathematics, and spent his career as an astronomer and statistician in Brussels. He founded the Royal Observatory of Belgium, organized the first international statistical congress, and corresponded with nearly every major scientist in Europe — a synthesizer who saw connections across fields specialists had kept separate.
Gauss had used the normal distribution to describe the scatter of measurement errors around a true value — the planet's position, the star's brightness — where the scatter was the imperfection of instrument and observer. Quetelet asked:
"What if the same mathematical form describes something real, not errors around a true value, but the genuine variation within a population?
He had been collecting data on human characteristics for years — heights, weights, birth rates, death rates, crime rates. Across large populations, these clustered around averages and tailed off in both directions, in many cases looking unmistakably like normal distributions.
Quetelet concluded that nature operated as if it were a giant astronomical instrument —
"It produceds human beings the way a telescope produces observations, with a true value at the center and random variation around it."
He called that value L'Homme Moyen — the Average Man — and proposed it was not just a statistical abstraction but a meaningful ideal: the central tendency of the human species, around which real individuals varied like errors around a true measurement.
Where Laplace, whom we met in episode 12, had imagined a demon who knew the position of every atom in the universe, Quetelet offered something more practical — a framework for understanding the aggregate behavior of millions of people without knowing the secrets of any single heart.
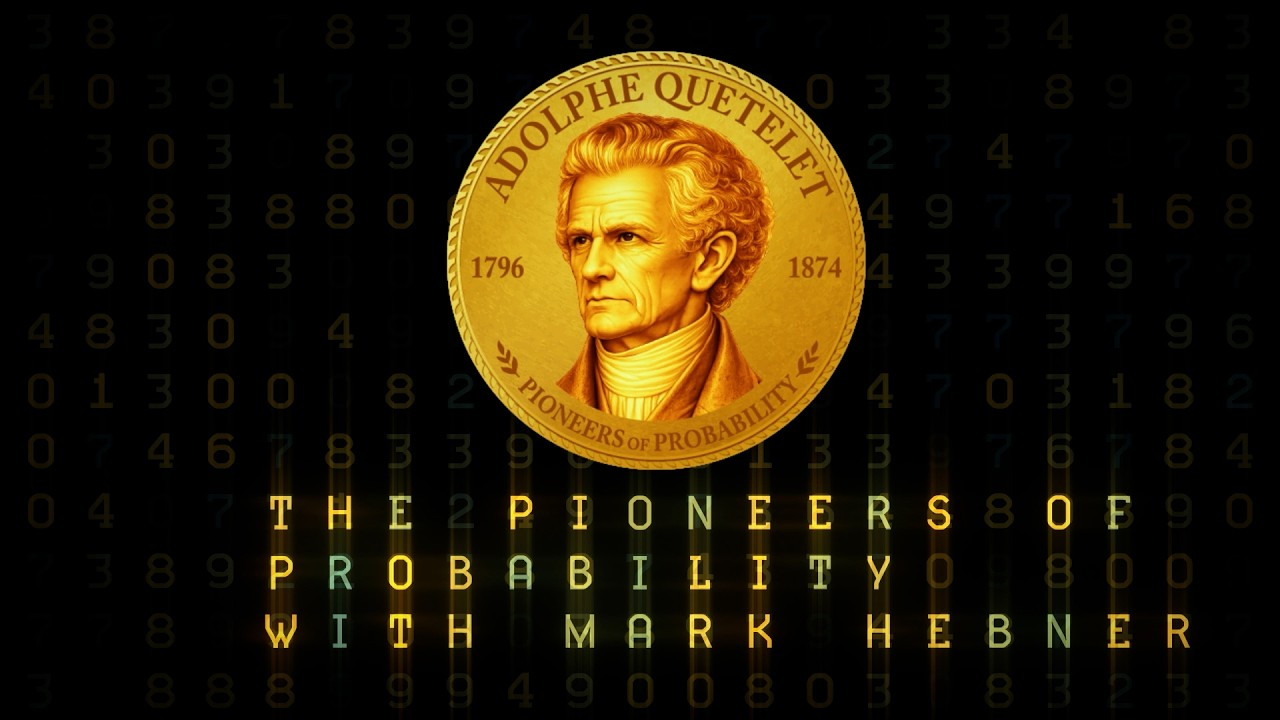
The dataset on our coin is the demonstration: 5,738 Scottish soldiers, chest circumferences measured in inches.
Plotted by frequency, the distribution fit the normal curve closely — the same mathematical form Gauss had derived for astronomical measurement errors described, with similar accuracy, the physical variation of human bodies.
Quetelet extended the observation systematically, showing the same pattern in the heights of French conscripts, the birth rates of Belgian provinces, the seasonal distribution of crimes, and mortality rates across age groups.
Wherever large populations were measured, the normal distribution often appeared.
He went further, speculating that moral and social qualities — intelligence, criminal propensity, courage — were also distributed normally around average values. This was a far more speculative, and more consequential, claim. He also invented a practical tool for measuring deviation from the average: the index dividing weight in kilograms by height in meters squared. You know it today as the Body Mass Index — Quetelet called it the Quetelet Index, a single number summarizing how far an individual's body deviated from the statistical norm.
Quetelet's work had consequences extending far beyond statistics — and not all of them were benign. On the productive side, he essentially created social statistics, demonstrating that human populations, like physical phenomena, could be studied scientifically — that patterns in births, deaths, crimes, and diseases were structured, measurable, and could inform policy. Every modern epidemiological study and public health intervention builds on ideas tracing back to his framework.
He also gave Francis Galton — who appears next episode — the dataset and concept that would lead to the discovery of regression to the mean.
On the problematic side, Quetelet's tendency to treat the average as an ideal — and deviation from it as a defect — proved dangerous in the hands of later thinkers. The eugenic movements of the late nineteenth and early twentieth centuries drew directly on his statistical frameworks, using the normal distribution to classify and rank human beings in ways that caused immense suffering.
This is not Quetelet's fault in any simple sense — he did not advocate eugenics. But the infrastructure he built was weaponized by others in ways he could not have fully foreseen. Statistical tools are often treated as neutral, but their application never is. Quetelet's story is a reminder that powerful analytical frameworks can be used for very different ends depending on who holds them.
For investors, Quetelet's contribution is indirect but a conceptual foundation for thinking about distributions of financial outcomes across large populations of assets, managers, and strategies.
The average market return can be thought of as the L'Homme Moyen of the investment universe: the central value around which individual stock returns scatter, some above and some below, following a distribution that ismay approximate a normal distribution in some contexts.
This has direct implications for active management.
If individual stock returns are approximately distributed around the market average, active managers picking stocks are sampling from that distribution — some landing above, some below.
Over short periods, luck can play a substantial role. Over long periods, the distributionmay tend to reassert itself: most active managers cluster around the average, minus their costs. That's the statistical case for indexing in Quetelet's language.
Costs represent a persistent negative influence relative to the market return.
Active investors, in the aggregate, earn the market return before costs—Because active investors collectively hold the market portfolio.
After costs, active managers, in the aggregate, have historically tended to underperform comparable indexes
One strategy is to seek to capture that center — the market return — efficiently and cheaply, rather than hoping to be one of the outliers above it while risking being one of the outliers below.
We are sixteen steps into an 800-year story. Just two more to go.
Please provide and retain current substantiation for this historical comparative-performance claim, including the applicable time period, active-manager universe, methodology, and comparable benchmark(s). The existing general disclosure does not substantiate the claim.
Sources:
Quetelet, A. (1842). A treatise on man and the development of his faculties (R. Knox, Trans.).
William and Robert Chambers. (Original work published 1835 as Sur l'homme et le développement de ses facultés)
Stigler, S. M. (1986). The history of statistics: The measurement of uncertainty before 1900. Harvard University Press.
















 Home
Home 888-643-3133
 Contact Us
 Newsletter Subscribe
 eMoney
 IFA Apps
 Index Funds Book on Kindle
 Index Funds Audiobook
 Careers
 Facebook
 X
X LinkedIn
 Instagram
 Youtube
 Terms
Terms Index Descriptions