New research from Boston College finds that the shift into private equity, real estate, and hedge funds is better explained by what plan managers came to believe than by the explanations the industry usually offers. Similar beliefs may now be reaching 401(k) plans.
At the turn of the century, when a public pension fund took investment risk, it did so mostly by owning publicly traded stocks. Alternatives (private equity, private real estate, hedge funds) accounted for just 14% of the risky side of the average plan's portfolio.
By 2021, that figure was 39%.
A new issue brief from the Center for Retirement Research at Boston College asks the obvious question: why? Written by Juliane Begenau (Stanford GSB), Pauline Liang (Georgia Tech), and Emil Siriwardane (Harvard Business School), and drawn from their forthcoming Review of Financial Studies paper "The Rise of Alternatives," the study tests the explanations the industry usually offers and rejects most of them.
The answer the authors land on should be familiar to anyone who has read the first few chapters of Index Funds: The 12-Step Recovery Program for Active Investors. The authors find that the shift is not explained by changes in risk appetite, funding pressure, or other mechanical factors. It is consistent with a change in plans' beliefs about what alternatives would earn, beliefs that were transmitted by consultants, amplified by peers, and anchored in one painful memory from the 1990s. The authors are careful to note that more work is needed to determine whether those beliefs were rational.
The authors find the move into alternatives is consistent with a shift in beliefs, not a shift in risk appetite.
What the Data Actually Show
Using the Public Plans Database, the authors document the shift in target allocations, which is the right way to isolate deliberate choices from market drift.
| Measure | 2001 | 2021 |
|---|---|---|
| Target allocation to alternatives | ~10% | ~30% |
| Total target allocation to risky assets | 69% | 76% |
| Alternatives as a share of risky assets | 14% | 39% |
| Spread, 10th to 90th percentile plan | 26 pts | 39 pts |
Note the second row. The overall appetite for risk barely budged. What changed dramatically was the composition of that risk. And note the last row: dispersion across plans rose by about half. Plans facing broadly similar liabilities and legal constraints arrived at widely different answers, which is itself a clue that something other than a single optimization was at work.
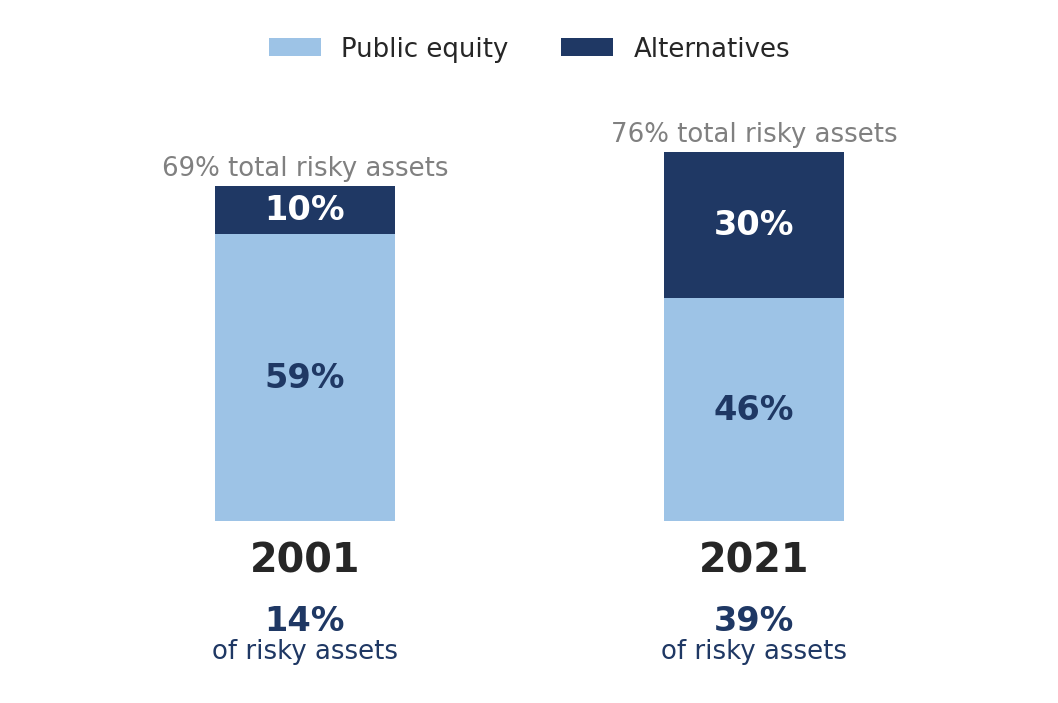 Figure 1. The composition of pension risk-taking, 2001 vs. 2021. Total risk-taking barely moved; its composition shifted toward alternatives.
Three Sources of a Belief
The authors identify three channels through which the belief in alternatives spread.
Consultants. Investment consultants advise plans on everything from asset allocation to manager selection, and the authors were able to measure what those consultants expected alternatives to earn in excess of public equities after adjusting for risk (the alpha). Since the early 2000s, consultants' expected alpha on alternatives rose by roughly 60 basis points. Almost all of that increase came from raising the expected return on alternatives, not from lowering expectations for stocks or revising risk assumptions. And the optimism passed through: plans whose consultants were more bullish held more alternatives, and widening disagreement among consultants accounts for about one-third of the growing dispersion across plans.
For context, consider how plan sponsors have fared when they acted on the decision to replace managers. Amit Goyal and Sunil Wahal (2008), writing in the Journal of Finance, examined nearly 8,800 hiring decisions by more than 3,400 plan sponsors from 1994 to 2003, along with 869 firing decisions by 482 institutions. Newly hired managers had excess returns that were statistically significant before they were hired and statistically indistinguishable from zero afterward. In the round-trip sample, the authors conclude that had sponsors simply kept the managers they fired, their excess returns would have been no different from those the replacements delivered. The study looks at sponsors' decisions and does not isolate the role of consultants, so it cannot tell us who was responsible. But it is a reason for caution about confident forecasts of excess return that come out of institutional decision processes, including the one that raised expected alpha on private markets by 60 basis points.
Keeping the fired manager would have produced about the same return. Switching has costs.
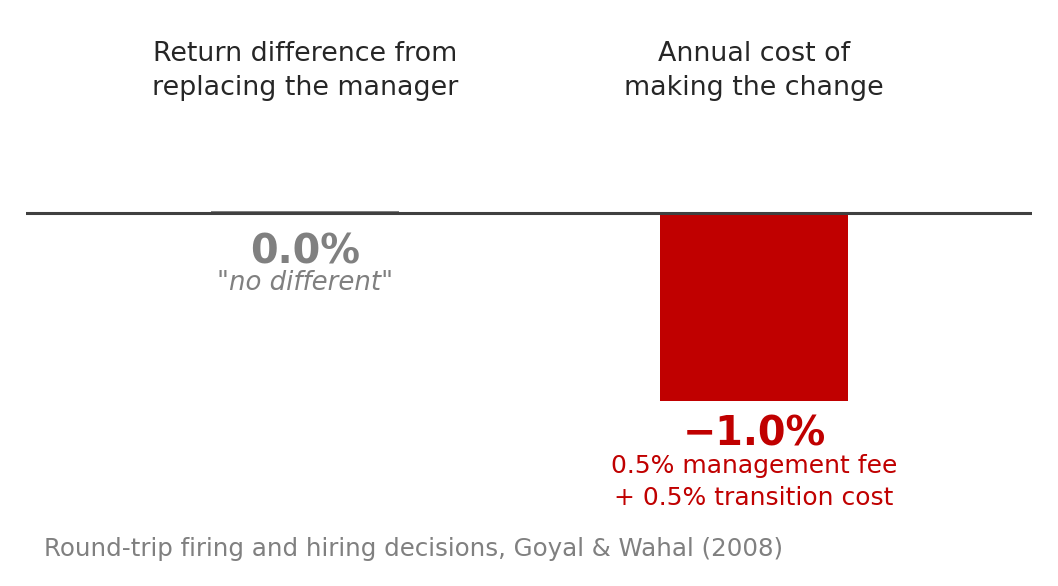 Figure 2. Hypothetical illustration prepared by IFA. Replacing an underperforming manager changed the return by about nothing in the Goyal and Wahal sample; under the assumed costs below, switching would cost about 1.0% in the first year. Assumed costs: 0.5% management fee and 0.5% transition cost. Not derived from the results of any investor or IFA client.
Peers. Defining peer networks geographically, the authors find that a 10-percentage-point increase in the alternatives share of a plan's neighbors is associated with a 7.2-percentage-point increase in its own. That is a very large coefficient. To their credit, the authors test whether this is genuine learning or defensive herding, and find peer effects remain strong even among plans with the least incentive to hide in the crowd (longer-tenured CIOs, better funding, better recent returns).
Memory of the 1990s. This is the most striking finding. Many public plans built their first meaningful equity exposure during the 1990s. Plans that arrived late to that boom, building positions between 1996 and 2002, absorbed more of the dot-com bust and less of the run-up. Those plans went on to shift substantially more into alternatives over the next two decades. Entry timing alone explains roughly one-fifth of the cross-state variation in the move to alternatives from 2002 to 2021.
In other words, a cohort of institutions had a bad first date with public equities, and the evidence suggests it shaped their portfolios for two decades. This is the 12-Step program's warning against extrapolating from recent or personal experience, playing out at the scale of state government.
The pattern is consistent with what Daniel Kahneman and Amos Tversky's "Prospect Theory" (1979) described. They established that people do not evaluate outcomes the way a utility-maximizing model assumes. Faced with probabilities, they take extraordinary measures to avoid or limit losses (loss aversion, or regret avoidance), and those measures can reduce their ability to capture gains. The Boston College authors do not themselves attribute the shift to loss aversion; we see the resemblance and think it is worth noting. If it applies, it would mean plans that felt the dot-com bust most acutely spent the next twenty years buying an asset class whose reported returns looked smoother.
Recognizing a bias does not immunize you against it. We believe the remedy is structural, not attitudinal.
Behavioral biases are not only a retail investor's problem. The pattern the authors document may reflect them at the scale of state investment committees.
The Explanations That Didn't Survive Testing
What makes this brief valuable is what it rules out. The standard narratives fail:
Reaching for yield because of underfunding. A battery of tests reveals almost no relationship between funding, in levels or in changes, and the use or adoption of alternatives, including under market-rate liability discounting.
Sticky return targets in a falling-rate world. If anything, the relationship runs backwards: changes in a plan's assumed return are negatively related to changes in its alternatives share.
Maturing membership creating pressure for returns. Little evidence.
Binding constraints on total risk. A one-standard-deviation tighter constraint is associated with only a 3-percentage-point shift, explaining just 4% of the cross-plan variation.
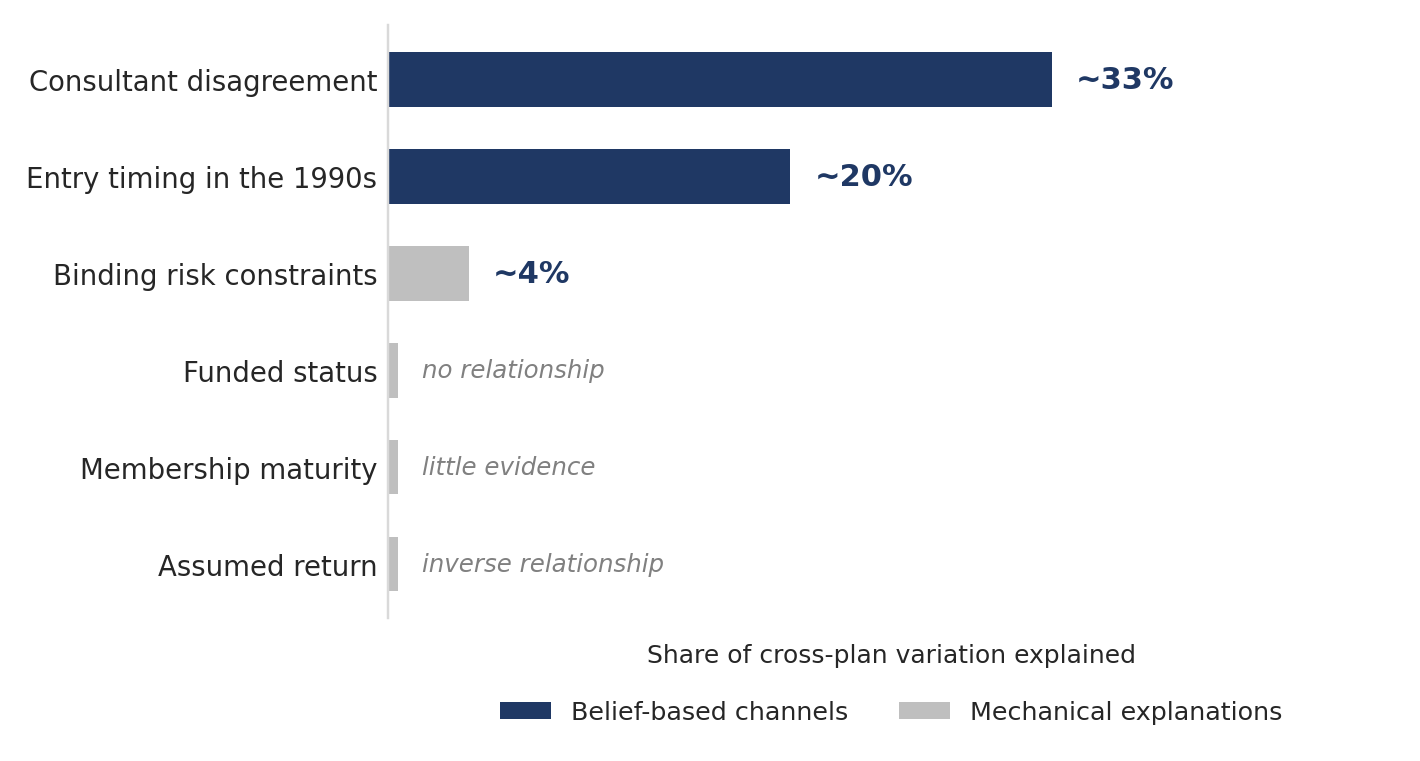 Figure 3. Competing explanations and how much of the variation each accounts for, as reported by the authors. Explanations with no measurable relationship are noted as such.
Then comes the modeling exercise. Because most large plans set targets using mean-variance optimization (the authors found that 85 of the 100 largest plans reference it in their public documents), the researchers built a mean-variance model calibrated to 2001 conditions and asked whether any decline in risk aversion could reproduce the observed shift.
In the authors' model, a decline in risk aversion could not reproduce the shift in more than 99% of scenarios. Holding beliefs fixed, a plan that wanted more risk in 2001 would have bought more public equity, since revealed preference tells us plans viewed stocks more favorably at the time. Within that model, the move into alternatives required a change in beliefs. The authors put the required shift at about 70 basis points of perceived alpha, of which only about 12% traces to consultants, with peer amplification accounting for roughly 20% of the remainder. The rest is a residual that the authors do not attribute to either channel.
Within the authors' model, no change in risk aversion could account for the shift. A change in beliefs was required.
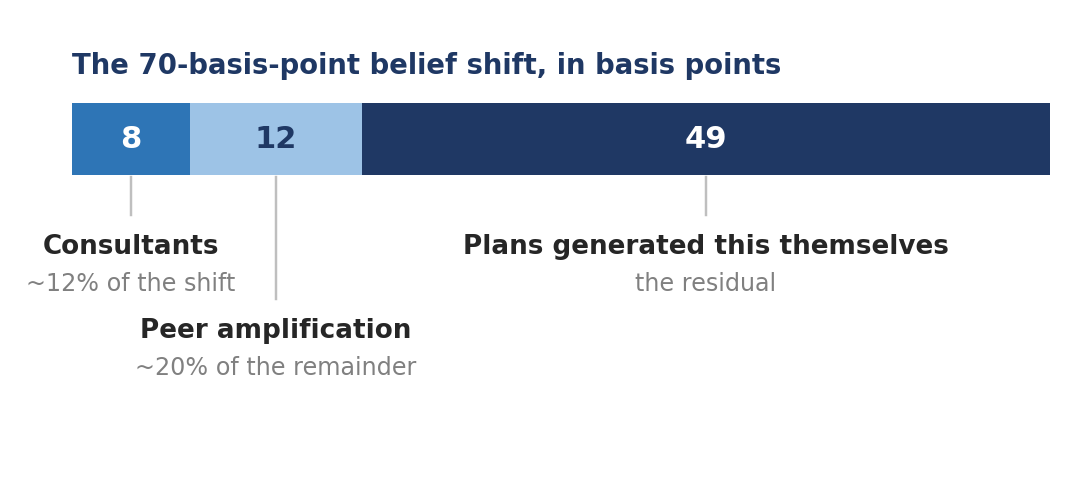 Figure 4. The 70-basis-point belief shift required to explain the move, and the portion attributed to each channel.
When Optimizers Meet Flattering Inputs
Here is where the IFA lens matters most.
Harry Markowitz's "Portfolio Selection" (1952), which won him a Nobel Prize, established the principle that a portfolio cannot be judged on expected return alone; risk has to be considered alongside it. Given assumptions about expected returns, variances, and correlations, one can construct the set of portfolios that maximize return for each level of risk: the efficient frontier. Markowitz wrote the foreword to the 10th edition of Index Funds, and served for years as an academic consultant to IFA. His past association with IFA does not imply that he reviewed or endorses this article. He was also, characteristically, insistent that investors weigh the findings of academics against the claims of Wall Street professionals rather than the reverse.
It is worth saying plainly what that framework is and is not. An optimizer is a machine for converting assumptions into allocations. Feed it a higher expected return and a lower volatility for an asset class, and it will hand you a portfolio stuffed with that asset class. It cannot tell you whether your inputs were real.
This is why IFA does not use an optimizer or an automatic algorithm to build its portfolios. Asset allocations produced that way can be very sensitive to their inputs: assumptions that are slightly off can produce allocations that are far off. IFA does not attempt to forecast future returns, risks, or correlations. The efficient frontier is easily identified in hindsight and unknowable in advance. IFA instead begins with the total market portfolio and incrementally adds asset classes that have historically raised expected return or reduced risk.
The efficient frontier is easily found in hindsight and unknowable in advance. That is why IFA does not use an optimizer, and why 85 of the 100 largest public plans reporting that they do may give a fiduciary pause.
The inputs for alternatives can be flattering for a reason that has nothing to do with economics: private assets aren't marked to market every day. Cliff Asness of AQR calls this "volatility laundering". The argument, in short, is that the underlying values move even when the reported prices do not. Private portfolio companies are often smaller and more leveraged than public companies, which would suggest higher, not lower, underlying volatility. Quarterly, model-based marks with a reporting lag can produce a return series that looks smoother than the underlying economics. Plug that smoothed volatility into an optimizer and alternatives can look like equity returns with bond-like risk.
Asness adds a second point. The original case for private markets was an illiquidity premium: you get paid extra for accepting a lockup nobody wants. But once investors decide the lockup is desirable, because it stops them from panic-selling and smooths their reported numbers, the logic may invert. You may no longer be paid for the feature; you may be paying for it.
What the Beneficiaries Actually Received
The CRR authors are appropriately careful, concluding that more work is needed to determine whether these beliefs about alpha were rational. But they note that plans with high alternatives shares do not clearly outperform those with low shares, and other published research is worth reading alongside their brief.
Begin with the precedent, because this is not the first time plan sponsors have been measured on their allocation decisions. Scott Stewart, John Neumann, Christopher Knittel, and Jeffrey Heisler (2009), writing in the Financial Analysts Journal under the title "Absence of Value," examined the asset allocation changes plan sponsors made, the decisions that necessitate the hiring and firing Goyal and Wahal studied. In only two of the eighteen years from 1985 to 2002 did plan sponsors' allocation decisions add value over the subsequent five years. The authors identified performance-chasing as the primary cause: sponsors were more likely to move money toward the asset class that had recently done well, and were duly disappointed. They put the economic cost of these decisions at $170.2 billion over the sample period.
Read alongside the Boston College brief, that study looks like a prologue. The mechanism is similar (allocation shifts driven by salient recent experience rather than by evidence), and the alternatives boom may be its largest instance to date, running on a longer memory and a less observable asset class.
In the Stewart et al. sample, plan sponsors' allocation decisions added value in two years out of eighteen. The authors estimated the cost at $170.2 billion.
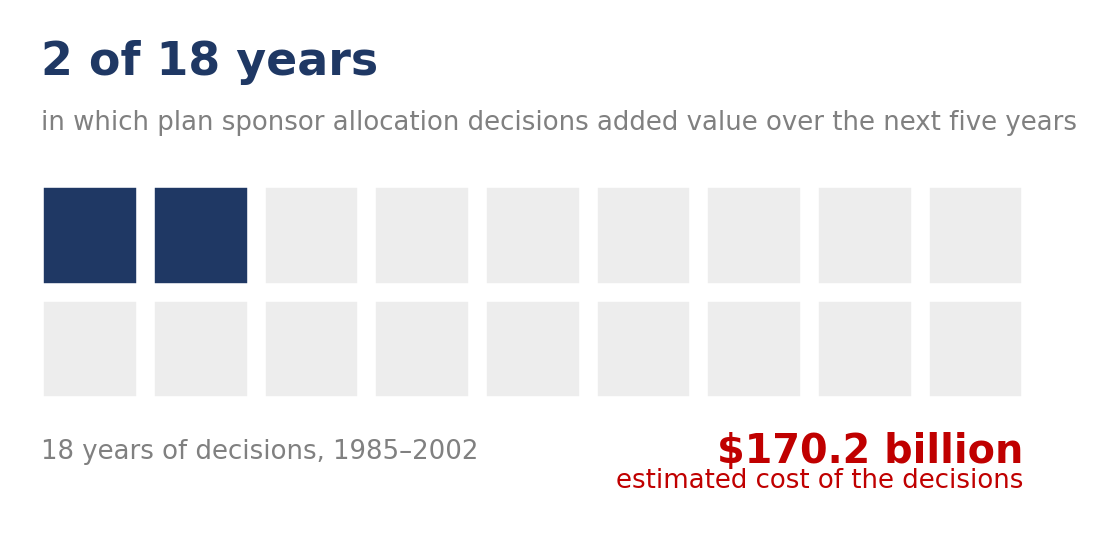 Figure 5. Plan sponsor allocation decisions and their outcomes, 1985-2002, as reported by Stewart et al. (2009).
Aubry and Yin (CRR, 2024) compared public plan returns to a simple 60/40 index portfolio from 2000 to 2023. Over the full period the two were virtually identical, about 6.1% annualized for both net of fees, as reported by the authors. Plans beat the index before the Global Financial Crisis and trailed it in every subperiod since. In other words, over that period, the complexity and cost of the average public plan did not produce a return advantage over a simple index portfolio, according to the authors' comparison.
Richard Ennis, retired chairman of EnnisKnupp and former editor of the Financial Analysts Journal, has published one of the sharpest versions of the critique. In the Journal of Portfolio Management, he found public pension funds underperformed passive investment by about 1.0% a year over the decade ended June 30, 2018, and endowments by 1.6%. His diagnosis: alternatives stopped functioning as diversifiers in the 2000s and became a drag. The median R-squared of 46 individual funds against simple stock and bond indexes was 98.5%, which he describes as diversification in the extreme, at a cost of 1.0% to 1.7% of assets annually.
In a 2022 follow-up, Ennis estimated statewide plan investment expenses averaging 1.3% of assets and found a sample of 24 funds underperforming passive benchmarks by 1.4% a year, while those same funds reported beating benchmarks of their own construction by 0.3%.
That last detail deserves a moment. When the scorecard is self-designed, the score can improve. This is the manager-picking problem of Step 5, with the added twist that the benchmark gets picked too.
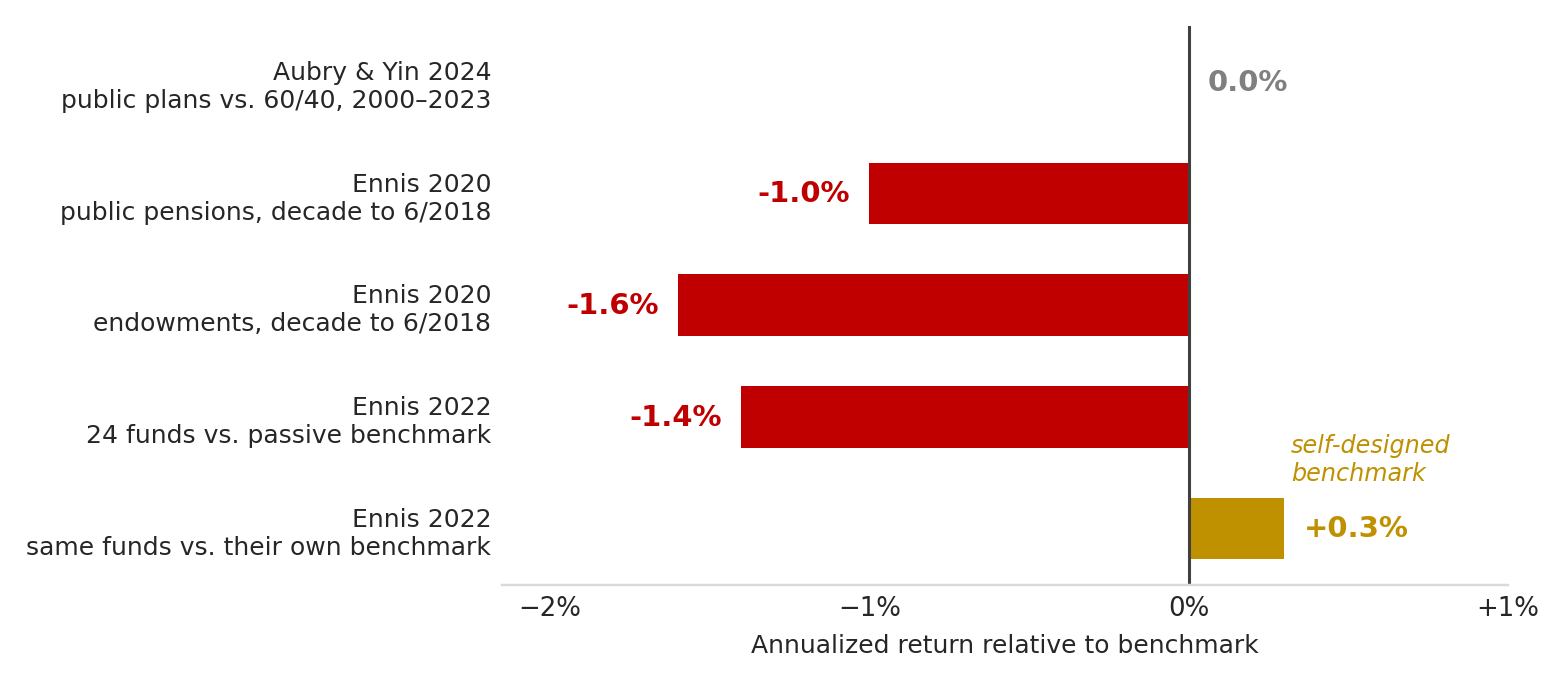 Figure 6. Annualized performance relative to benchmarks, as reported in the cited studies. The studies cover different periods, samples, and benchmarks and are shown together for reference only; they are not IFA performance. The final bar is the same 24 funds measured against benchmarks they built themselves.
There is one defense of alternatives that survives much of the above in conversation: the claim that active, illiquid strategies protect capital when markets fall. Research on how active funds perform in downturns has had mixed findings, and we are not aware of evidence that active management as a group reliably limits losses relative to similarly allocated passive portfolios. Ennis's 98.5% median R-squared is one empirical answer for pensions specifically: a portfolio that tracks stocks and bonds that closely shows no hidden defensive property in his data, only hidden costs. We welcome evidence to the contrary.
The Factor Explanation
For readers who think in terms of the Fama-French framework, the private equity puzzle can look different.
Leveraged buyout funds acquire companies that would mostly fall below the S&P 500 in size, then add debt. In factor language, that is concentrated exposure to the market, size, and often value premiums, amplified by leverage. On this view, what looks like alpha is largely beta.
The evidence is consistent with this. L'Her, Stoyanova, Shaw, Scott, and Lai (2016), four of them from CPP Investments, used Burgiss data and found what many others find before adjusting for risk: apparent outperformance. Then they built a levered, size- and sector-adjusted public index as a comparator, and the outperformance vanished on a dollar-weighted basis. They still argued buyout funds can play a useful role in institutional portfolios; the point is that the role isn't alpha.
Ludovic Phalippou of Oxford reached a similar destination from a different direction. Across three large datasets, average net multiples of money clustered around 1.5x to 1.6x, implying roughly 11% annualized, essentially matching relevant public equity indices, a result confirmed by public market equivalent analysis. Meanwhile he estimated carried interest collected at roughly $230 billion for 2006-2015 vintages, and $370 billion across all vintages through 2015. The number of private equity multibillionaires on the Forbes list rose from 3 in 2005 to 22 in 2020.
The older private-market literature pointed the same way, and pension staff had access to all of it. Kaplan and Schoar (2003) studied 746 private equity partnerships from 1980 to 1997 and found average fund returns net of fees approximately equal to the S&P 500; weighted by committed capital, venture funds beat the index before fees while buyout funds did not. Mulcahy, Weeks, and Bradley (2012), reporting on twenty years of the Kauffman Foundation's own venture investing, found that 62 of nearly 100 venture funds it had invested in from 1989 to 2011 failed to beat public markets after fees and carry, and that only 4 of the 30 funds larger than $400 million beat the Russell 2000. Kauffman titled that report We Have Met the Enemy... and He Is Us. It was published in 2012, nine years before public plans reached a 39% alternatives share.
Index-like returns on average, and substantial fees. Step 7 of the 12-Step program calls these silent partners, and private markets have many of them.
What This Evidence Does Not Show
Not every study reaches the same conclusion. Some research reports that certain private equity funds or vintages have outperformed public markets, and the Boston College authors stop short of concluding that plans' beliefs about alpha were wrong. The studies above cover specific periods, samples, and methods, and past results may not repeat. Alternatives may be suitable for some investors, and index-based portfolios can lose value, including when markets decline. This article does not address any reader's individual circumstances.
Why This Is Not Just a Pension Story
Public pensions manage roughly $5 trillion. Defined contribution plans manage considerably more at 15 trillion as of 6/30/2026, and the door may be opening.
Executive Order 14330, signed August 7, 2025, directed the Department of Labor, SEC, and Treasury to clear a path for alternative assets in 401(k) menus. The DOL rescinded its 2021 cautionary guidance within a week. On March 30, 2026, it proposed a process-based safe harbor giving fiduciaries a framework for selecting designated investment alternatives, including options that hold private equity, private credit, real estate, infrastructure, and actively managed digital-asset vehicles. The proposal is asset-neutral and applies to any such option; the comment period closed June 1, 2026. Separately, the Supreme Court heard argument on October 6, 2026 in Anderson v. Intel Corp. Investment Policy Committee, a case brought by Intel plan participants who challenged the inclusion of hedge funds and private equity in custom target-date funds. The question before the Court concerns what plaintiffs must plead to bring an imprudence claim. The Court has not ruled.
Alicia Munnell, who founded the Center for Retirement Research, titled her own assessment of the trend plainly: Workers Do Not Need Private Equity in their 401(k) Plans.
The Begenau-Liang-Siriwardane paper offers a useful way to think about how a similar dynamic could unfold, because it examines what happened among institutions. In our view, recordkeepers and consultants may grow more bullish. Plan sponsors may look at what comparable employers are offering. Committees could run optimizers on smoothed volatility. Nobody needs to be dishonest for an outcome to be poor: beliefs can propagate through a network, as they appear to have in the public plans. This is IFA's view and not a prediction by the authors. And individual savers may have less visibility into fees and valuations than institutions do, and, depending on the product, may face limits on when they can sell.
The Bottom Line
William Sharpe's arithmetic of active management applies by definition to the market as a whole: before costs, active investors as a group must earn the market return; after costs, they must earn less. Moving the activity into private vehicles does not obviously change this, though it can make results harder to measure.
Nor is there reason to assume private markets hold a deeper reservoir of skill than public ones. Barras, Scaillet, and Wermers (2010) examined 2,076 actively managed U.S. equity funds from 1975 to 2006 and separated genuine alpha from luck: 75.4% of funds had a true alpha of zero after costs, 24.0% had a negative true alpha, and 0.6% had a positive one, a figure the authors called statistically indistinguishable from zero. Fama and French (2010) reached a similar conclusion by a different route across 3,156 funds, finding that net-of-fee returns for the active management community as a whole were no better than random chance would predict; if skilled managers exist in numbers sufficient to cover their costs, they are hidden by the mass of managers who do not. That is a prior a fiduciary might reasonably carry into an asset class where performance is less observable, not more.
And the decision that actually determines outcomes is not which manager or which vehicle. Brinson, Hood, and Beebower (1986) asked what explains the returns of managed portfolios like pensions and endowments, examining ten years of data for 91 large pension plans. Asset allocation accounted for roughly 94% of the variation in a plan's returns over time; market timing and security selection together accounted for less than 6%. Roger Ibbotson later refined the framing: asset allocation explains about 40% of the differences in returns across funds, while on average 100% of the level of returns gross of fees is attributable to it. Either way, the conclusion for a committee is similar: among the most consequential decisions it makes is the asset allocation set out in a prudent Investment Policy Statement. The alternatives debate has consumed two decades of committee attention on a much smaller share of the variation in returns.
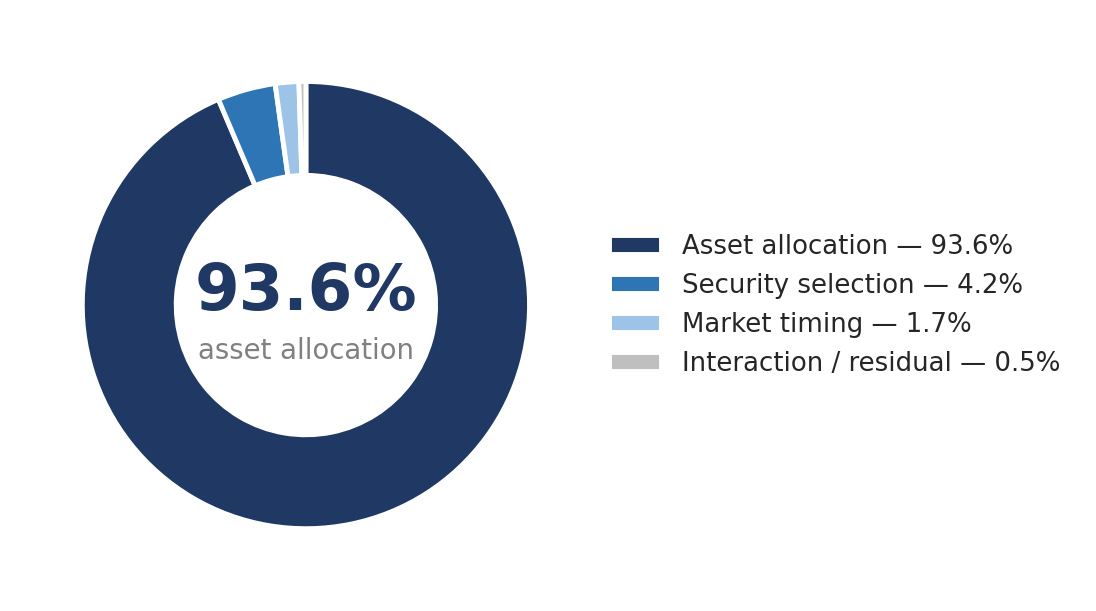 Figure 7. What explains the variation in a pension plan's returns over time, per Brinson, Hood, and Beebower (1986). This is not the same as differences in return levels across plans, which Ibbotson later put at roughly 40%.
The Boston College research is, at bottom, a study of how institutions come to believe things. Consultants offered a narrative. Peers provided reassurance. A twenty-year-old memory may have supplied the motive. What appears to have been missing was a mechanism for testing whether the belief was true.
The alternative to alternatives is not timidity. It is a risk-appropriate, globally diversified, low-cost portfolio of index funds, held with discipline, and measured against a benchmark you did not design yourself. It sounds unglamorous. According to the Aubry and Yin comparison, a simple 60/40 index portfolio matched the average public plan's return over 2000-2023 with far less complexity and cost. Past performance does not guarantee future results, and index-based portfolios can lose value.
That is not a modest finding.
References
Aubry, Jean-Pierre, and Yimeng Yin. 2024. "How Do Public Pension Plan Returns Compare to Simple Index Investing?" Issue in Brief 24-13. Chestnut Hill, MA: Center for Retirement Research at Boston College.
Asness, Cliff. 2023. "Why Does Private Equity Get to Play Make-Believe With Prices?" Institutional Investor.
Barras, Laurent, Olivier Scaillet, and Russ Wermers. 2010. "False Discoveries in Mutual Fund Performance: Measuring Luck in Estimated Alphas." The Journal of Finance 65(1): 179-216.
Begenau, Juliane, Pauline Liang, and Emil Siriwardane. 2026. "Explaining the Rise in Alternative Investments in Public Pension Plans." Issue in Brief 26-18. Chestnut Hill, MA: Center for Retirement Research at Boston College.
Begenau, Juliane, Pauline Liang, and Emil Siriwardane. Forthcoming. "The Rise of Alternatives." The Review of Financial Studies.
Brinson, Gary P., L. Randolph Hood, and Gilbert L. Beebower. 1986. "Determinants of Portfolio Performance." Financial Analysts Journal 42(4): 39-44.
Ennis, Richard M. 2020. "Institutional Investment Strategy and Manager Choice: A Critique." The Journal of Portfolio Management 46(5).
Ennis, Richard M. 2022. "Cost, Performance, and Benchmark Bias of Public Pension Funds in the United States: An Unflattering Portrait." The Journal of Portfolio Management 48(5): 138-150.
Executive Order 14330. 2025. "Democratizing Access to Alternative Assets for 401(k) Investors." August 7.
Fama, Eugene F., and Kenneth R. French. 2010. "Luck versus Skill in the Cross-Section of Mutual Fund Returns." The Journal of Finance 65(5): 1915-1947.
Goyal, Amit, and Sunil Wahal. 2008. "The Selection and Termination of Investment Management Firms by Plan Sponsors." The Journal of Finance 63(4): 1805-1847.
Hebner, Mark T. Index Funds: The 12-Step Recovery Program for Active Investors, 10th ed. Irvine, CA: IFA Publishing.
Kahneman, Daniel, and Amos Tversky. 1979. "Prospect Theory: An Analysis of Decision under Risk." Econometrica 47(2): 263-291.
Kaplan, Steven N., and Antoinette Schoar. 2003. "Private Equity Performance: Returns, Persistence and Capital Flows." MIT Sloan School of Management Working Paper 4446-03. Published in The Journal of Finance 60(4): 1791-1823 (2005).
L'Her, Jean-François, Rossitsa Stoyanova, Kathryn Shaw, William Scott, and Charissa Lai. 2016. "A Bottom-Up Approach to the Risk-Adjusted Performance of the Buyout Fund Market." Financial Analysts Journal 72(4): 36-48.
Markowitz, Harry. 1952. "Portfolio Selection." The Journal of Finance 7(1): 77-91.
Mulcahy, Diane, Bill Weeks, and Harold S. Bradley. 2012. We Have Met the Enemy... and He Is Us: Lessons from Twenty Years of the Kauffman Foundation's Investments in Venture Capital Funds and the Triumph of Hope over Experience. Kansas City, MO: Ewing Marion Kauffman Foundation.
Munnell, Alicia H. 2025. "Workers Do Not Need Private Equity in their 401(k) Plans." MarketWatch Blog, August 11. Center for Retirement Research at Boston College.
Phalippou, Ludovic. 2020. "An Inconvenient Fact: Private Equity Returns and the Billionaire Factory." The Journal of Investing 30(1): 11-39.
Sharpe, William F. 1991. "The Arithmetic of Active Management." Financial Analysts Journal 47(1): 7-9.
Stewart, Scott D., John J. Neumann, Christopher R. Knittel, and Jeffrey Heisler. 2009. "Absence of Value: An Analysis of Investment Allocation Decisions by Institutional Plan Sponsors." Financial Analysts Journal 65(6): 34-51.
Anderson v. Intel Corp. Investment Policy Committee, No. 25-498 (U.S. argued Oct. 6, 2026).
U.S. Department of Labor, Employee Benefits Security Administration. 2026. Proposed rule on selecting designated investment alternatives, proposed March 30, 2026.
Important disclosures
Index Fund Advisors, Inc. (IFA) is an SEC-registered investment adviser. Registration does not imply a certain level of skill or training. Information about IFA's services, fees, and conflicts of interest is available in its Form ADV Part 2A and Form CRS at https://adviserinfo.sec.gov/firm/summary/109143.
This article is for educational and informational purposes only. It reflects the author's opinions as of October 2026, which may change without notice, and is not investment, tax, or legal advice or a recommendation to buy, sell, or hold any security or to adopt any strategy. It does not take into account any reader's individual circumstances. Readers should consult a qualified adviser.
Studies, data, and views attributed to third parties are cited as reported by those sources and have not been independently verified by IFA. The authors of the cited studies did not prepare or review this article, and citation of their work does not imply that they endorse IFA or its services. Charts were prepared by IFA to illustrate figures reported in the cited studies.
Past performance does not guarantee future results. Return comparisons in this article, including comparisons of public pension plans to a 60/40 index portfolio and to passive benchmarks, are drawn from the cited studies, reflect the periods, methods, and fee treatment those authors used, and are not the performance of IFA or of any IFA portfolio. Index returns do not reflect fees or expenses, and you cannot invest directly in an index. No portfolio or strategy described here is guaranteed to match or outperform any other portfolio, benchmark, or strategy.
Figure 2 is a hypothetical illustration prepared by IFA using assumed costs (0.5% annual management fee and 0.5% transition cost). It does not reflect the actual results of any investor or IFA client. Actual costs vary.
All investing involves risk, including possible loss of principal. Diversification and asset allocation do not ensure a profit or protect against loss. Index funds are subject to market risk, and an index-based portfolio can lose value, including when markets decline. Alternative investments carry different risks, including illiquidity and valuation uncertainty, and may be suitable for some investors.
Descriptions of legislation, regulation, and litigation are summarized as of October 2026, are subject to change, and are not legal advice.