
 Risk Capacity
 Wealth Management
 Outsourced CIO
 Retirement Plans
 Institutional
 Financial
  Open an Account
 IFA App

 Articles
 Charts
 Investor Education ▾
 Fund
Fund
 Store
Store

 Taxes
Taxes Back-testing Disclosures
 Glossary
 Form CRS
A new academic paper says the SPIVA Scorecard — the most-cited evidence that active investing strategies often lose — has been unfair to them for years. It makes a serious case. But, as Robin Powell explains, it also changes the question.
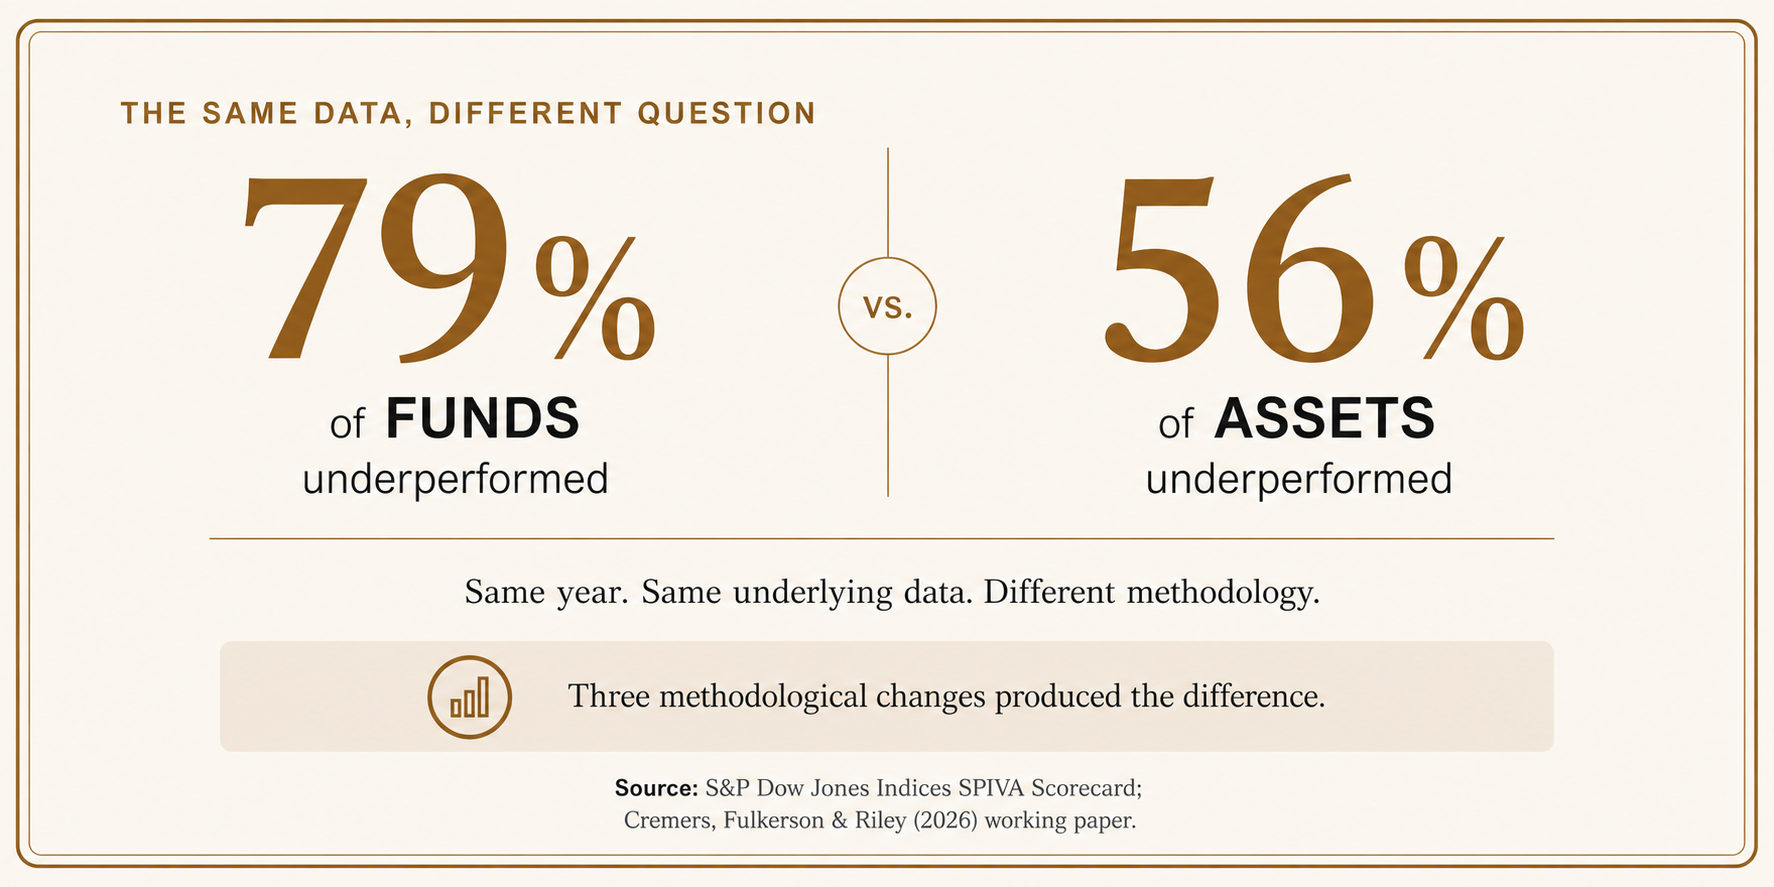
Start with two numbers. In 2024, 79 percent of active US equity funds failed to beat the S&P Composite 1500. That's the SPIVA figure — the sort of number that has kept the indexing argument settled for two decades. Now take the same year, the same funds, the same underlying data, and a new academic paper's headline: 56 percent underperformed. Not 56 percent of funds. Fifty-six percent of assets. Twenty-three percentage points move — and they move because the paper changes three things about how SPIVA counts, not one. The most important is the switch from funds to dollars, and not all three hold up equally well.
The paper was funded by the Investment Adviser Association's Active Managers Council, a body whose stated mission is to "balance the narrative" for active management. That isn't a disqualification. Plenty of good research is paid for by interested parties. But it's a fact you deserve up front, before the headlines get hold of it.
And the headlines have. If you've seen the "study proves SPIVA wrong" coverage and wondered whether the evidence base under your own strategy just cracked, that instinct is sound. When a scorecard's assumptions are doing part of the work, a skeptical investor is right to ask which part.
Two of the three changes have real merit. One doesn't. Each deserves a turn in the witness box.
What the SPIVA Scorecard Measures — and Why It Anchors the Case for Indexing
The SPIVA Scorecard is the twice-yearly report from S&P Dow Jones Indices that counts how many active funds beat their benchmark after fees. For more than 20 years, its answer has barely moved: most don't.
The mechanics are unglamorous, and that's the point. Since 2002, S&P has compared active funds against the style-appropriate S&P benchmark, correcting for survivorship bias and style drift so that dead or drifting funds can't flatter the record. Over 20 years, roughly 92 percent of active US equity funds underperformed. Even the strongest single category, large-cap value, still saw about 86 percent fall short.
Two things before we go further. First, SPIVA has never been the whole foundation of the evidence-based case. It's one well-known plank in a much larger structure built on cost, diversification, and decades of research into how rarely skill persists. Knock the plank about and the structure doesn't fall over.
Second, the seed the debate grows from: SPIVA counts funds, not dollars. It treats a $5 million fund and a $5 billion fund as equals — one fund each, one vote each.
Hold that thought. The challenger's whole case rests on it.
What the New Paper Actually Claims
The challenge comes from a competent, well-credentialed paper that rewrites three of SPIVA's rules and reports far kinder numbers. Methodology choices are rarely neutral, so the rules are worth reading closely.
The authors are Martijn Cremers, dean and professor of finance at the University of Notre Dame and co-creator of the Active Share measure; Jon Fulkerson of the University of Dayton; and Timothy Riley of the University of Arkansas, the corresponding author and a former SEC financial economist. The draft is dated 05/04/2026, and it's a working paper, not yet peer-reviewed. Riley's framing is that the Scorecard is "too negative on the value of active management."
Their three changes, in ascending order of how much they ask you to swallow:
One. Compare active funds against real, low-cost index funds rather than a costless index — because nobody gets to own the index for free.
Two. Weight results by fund assets rather than counting every fund equally.
Three. Credit a fund's actual return while it was alive, rather than automatically marking every fund that closes or merges as a failure.
Run all three together and the picture softens. Over 20 years, US equity moves from 92 percent of funds underperforming to 55 percent of assets underperforming — odds the authors call "approximately a coin flip." In fixed income over ten years, the result reverses outright: 71 percent of funds underperformed on SPIVA's count, against 37 percent of assets on theirs.
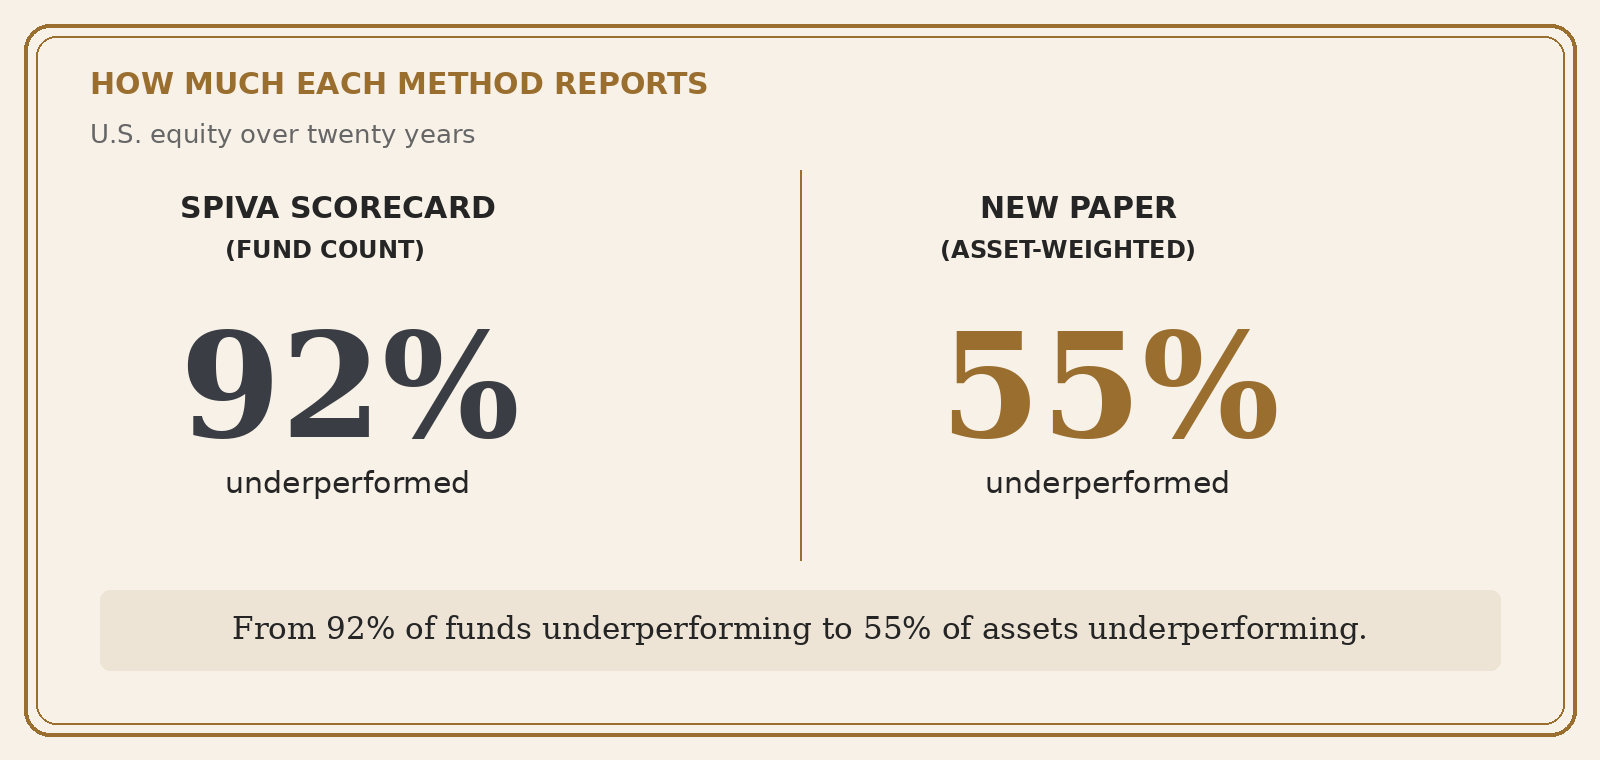
The unit changed — but so did the benchmark, and so did the treatment of funds that closed along the way. Three changes, stacked together.
Which of the Three Changes Survive Scrutiny?
One change is fair, one is debatable, and one doesn't hold up.
Witness one: the benchmark. Concede it. An index is a mathematical abstraction; an index fund charges something, however little, and has to trade. Measuring active funds against a costless benchmark hands them an opponent that doesn't exist. Even the paper's sharpest critic, Morningstar's Jeffrey Ptak, accepts this change, and Morningstar's own Active/Passive Barometer has been making it for years. A fair correction, and a small one.
Witness two: asset-weighting. Here the testimony gets slippery. Weighting by dollars sounds more realistic — surely what matters is how the money did, not how the fund count did. But look at which funds carry the weight. Ptak's analysis found the largest 1 percent of funds by assets held around 34 percent of all assets and charged roughly half what the smallest quarter of funds charged. Asset-weighting doesn't isolate manager skill, then. It largely measures investors' cost discipline — the very thing the indexing case tells people to exercise. One objection the authors have pre-empted: they weight by each fund's assets at the start of the period, not the end, specifically to avoid rewarding funds that only grew large after their good years. That's a fair design choice. It doesn't rescue the measure, though, because the money was already concentrated in the cheapest funds before the period began. The dollar-weighted result is worth knowing. It just isn't the measure of manager skill it's presented as.
Witness three: crediting dead funds. This one collapses under questioning. When a fund closes or merges, its investor doesn't get to bank the record and walk away. They face a second decision — where to move the money, what tax and transaction costs follow, and whether the replacement they pick has already had its good years. Credit the truncated record while ignoring everything that happens next and you re-import the survivorship bias SPIVA was built to strip out.
Ptak's high-yield proxy shows the mechanism. Of 78 high-yield funds that died over a 20-year period, average lifespan 8.3 years, 32 had been beating their benchmark when they died — but more than half of those didn't survive even half the period. The dead outperformers were alive for 2,844 fund-months in aggregate; the dead laggards managed 4,518. The winners were mostly the short-lived ones — which is what a run of luck often looks like.
The paper wants you to count returns hardly anybody was around long enough to collect. Ptak "didn't find the argument persuasive." Nor do I.
The fixed-income reversal needs one more caveat: some of it is noise rather than signal. The authors couldn't reproduce SPIVA's own numbers exactly, and on investment-grade intermediate bonds nearly a fifth of the improvement, by Ptak's arithmetic, came from that replication gap rather than from any adjustment.
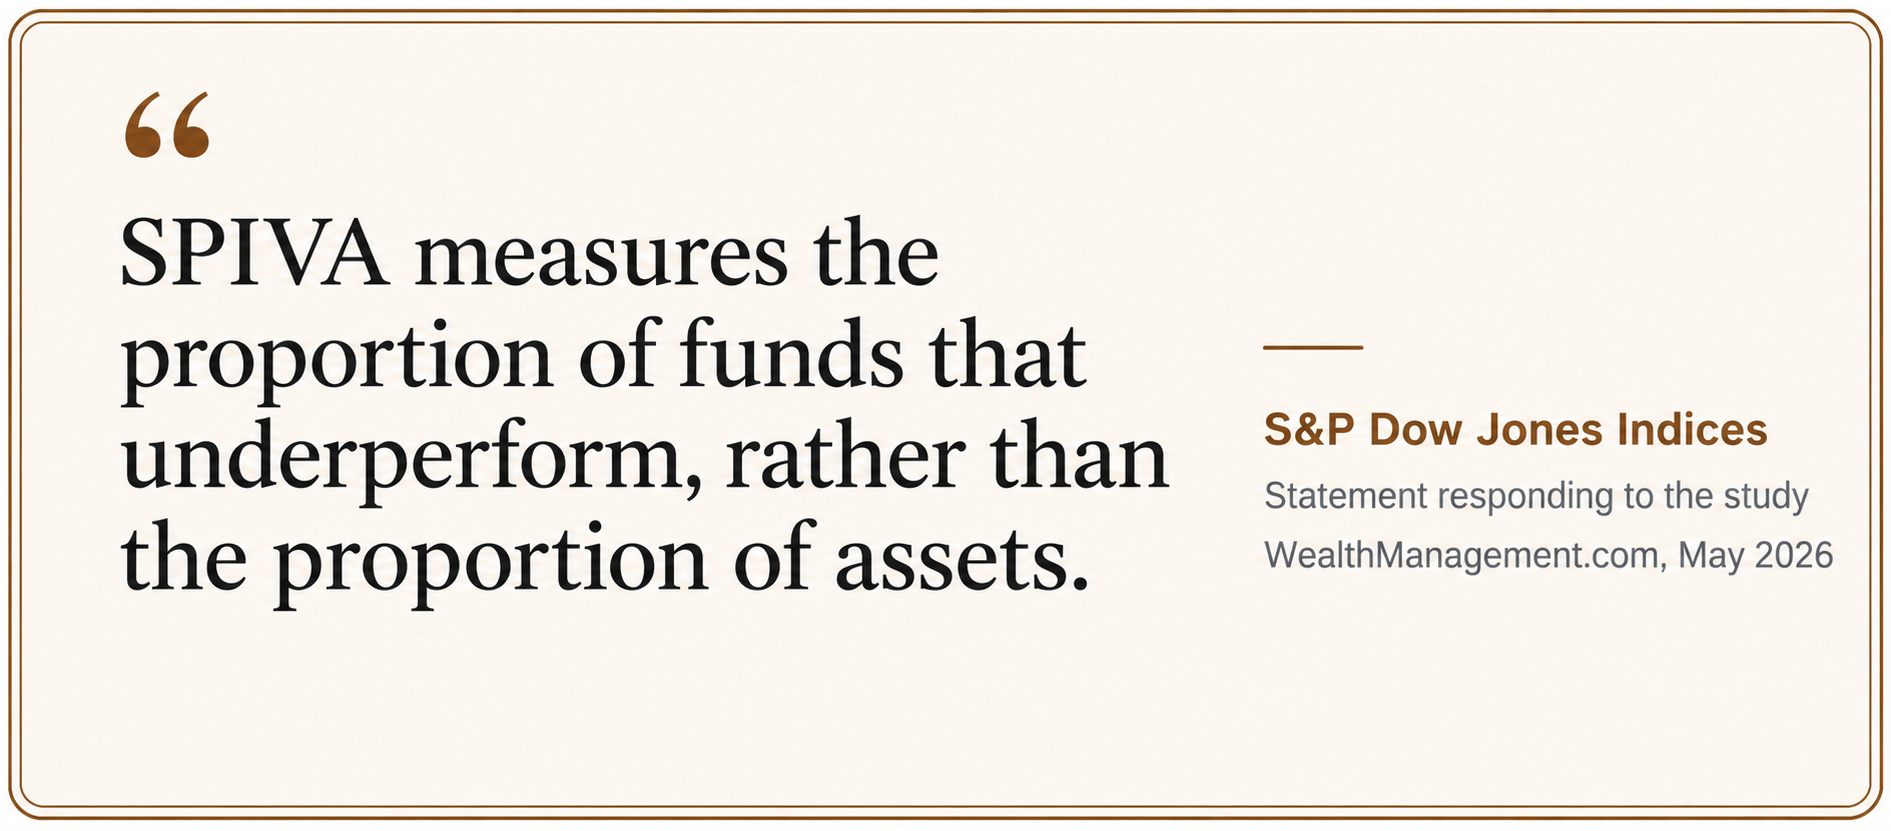
Grant every change, including the one that fails, and a majority of active US equity assets still underperformed historically: roughly a coin flip over 20 years, on the paper's own numbers. Ptak's separate replication, run against his own SPIVA baseline of roughly 90 percent, puts the more recent decade to 12/31/2024 at about 63 percent. Two different calculations, same direction. The debate narrows the gap. It doesn't close it, and it certainly doesn't reverse it. S&P Dow Jones Indices told Financial-Planning.com that SPIVA "measures the proportion of funds that underperform, rather than the proportion of assets" — a deliberate choice, not an oversight, because the claim active managers make to their clients is that they can beat the market.
The Question the Whole Debate Skips
Every figure in this argument, on both sides, looks backward: each tells you how the average historical dollar did. None can tell you the thing that determines your return: whether you could have picked the winning fund in advance and then held on to it.
Those are different questions, and the gap between them is where investor money disappears. Ptak looked at the 5,000-plus active US stock fund share classes alive on 05/31/2016. Over the following decade, about one in five died. Around 4,000 survived. Roughly 1,000 of the survivors beat their index on total return — a respectable-sounding number, until you ask how the average dollar inside those winning funds did. Only 430 of them also won on a dollar-weighted basis. Of the funds that started the period, only about 1 in 12 survived and beat the index on both measures.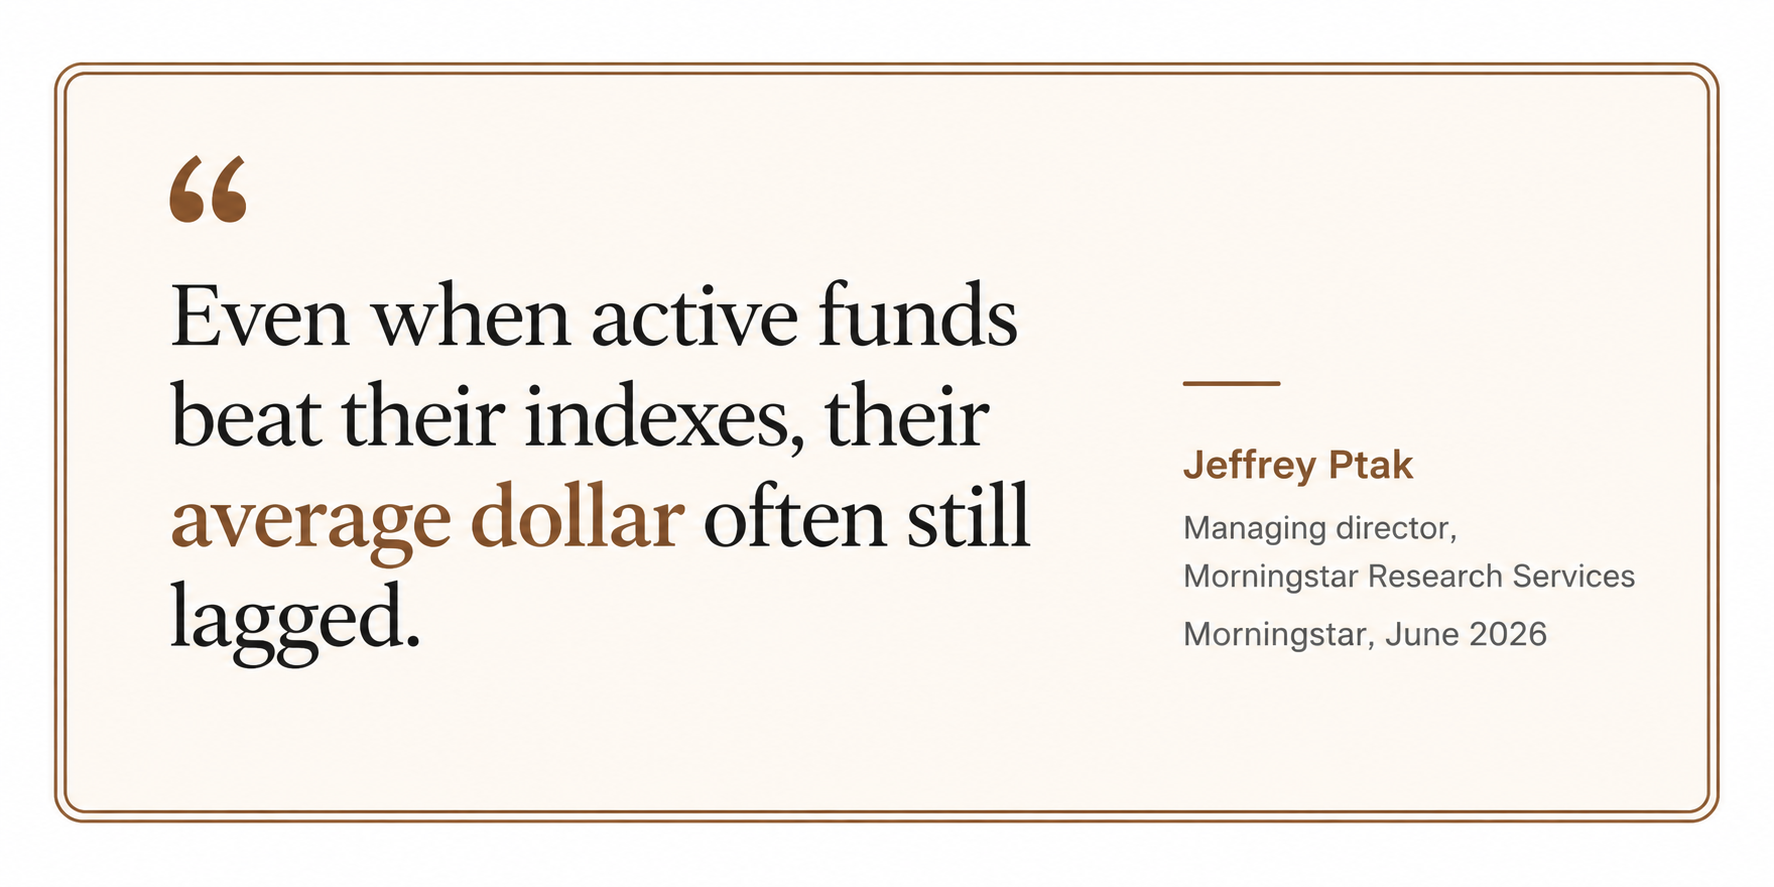
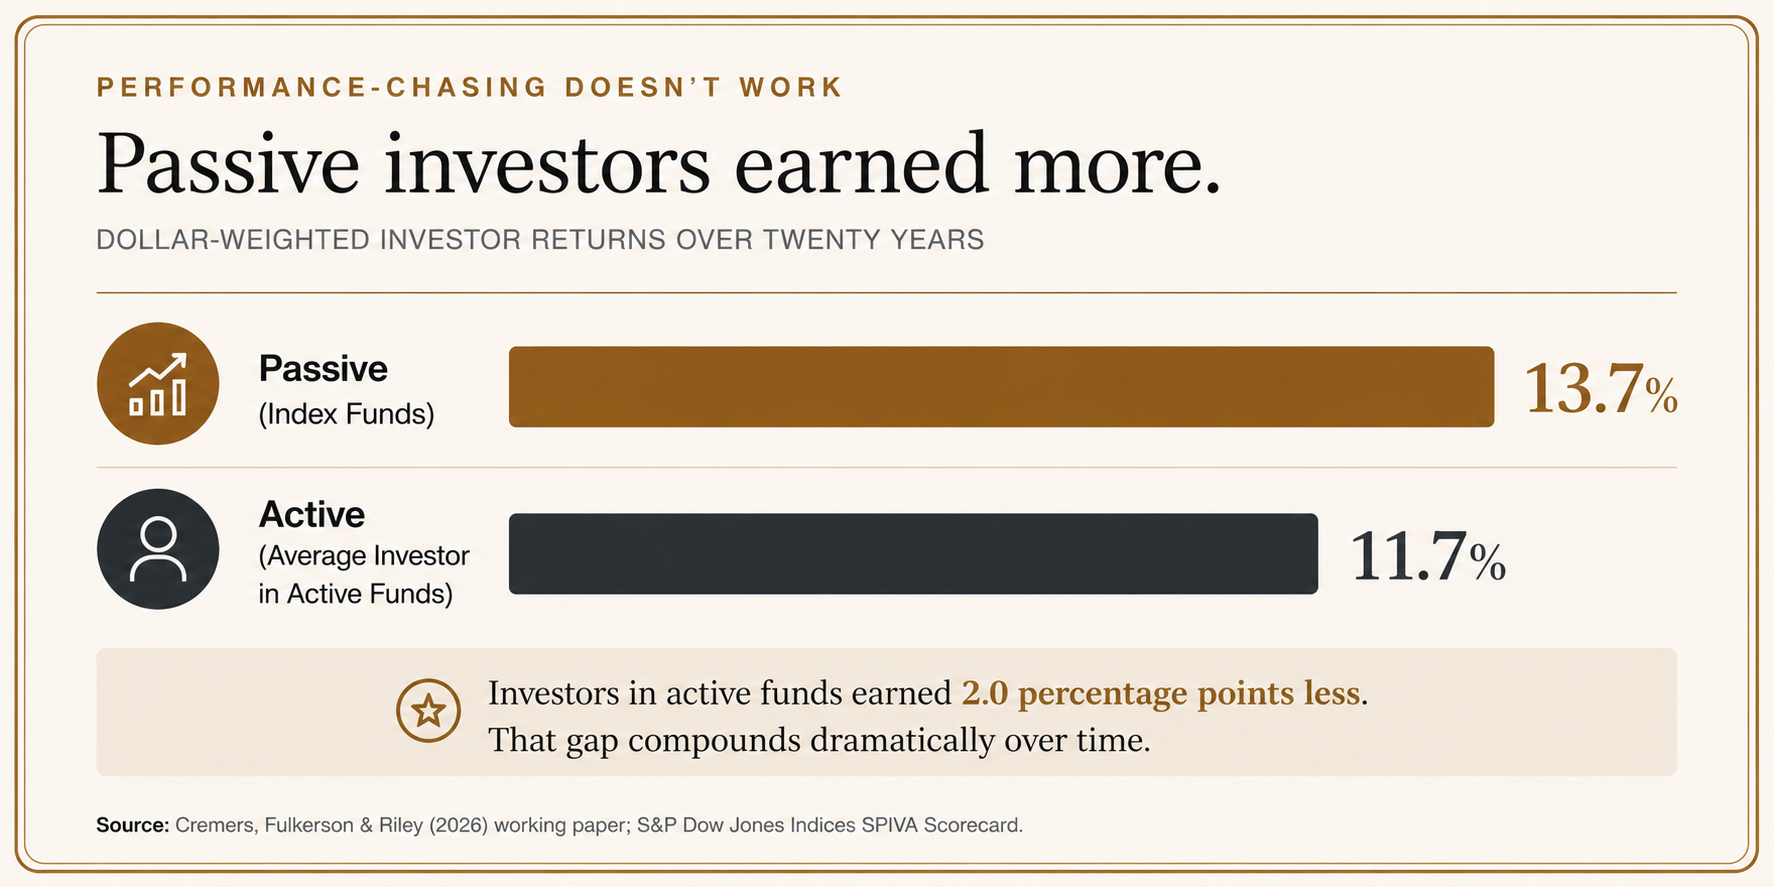
The reason isn't mysterious; you've felt the pull yourself. Investor cash flows have often tended to follow periods of strong performance and retreat after weaker performance. Performance-chasing, Ptak found, "dents dollar-weighted returns … and therefore should be avoided." Measured against real passive funds, the dollars inside outperforming active funds still lagged in aggregate: 13.7 percent a year for passive against 11.7 percent for active.
A paper claiming to capture the actual experience of investors also leaves out taxes. Neil Bathon of FUSE Research Network, quoted in WealthManagement.com, noted the authors could have factored in the tax cost of high-turnover active funds and chose not to. The world being modeled here is a cleaner one than the world you invest in.
What It Means for How You Invest Now
None of this shakes the case for evidence-based investing. The approach never depended on any single scorecard being flawless.
Give the fixed-income result its honest due, though. Active's best case has always been in the less efficient corners of the market — high-yield credit rather than US large-cap equity — and the paper's bond numbers are consistent with that. It's a point about where risk and return come from, which is what a factor-based framework already tells you. In my view, it does not constitute evidence that investors should hire an active bond manager, and it's certainly not a forecast.
The next time you see a headline announcing active management's comeback, ask two questions: Is the analysis counting funds or assets, and who funded the research?
If you want to think through what any of this means for your own portfolio, that may be a conversation worth having with a fiduciary financial professional who is not compensated for selling investment products.
Same Data, Different Question
The paper is worth reading, and it's partly right. It does not materially change the implications for a long-term evidence-based investment approach.
Go back to the two numbers we started with: 79 percent of funds, 56 percent of dollars. Three stacked changes made that gap. One witness held up, one wobbled, and one fell apart — and taking their testimony at its kindest, most active equity money still trailed.
The debate refines the map at the edges. Bonds. Less efficient markets. The cost of owning the benchmark you're measured against. The discipline that historical and forward-looking evidence has generally supported — keeping costs low, staying broadly diversified, and doing less than the industry would like you to do — is the same discipline it rewarded before anyone re-ran the SPIVA Scorecard's numbers.
The next time a headline announces active's comeback, investors may want to avoid making strategy changes based solely on a single headline. Ask what's being counted, and who's counting.
Resource
Cremers, K. J. M., Fulkerson, J. A., & Riley, T. B. (2026). How the SPIVA U.S. Scorecard understates the performance of actively managed mutual funds. SSRN.
ROBIN POWELL is the Creative Director at Index Fund Advisors (IFA). He is also a financial journalist and the Editor of The Evidence-Based Investor. This article reflects IFA's investment philosophy and is intended for informational purposes only.
DISCLOSURES:
This article is for informational purposes only and does not constitute investment advice, an offer, or a solicitation to buy or sell any security. This material includes general educational information and should not be interpreted as individualized investment advice or a recommendation to take any specific action. Past performance is not indicative of future results. All examples and data cited are based on historical analysis and may not reflect future market conditions. Investing involves risks, including the possiblity of loss and principal. The mathmatical principles discussed illustrate theoretical concepts and should not be interprested as guarantees of investment outcomes. Diversivication does not ensure profit or protect against loss.
Any discussion of regulatory actions is based on publicly available information and should not be interpreted as representative of industry-wide practices. There is no guarantee that reducing turnover or fees will result in improved investment outcomes.
The information discussed is general in nature and may not be suitable for all investors. Examples and studies cited reflect specific time periods and may not be representative of all market conditions or investor experiences. Individual circumstances vary, and readers should consult a qualified professional regarding their personal situation. Index Fund Advisors, Inc. (IFA) believes the information to be accurate but does not guarantee its completeness or accuracy. This article was sourced and prepared with the assistance of artificial intelligence (AI) technology.For more information about Index Fund Advisors, Inc, please review our brochure at https://www.adviserinfo.sec.gov/ or visit www.ifa.com.












 Home
Home 888-643-3133
 Contact Us
 Newsletter Subscribe
 eMoney
 IFA Apps
 Index Funds Book on Kindle
 Index Funds Audiobook
 Careers
 Facebook
 X
X LinkedIn
 Instagram
 Youtube
 Terms
Terms Index Descriptions