If you've been following our series on statistical significance in active fund performance, you'll know how easy it is to confuse genuine skill with random chance. In this third and final installment, we hand you the tool the industry doesn't want you to have..
We tracked more than 2,000 funds over 20 years and discovered that even the average winner would need 153 years of data to prove their outperformance isn't just luck.
Here's the simple three-input calculator that lets you test any manager's track record yourself — and see through decades of marketing in less than a minute.
What if the average winning fund manager — someone who survived 20 years and beat their benchmark — would need 153 years of data to indicate that they were not just lucky? Not 20 years. Not 40. One hundred and fifty-three years. That's not a typo. It's mathematics.
The first two parts of this series showed that star managers are usually lucky, and proving otherwise requires decades of data. But we're not asking you to take our word for it. By the end of this article, you'll be able to test any manager's track record yourself within a few moments.
You'll learn to use a simple online calculator with three inputs that reveal whether a fund's performance is likely skill or randomness. The tool is free. The implications are profound.
First we'll show you the evidence: what happened when we analyzed more than 2,000 funds over 20 years. Then we'll explain why your brain will resist it. Finally, we'll give you the tool to verify it yourself on any fund you choose. By the end, you'll never look at a "star manager" the same way again.
The Landscape: 2,000 Funds, 20 Years, One Devastating Result
IFA tracked 2,116 US mutual funds from Equity Style Boxes and Morningstar Categories with at least 90% of the funds stocks in US equity, including US Large Blend Value and Growth, Mid Blend Value and Growth, and Small Blend Value and Growth from January 1, 2005 to December 31, 2024. Each fund was measured against its Morningstar-assigned benchmark. This isn't cherry-picked — it's every fund with at least 90% US equity and enough data to analyze.
73% of these funds no longer exist. Nearly 2,000 closed or merged, typically to bury poor performance. Survivorship bias is real: we only hear from and see the record of those funds that survived the 20 years. In this case, 73% of the original funds have vanished from today's record.
Of the original 2,116 funds, only 237 (8.83%) delivered positive alpha relative to the Morningstar benchmarks over 20 years. Already a tiny minority. Among these survivors who outperformed, the average annual edge was 1.04%. When using a more academic benchmark, like the Fama-French 3-Factor regression model (FF3F), that average dropped to only 0.64%.
The 1.04% excess return over the Morningstar benchmark came with a standard deviation of 6.44%. Translation: year-to-year performance swung wildly. One great year, then mediocrity. Or worse.
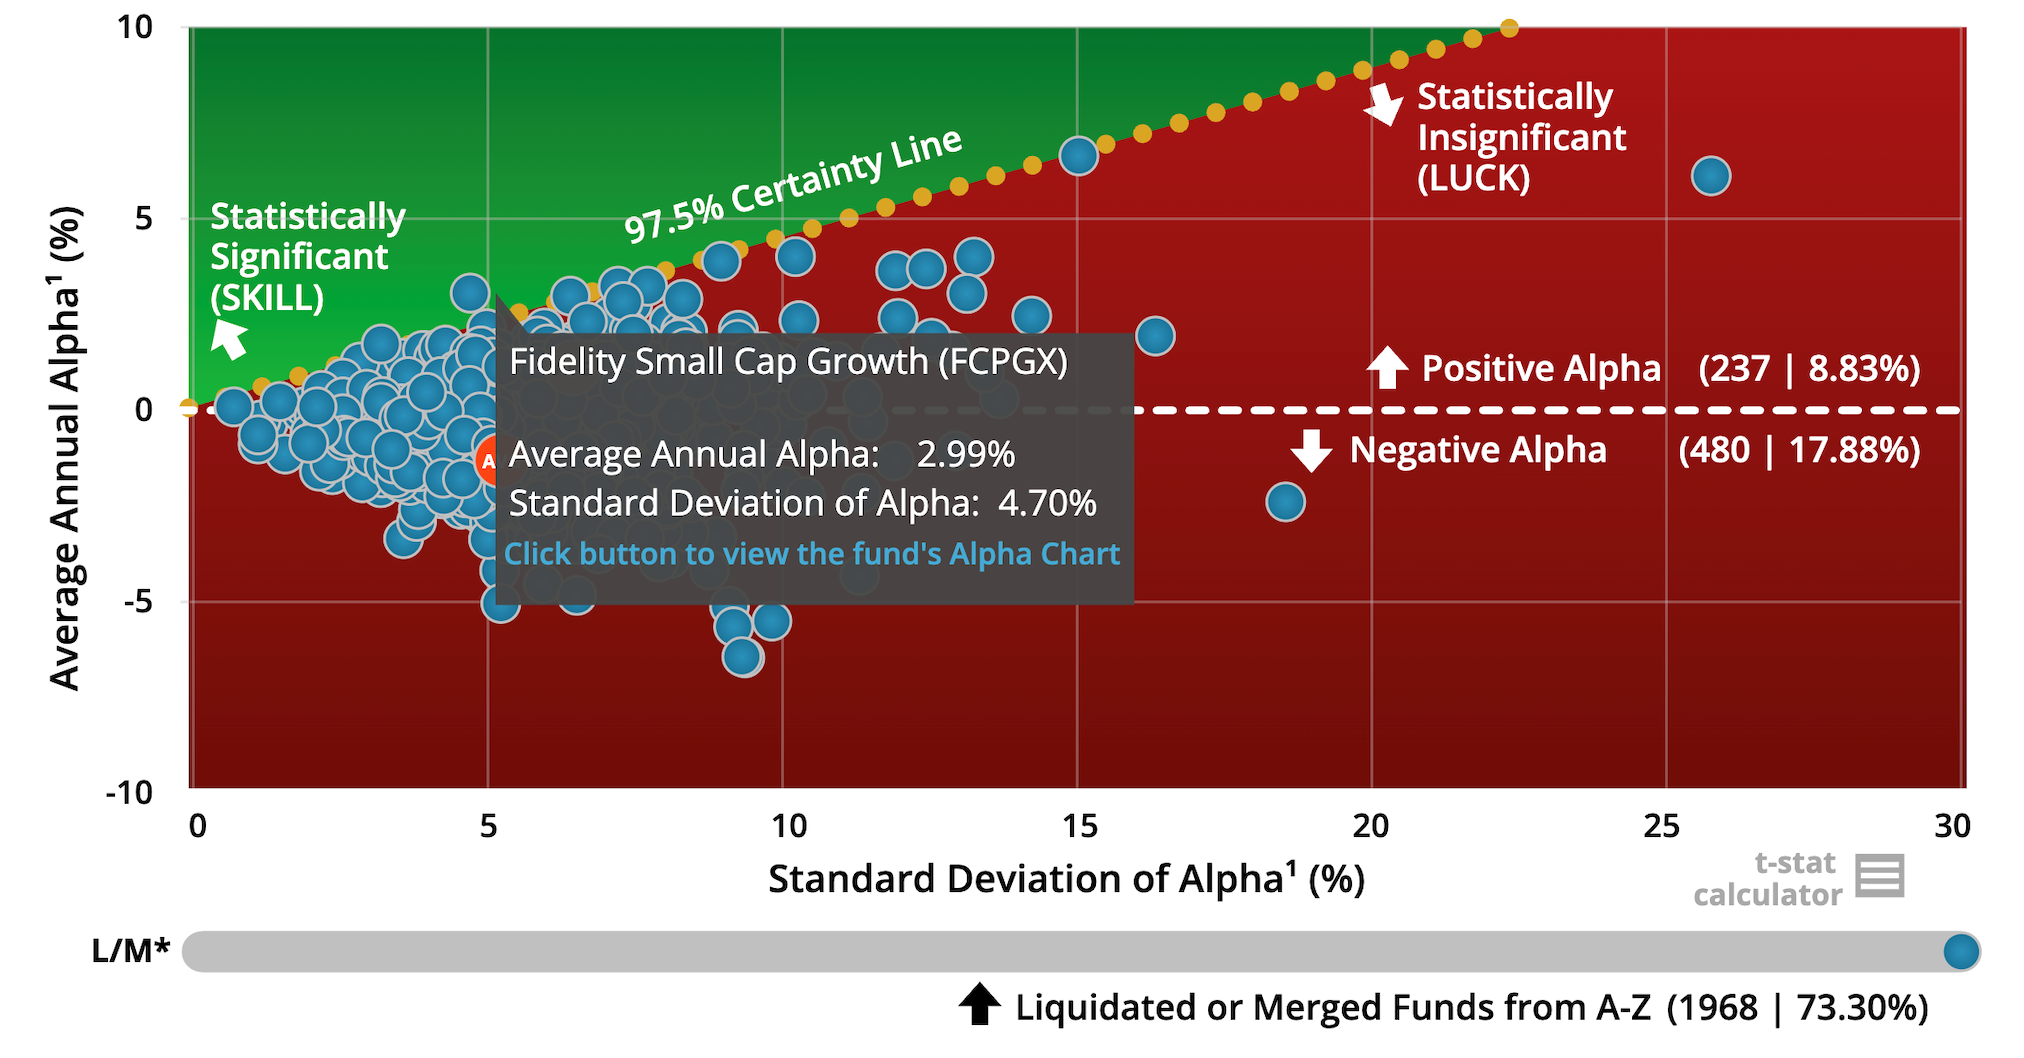
Look at the chart below. Each blue dot is a fund. The diagonal dotted line is the t-statistic threshold of two — the statistical bar for indicating a 97.5% chance of skill (we'll explain shortly what a t-statistic is). Above the line (i.e. the green zone) equals expected skill. Below it (the red zone) equals the excess return was indistinguishable from luck. The vast majority of funds — including most with positive alpha — sit in the red zone. Only 0.09% or 2 out of the original 2,116 appear to have skill. Using the more accurate FF3F benchmarking methodology, there were no funds in the green zone.
Now let's test the average winner. Average alpha: 1.04%. Standard deviation: 6.44%. Time period: 20 years. Input those numbers into IFA's t-stat calculator.
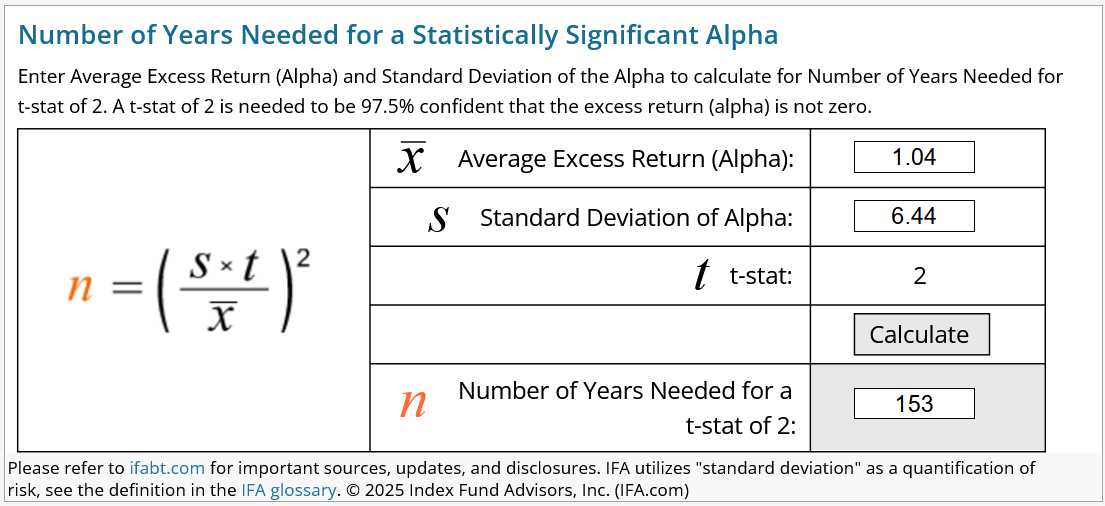
153 years.
That's how long you'd need to be 95% confident the 1.04% alpha isn't luck. Most managers don't work for 40 years, let alone 153. By the time you'd have an indication of skill, the manager is gone. Morningstar has a more accessible set of benchmarks to the public, so it more relevant and easiest to use their data. However, if you use the more accurate FF3F model, the number of years to indicate skill of the average fund with a positive alpha jumped up to 226 years!
Even among the rare funds that survived two decades and outperformed, the typical edge is so small and noisy that proving it's real is effectively impossible. And this is the average winner. Of the funds that survived the 20-year period, half did worse.
Why Your Brain Wants to Reject This
If you're thinking "153 years can't be right" or "but I know a manager who's different," that's normal. What you've just seen contradicts decades of mutual fund company sales and marketing programs and probably your own experience. Before you dismiss it, understand why.
Humans see patterns in noise. We credit managers for outcomes driven by chance. We mistake streaks for skill. As Nassim Taleb wrote in his famous book, Fooled by Randomness, our brains are wired for storytelling, not statistics.
Flip a coin 12 times. It won't take too long to get ten heads and only two tails — just by pure chance. But if those "coin flips" were a fund manager's winning record, we write headlines about their stock picking skill.
Three good years feel convincing. But Jacob Bernoulli proved centuries ago that the more trials you run, the closer you get to true probability. In fund management, we don't have enough trials within a career to confirm skill. That's the structural problem. As Michael Jensen's foundational 1968 study demonstrated, even 20 years of data often failed to separate luck from genuine alpha once there was an accounting for risk, like the FF3F model we can use today.
The t-statistic separates signal from noise. It asks: "Is this result meaningfully different from zero, or could it be randomness?" That's what this article shows you how to use.
The Tool: Understanding the T-Statistic
What Statistical Significance Means
When a fund outperformed its benchmark, was that result reliably different from zero, or could it have been just luck? Statistical significance answers that question.
A t-statistic of two means there was only about a 5% chance the outperformance was due to random variation — a 95% confidence level. Below that the results could easily be noise.
Eugene Fama — Nobel laureate and godfather of efficient markets — argues that in markets this noisy, even t-stats of two aren't enough. One good reason to Tune Out the Noise. Some academics demand t-stats of three. We'll use two as our baseline, but keep that higher bar in mind. As Fama and French demonstrated in their 2010 paper, Luck versus skill in the cross-section of mutual fund returns, proving genuine skill above luck requires vast amounts of data and large, stable alpha — assumptions that almost never hold.
The Formula: Plain-English Breakdown
Here's the formula that powers the test:
t-stat = (√Time Periods × Average Alpha) / Standard Deviation of Alpha
Don't worry — the calculator does this for you. But understanding the components shows why proving skill is so hard.
The numerator contains two elements that push the t-stat up. Average alpha: bigger outperformance equals higher t-stat. A fund that beats its benchmark by 5% per year has a better shot at proving skill than one that beats it by 0.5%. √T (square root of time period): more years equals more reliability. That's why 20 years beats the more common tracked record used by investors of about three years.
The denominator drags the t-stat down. Standard deviation of alpha measures how much the outperformance bounces around year-to-year. High volatility kills credibility. Even if the average alpha is positive, wild swings mean it could easily be luck. As Mark Carhart showed in his comprehensive 1997 analysis of 31 years of mutual fund performance data, once you control for known risk factors, apparent persistence largely vanishes — the volatility swamps the signal.
The intuition: to clear the bar, you need large alpha, delivered consistently, over decades. If any of those three is weak, the t-stat collapses. That's why virtually all active managers have not been able to confirm the evidence of their stock picking or market timing skill. Consequently, you should not accept their claims of skill.
Out of Sample Tests
An investor who interprets a statistically significant alpha as evidence of skill may be falling into the trap of data mining—drawing conclusions from what could be a random outcome confined to a specific time period.
To guard against this, academics often perform out-of-sample tests to validate whether a statistically significant result holds beyond the original dataset. These tests might involve using a completely independent time period (e.g., 2003–2024 instead of 1981–2002), or applying the same methodology to a different dataset from an overlapping time period (e.g., international markets instead of U.S. markets).
Investors should adopt the same discipline when evaluating manager performance. Out-of-sample testing helps determine whether a statistically significant alpha in one period is likely due to genuine skill rather than luck. The next period could be significantly different as you will see in a minute.
As Brad Steiman stated in his article titled Paradox of Skill, "On the surface, conducting out-of-sample tests might seem like an overly cautious approach akin to wearing a belt and suspenders. However, even if this were true, when you consider the consequences and what is at stake, it sure beats getting caught with your pants down."
When conducting performance analysis, the only reliable way to test out-of-sample data is by using completely independent time periods, such as two twenty-year periods. This means the number of years required to establish confidence in a manager's skill must be multiplied by the number of independent periods you deem necessary.
| Average Alpha | |||||
| 1% | 2% | 3% | 4% | ||
| Standard Deviation of Alpha | 4% | 64 | 16 | 7 | 4 |
| 6% | 144 | 36 | 16 | 9 | |
| 8% | 256 | 64 | 28 | 16 | |
For example, if a manager delivers a 1% average alpha with a 6% standard deviation, you'd need a 288-year track record across two independent periods to achieve statistical significance!
How to Use the Calculator
IFA's t-stat calculator requires just three inputs: average excess return (alpha), standard deviation of alpha, and time period in years. Click "Calculate" and you'll see how many years of data you'd need for a t-stat of two.
Most fund rating services — Morningstar, Lipper, Bloomberg — do not provide the standard deviations of past alphas. Why? Because it would expose just how unreliable most fund track records are.
IFA's 20-year fund performance chart shows everything you need: average alpha, standard deviation, and year-by-year alphas. Click "Sort by Fund Company," select a fund, and the data appears. To our knowledge, this transparency is unique to IFA and is the exception among firms that analyze fund performance, not the rule.
A Note on Benchmarks
The examples above use Morningstar benchmarks — the consumer-grade standard, with a few mentions of the FF3F model. Later, we'll show you what happens when academics apply a stricter test using the aforementioned Fama-French factors. Spoiler: funds that look like winners often vanish under academic scrutiny. But first, let's see what the standard method reveals.
Testing the Claims: Real Funds, Real Numbers
Theory is one thing. Let's run the test on real funds. We'll start with a dramatic example, escalate to the absurd, and finish with Warren Buffett.
Baron Partners Retail (BPTRX): The One-Year Wonder
Some funds look brilliant — until you examine when the outperformance happened. Baron Partners Retail (BPTRX) is the perfect cautionary tale.
In 2020, the Baron Partners delivered 110% excess return versus the Russell 1000 Growth benchmark — if the other 19 years saw a 0% alpha, the fund would have still provided a 5.5%/year over the 20 years.
Turns out the average 20 year alpha was only 6.06% so almost all the excess return was obtained in one lucky year.
The chart below tells a different story and provides an image of what luck looks like. That towering green bar in 2020 accounts for 110.03% — nearly the entire 20-year outperformance. One year. Strip out 2020, and the fund only averaged 0.03%/year above the benchmark for remaining 19 years.
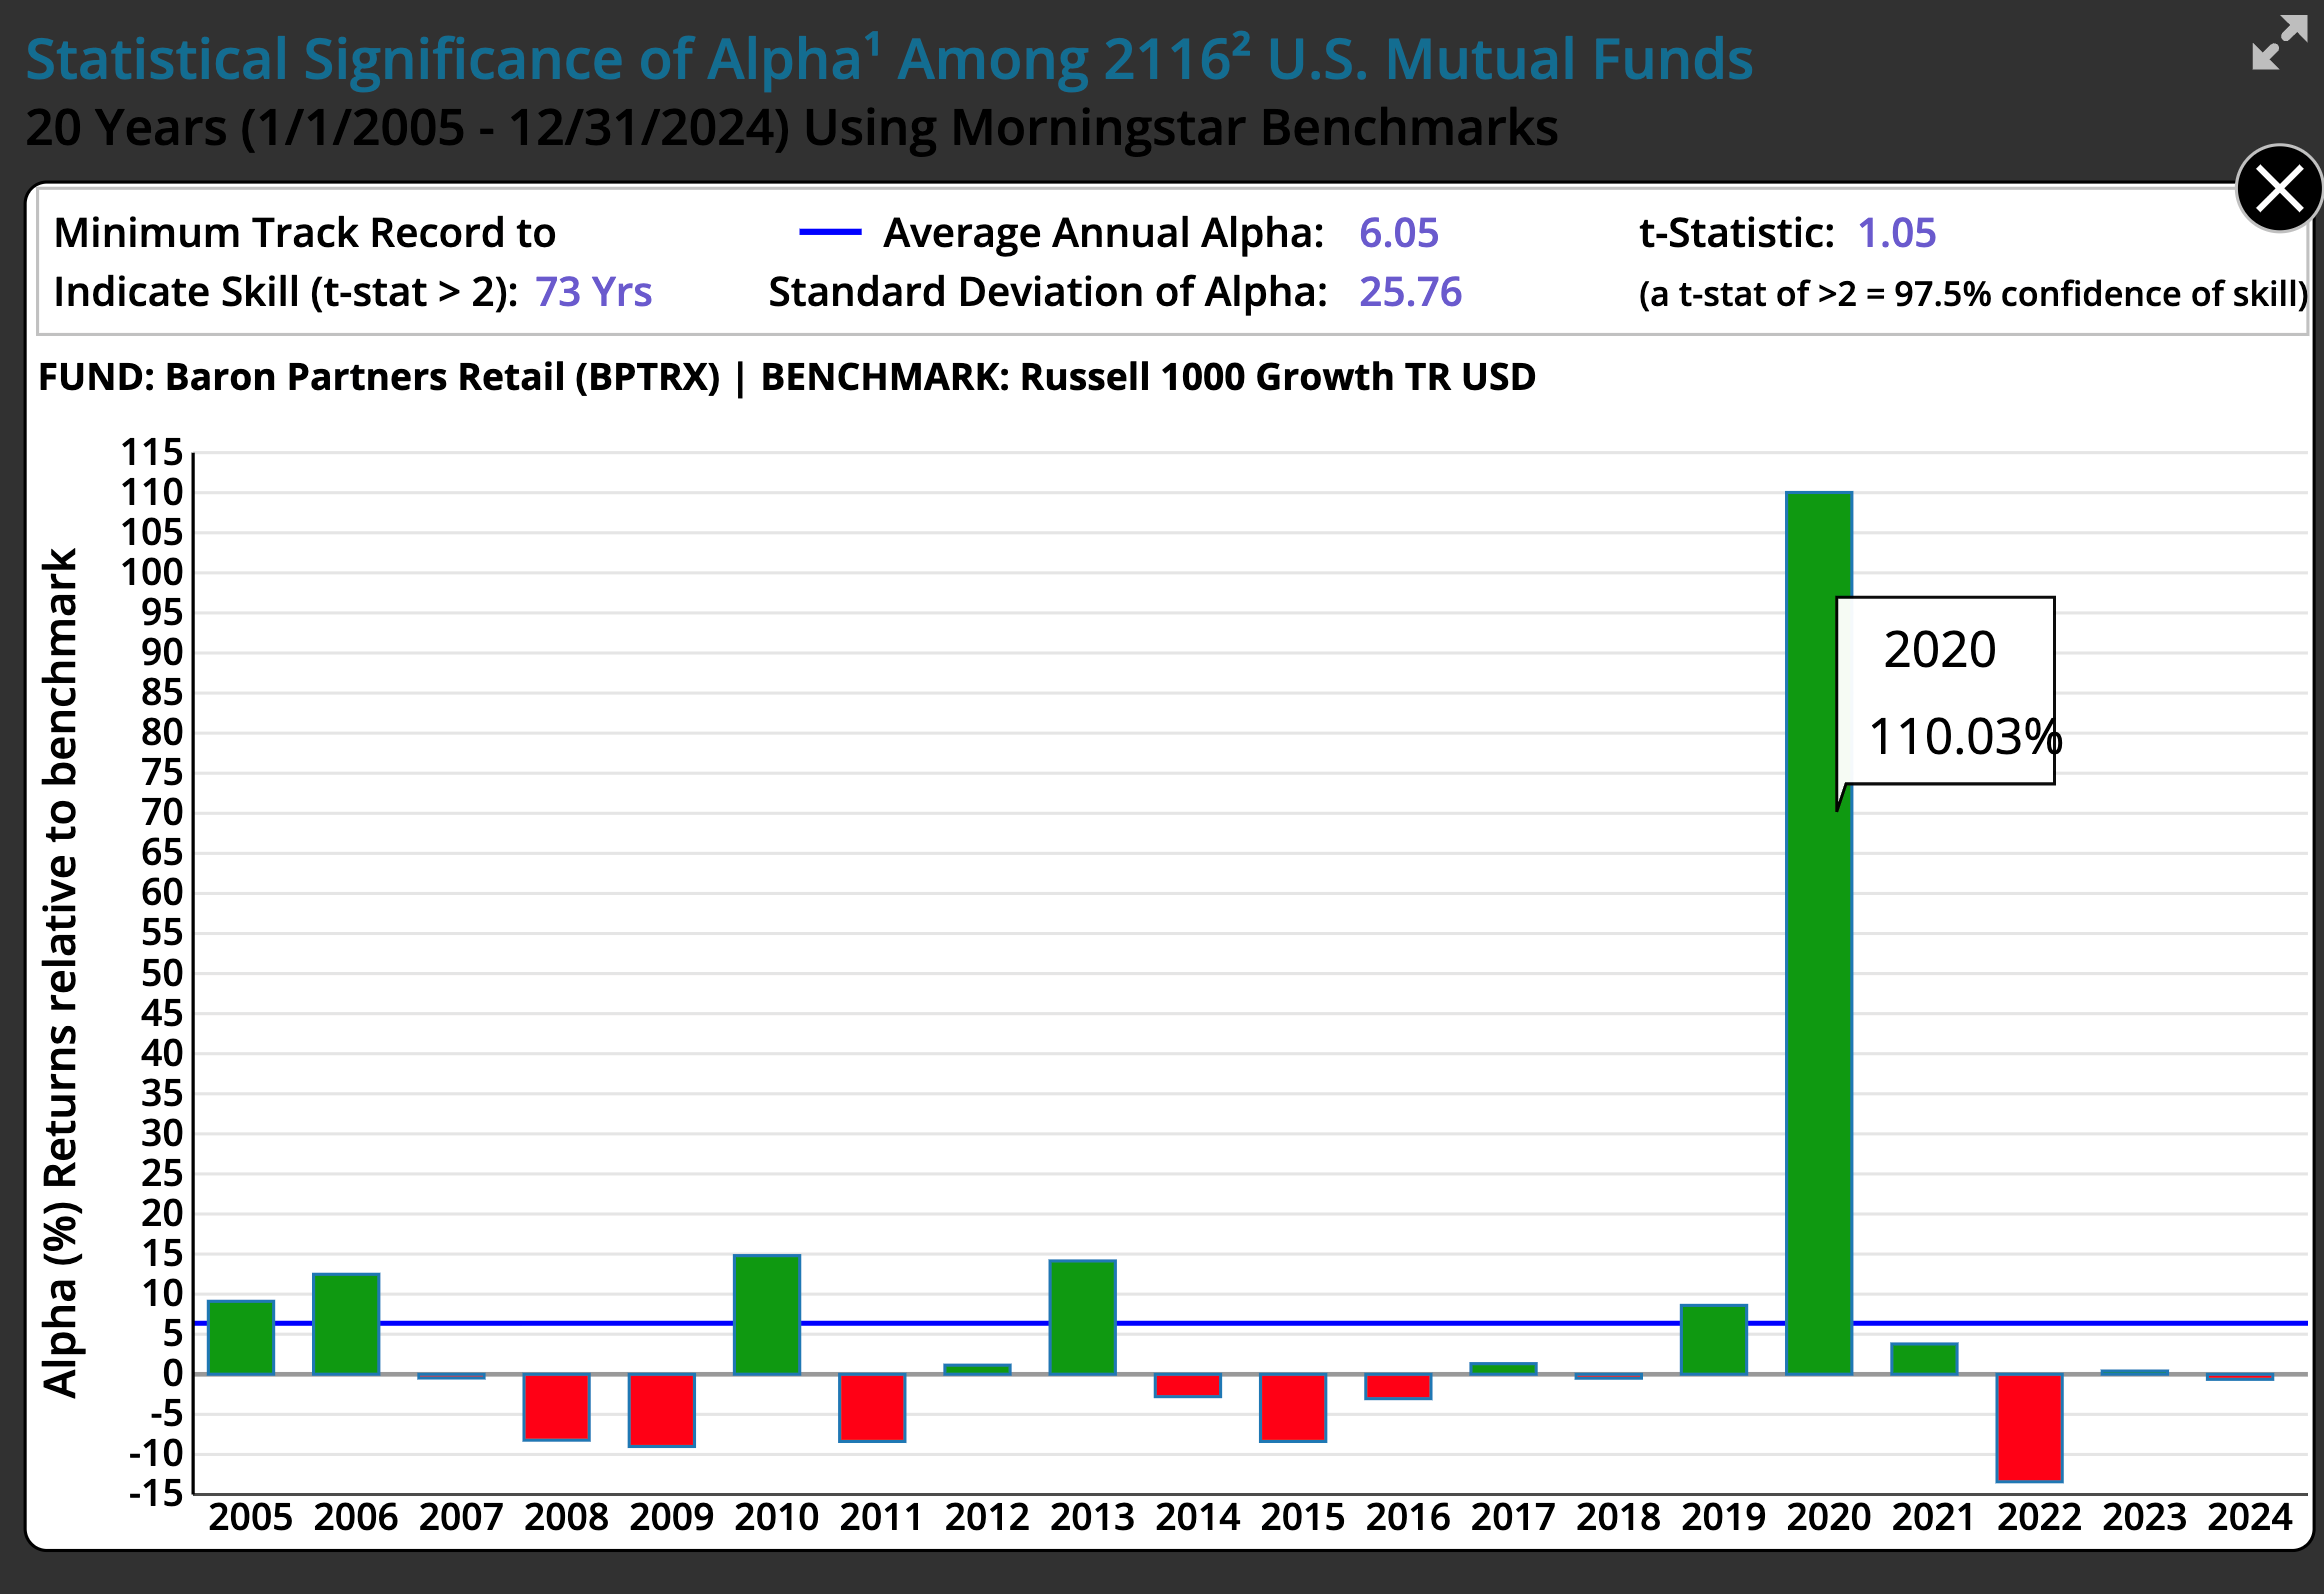
(excerpt from the Statistical Significance of Alpha Among 2116 U.S. Mutual Funds Chart)
The calculator confirms: Baron Partners needs 73 years to indicate skill because the standard deviation is massive (25.76%). That volatility — the wild swings year to year — kills the statistical case.
This chart, then, is the perfect illustration of luck in action. No doubt many investors looked at that 2020 performance and assumed the manager was skillful. But anyone who piled in after that extraordinary one-year result got mediocrity or worse.
One very, very lucky year isn't an indicator of skill.
The Extreme Outliers: When Luck Screams
If 73 years sounds ridiculous, brace yourself. When alpha is tiny and volatility is wild, the numbers get comical. These are real funds with real investors.
MassMutual Equity Opportunities R5 (MFVSX): 6,882 Years
Average alpha: 0.27%. Standard deviation: 11.36%. T-statistic: 0.11. Time needed to prove skill: 6,882 years.
What happened? One word: 2009. In the post-crisis recovery, MassMutual spiked 35% above its benchmark in a single year. Maybe they made lucky sector bets at precisely the right moment. Then the alpha vanished. Look at the chart below: one massive peak, surrounded by mediocrity and red bars.
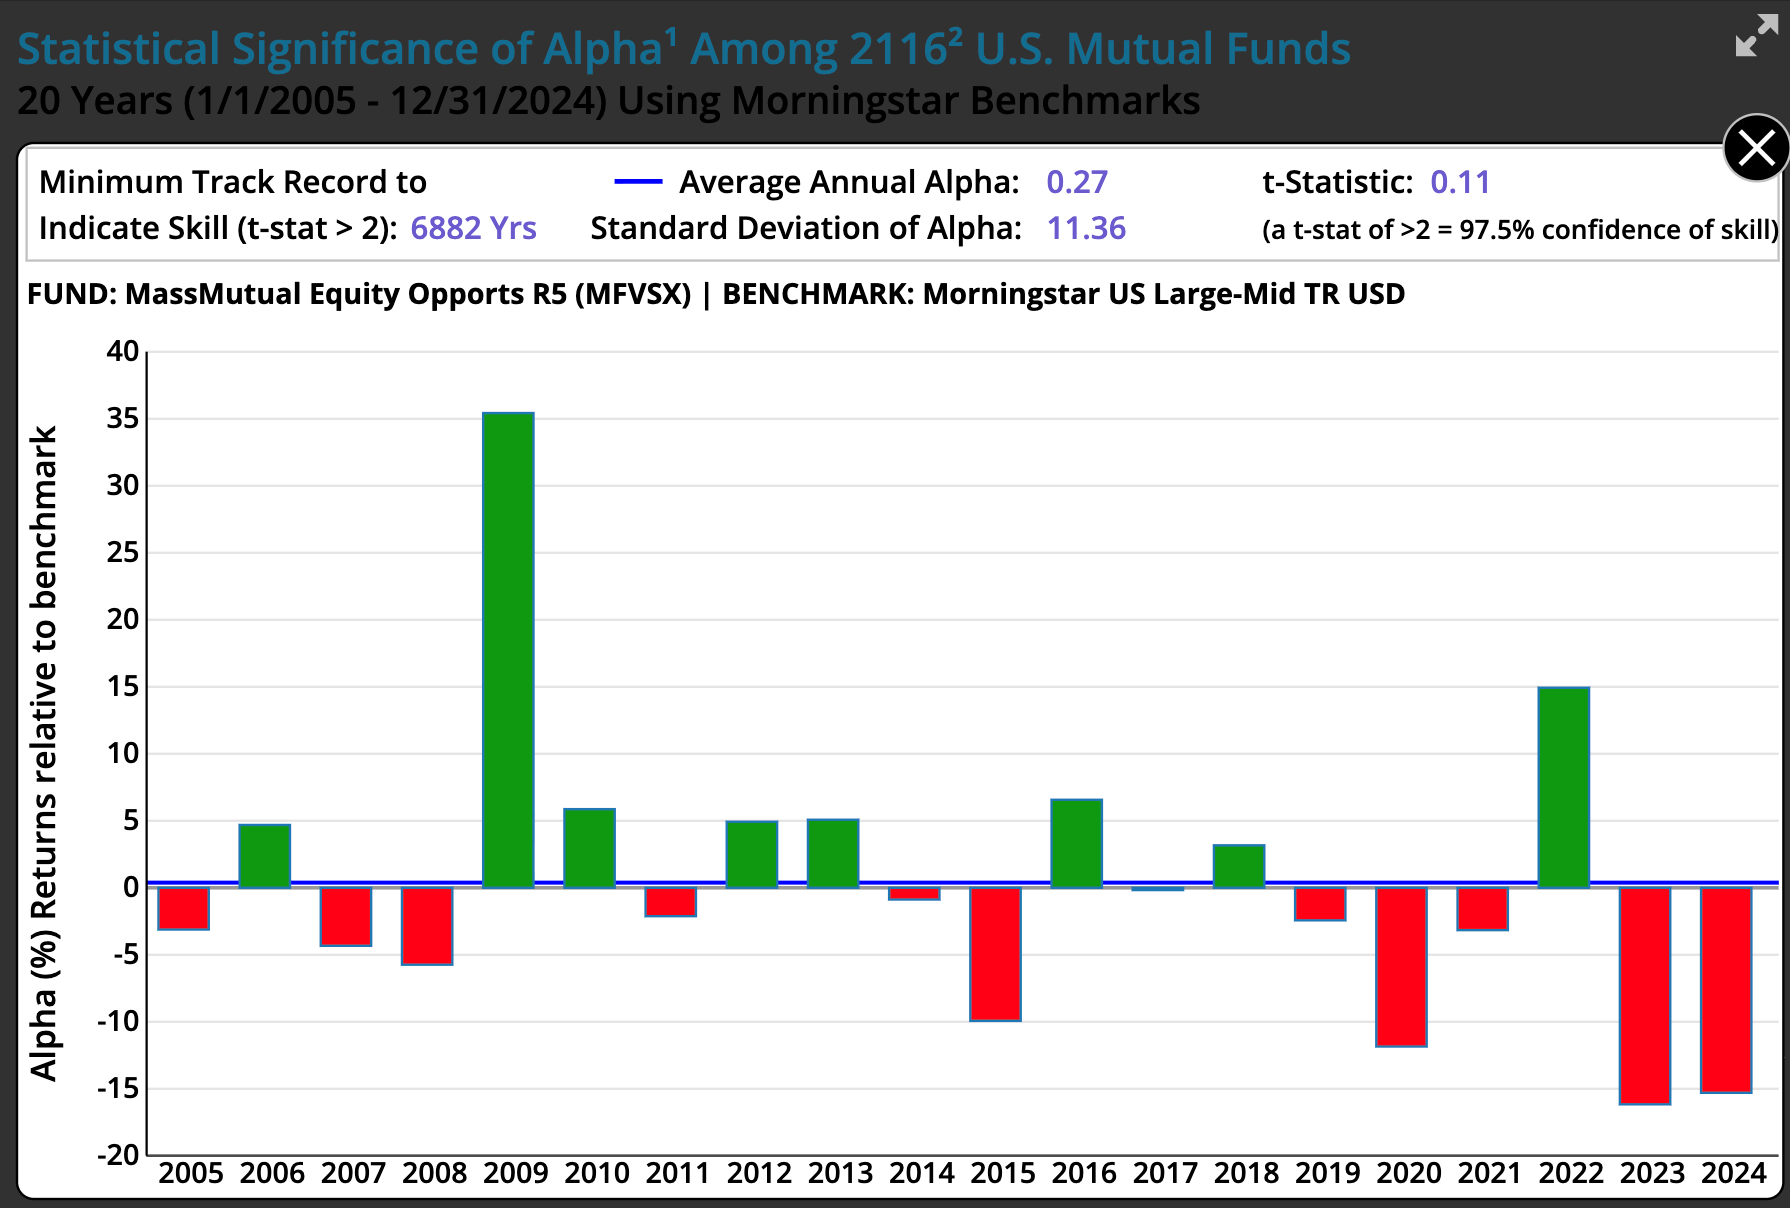
(excerpt from the Statistical Significance of Alpha Among 2116 U.S. Mutual Funds Chart)
This isn't skill. It's randomness. The standard deviation (11.36%) is so high that even 20 years of data can't distinguish this from noise.
Pin Oak Equity (POGSX): 14,718 Years
Average alpha: 0.23%. Standard deviation: 13.68%. T-statistic: 0.07. Time needed to prove skill: 14,718 years.
Same story, bigger magnitude. Pin Oak delivered 51% outperformance in 2009 — in the depths of the crisis. Spectacular. Unrepeatable. Every other year? Tiny gains or losses. The chart is chaos.
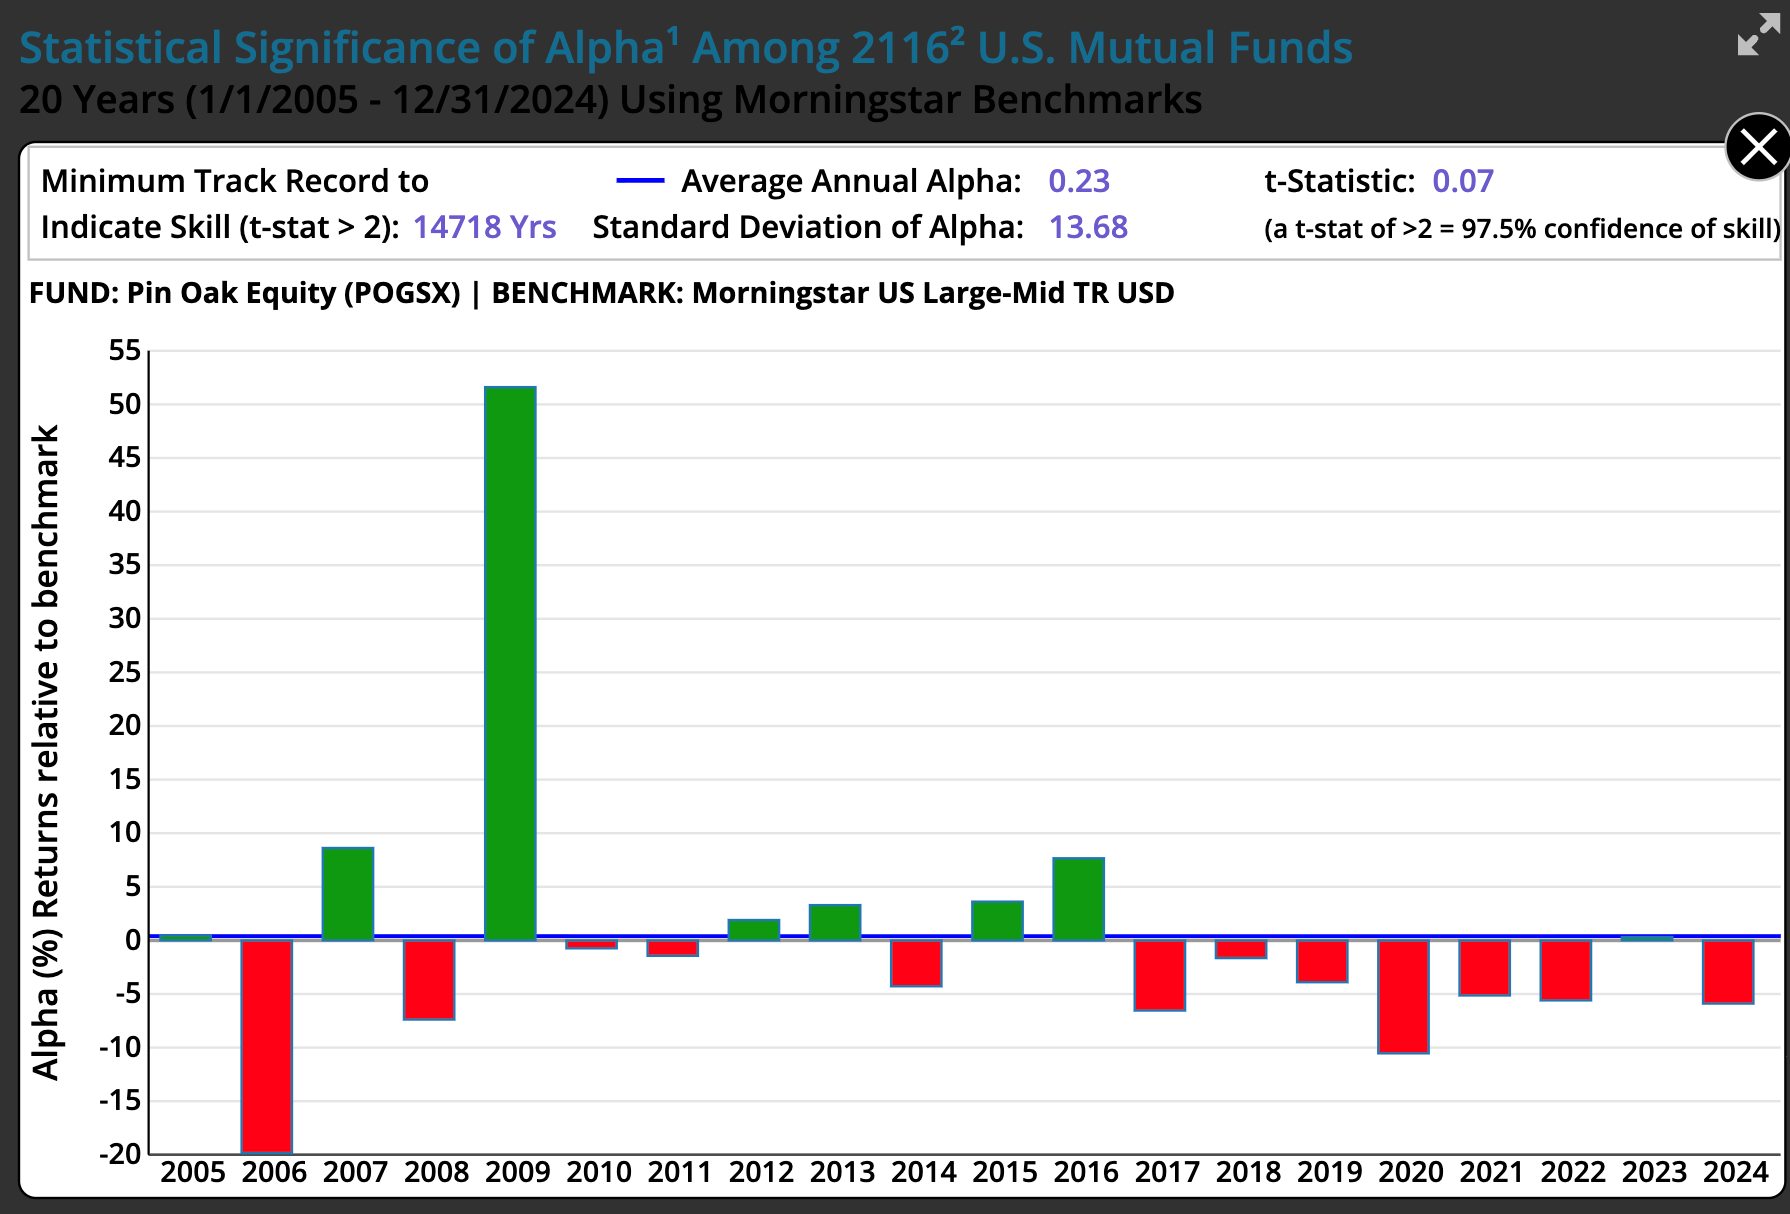
(excerpt from the Statistical Significance of Alpha Among 2116 U.S. Mutual Funds Chart)
Again, this is what luck looks like. One massive spike, no consistency, a t-stat indistinguishable from zero.
Imagine you're an investor. You see that 2009 performance. You read the headlines. You think: this manager has the golden touch. You invest heavily in 2010 and stay invested until the end of 2024. What happened? The alpha disappeared. You get an average negative alpha over the next 15 years. That's the danger of chasing recent performance — you're buying after luck already struck, mistaking the noise for the signal.
Warren Buffett: Even the GOAT Regressed
If anyone is assumed to have skill, it's Warren Buffett. One of the greatest investors of the modern era. Decades of outperformance studied in business schools worldwide. Let's run the test.
Period One: 1981-2002 (The Golden Years)
For the first 22 years of the Morningstar available data, Berkshire Hathaway delivered extraordinary results against the Russell 1000 Value benchmark:
- Average alpha: 16.77% per year
- Standard deviation: 25.15%
- T-statistic: 3.13
- Years needed to prove skill: 22 years
This is genuinely exceptional. A t-stat of 3.13 exceeds even Fama's stricter threshold. By statistical standards, this is skill.
But even here, there's a caveat. Benjamin Graham — Buffett's mentor — famously said he made more money on the insurance company GEICO than all of his other investments combined. Buffett's GEICO investment, and insurance investments in general, have been contributors to his overall success. Was that skill, or lucky bet early in his career? The concentrated bets on certain industries — documented thoroughly in IFA's analysis — suggests that even the greatest track records often hinge on concentrated bets that provided outsized returns.
Period Two: 2003-2024 (The Collapse)
Now look at the next 22 years. The numbers collapse:
- Average alpha: 0.65% (down from 16.77%)
- Standard deviation: 11.76%
- T-statistic: 0.26
- Years needed to prove skill: 1,296 years
Nearly 1,300 years. For Warren Buffett. In his second act.
What happened? Was he just in the right place at the right time and placed large bets on the winning industries or companies like Benjamin Graham? Even the most famous investor alive couldn't sustain outperformance in a second period.
If Buffett — with a t-stat of three in his early years — turned in a near zero alpha in his second act, what hope does all other managers have? And here's the brutal truth: by the time you think a manager has skill, you are not likely to see outperformance during your subsequent investment period. No wonder the SEC requires a cautionary statement on fund performance data that past performance is not indicative of future performance.
The identification problem is fundamental. If you'd invested with Buffett in 1981, you'd have done spectacularly — but you'd have been betting on someone without a proven track record prior to that period. If you waited until his record "looked like" skill in the through the 80s and 90's and invested in 2003, you caught the out-of-sample test that did not work out like the original sample. You got mediocrity for two next two decades.
The Benchmark Trap: Why Even Winners Don't Always Win
By now you're thinking: "OK, most funds can't prove skill. But what about the two funds that were in the green zone? Didn't Fidelity Small Cap Growth, for example, pass the indication of skill test?" Fair question. The answer reveals how benchmarks can also be misleading and/or a large percentage of funds have been style drifters.
Three Methods, Three Results
Not all benchmarks are equal. The standard investors see — Morningstar's style-box categories — is simplified for consumers. Academics use far stricter methods. Results differ dramatically.
Morningstar benchmarks use broad style categories that include 9 style boxes based on factors. The boxes are based on the sizes of large, mid, and small, and the styles of growth blend and value. Easy to understand, but imprecise. Funds can drift between factors and claim credit for capturing factor premiums that anyone could access via index funds or a blend of index funds based on the factors in the boxes.
Fama-French factors use a three-factor regression model that adjusts for exposure to market, size, and value. Often momentum is added to the regression and FF have added two more factors of profitability and investment. These regressions are the academic gold standard. If a fund's alpha survives Fama-French refined benchmarks, it's genuinely rare. As Barras, Scaillet, and Wermers demonstrated in their 2010 paper, False discoveries in mutual fund performance, once you account for multiple testing and factor exposures, only about 1% of mutual fund managers displayed genuine skill in their study.
Index funds represent the investor's best option: the goal of an index fund is zero alpha, zero volatility around that alpha. Just reliable beta — market returns — at minimal cost.
Why does this matter? A fund can look like a winner against Morningstar's benchmark but vanish against Fama-French. The fund didn't beat the market — it was just capturing factor premiums that have been known for decades (like small and value) that are available in passively managed funds at much lower fees.
In other words, Morningstar uses a consumer-simplified methodology that may miss the mark, and Morningstar may miss when fund managers engage in style drift. The academic multi-factor regression model doesn't. It catches them.
The Fidelity Reveal
Fidelity Small Cap Growth (FCPGX) looked impressive against the Morningstar benchmark: 2.99% average annual alpha for 20 years, with a low 4.70% standard deviation. It sat in the green "skill" zone when compared to the Morningstar specified Russell 2000 Growth benchmark.
Now re-test using Fama-French factors by clicking the Fama/French button below the chart. Watch what happens.
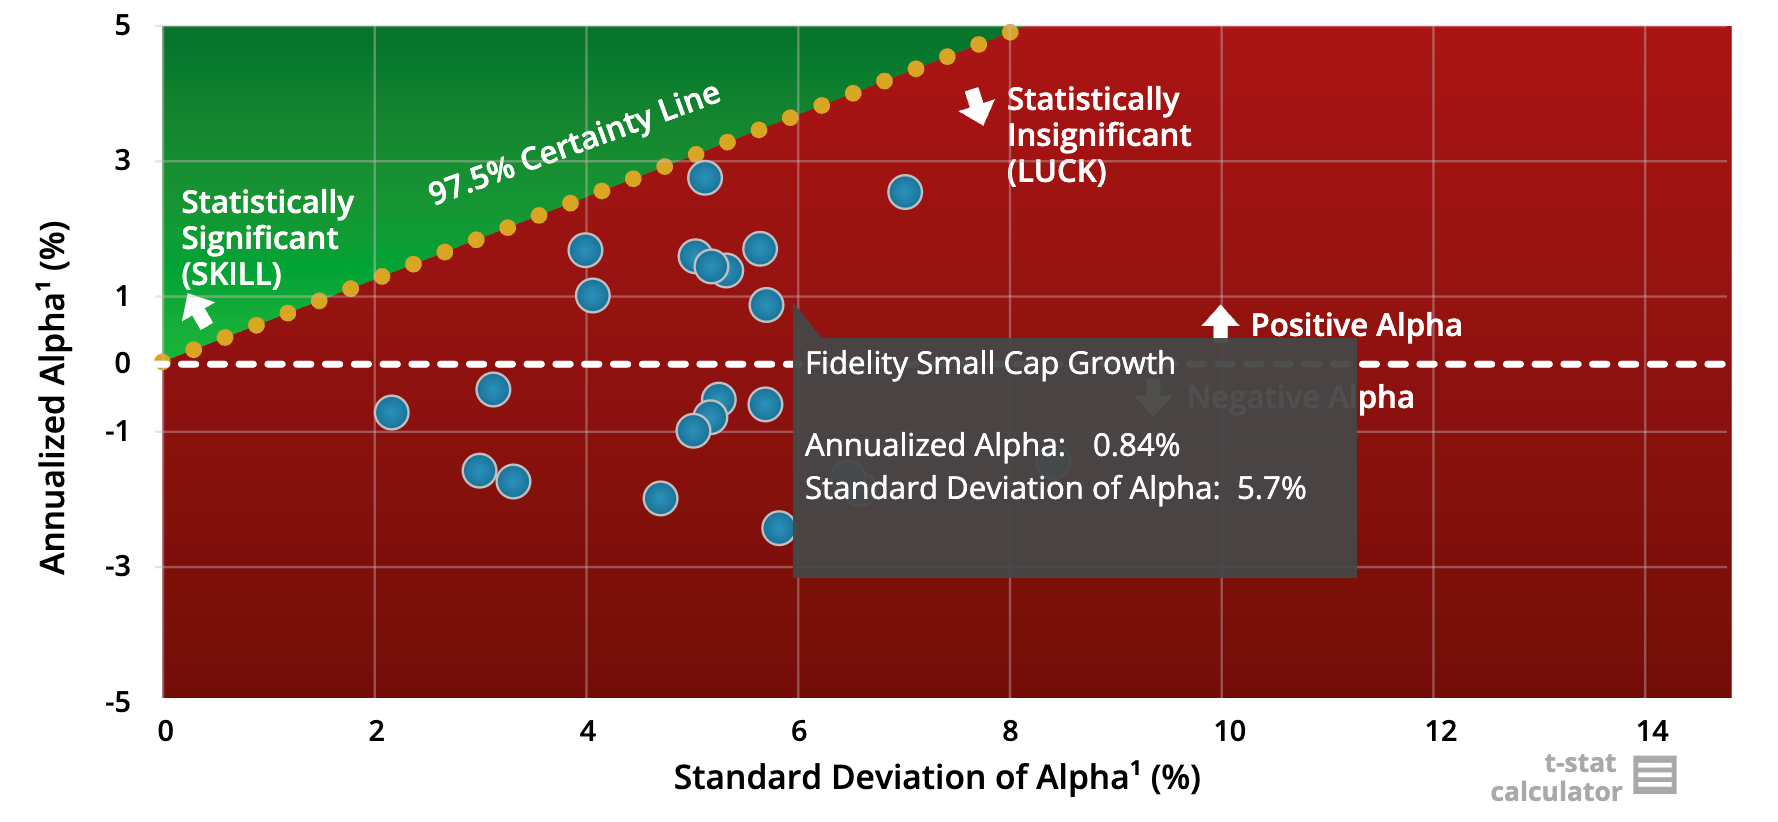
Against the regression using the Fama-French factors: the alpha dropped to 0.84%, standard deviation rose slightly to 5.7%, and the fund falls below the t-stat threshold into the red zone. The "skill" evaporated.
What happened? The fund wasn't beating the market through manager skill — it captured size and value premiums academics have known about since the 1990s. "Small growth" funds aren't locked into buying just small growth stocks. Prospectuses allow broad mandates. When value stocks outperformed, Fidelity may have tilted early toward small value territory to catch the higher return than small growth. When momentum stocks surged, they may have unknowingly benefited from that. They may have captured factor premiums that anyone could access via low-cost passively managed funds and charged higher active management fees for doing it.
If a fund only clears the skill threshold against a consumer-grade benchmark, be skeptical. Demand benchmarking using Fama-French multifactor regressions. If it can't survive that test, you're paying active fees to capture passive factor exposure.
The Index Fund Cluster
Go back to the master chart showing all 2,116 funds. See that tight cluster in the bottom-left corner — near zero alpha, near zero standard deviation? Those are mostly index funds.
Index funds don't try to beat a market or a factor. They are markets. Zero alpha by design. Near zero volatility around that near zero alpha. They sit exactly where investors should aim: reliable, low-cost, low-volatility exposure to market returns, or betas. In multi-factor models like the Fama-French Three-Factor Model or Carhart Four-Factor Model, the term "beta" is generalized to mean exposure to any systematic risk factor.
Active funds scatter across the red zone — high volatility, insufficient t-stats. The handful in the green zone are rare and vulnerable to benchmark gaming, as the Fidelity example demonstrates. The index fund cluster is where discipline lives.
What This Means for You
The Impossibility Problem
Fund managers don't work for 50, 100, or 150 years. Most have 20 to 30-year careers if they're lucky and rarely even stay at the same fund or fund family. By the time you'd have enough data to indicate skill statistically in one sample period, the manager is gone. Retired. Managing different funds with a different strategy.
Even if a fund has a 20-year track record, it's rarely the same person running it. Teams change, star analysts leave for hedge funds, strategies drift with market conditions. A 20-year fund record is often three to four different managers under the same fund name. You're not investing in a person — you're investing in a brand. And brands don't have skill, nor do people against efficient markets. It's a tall order to discover mispriced or wrongly priced securities when Fama says the price is right, as he did in the documentary Tune Out the Noise.
The Costs Are Real, The Expected Alpha Is Not
Active funds charge 0.5% to 1.5% annually — a massive hurdle when Fama says there are no under or overvalued securities.
After accounting for fees, taxes, and the overwhelming evidence that most alpha is illusory, the case for active management collapses.
William Sharpe's 1991 paper, The Arithmetic of Active Management, proved this mathematically decades ago: before costs, the average actively managed dollar must equal the market return before costs. After costs, the average active investor must underperform. It's not cynicism — it's just arithmetic.
The Alternative
The logical strategy isn't hunting for the next Warren Buffett. It's capturing betas — the various market returns — as cheaply and reliably as possible. Broad diversification across asset classes and geographies. Minimal costs through index funds or evidence-based systematic factor strategies. Factor exposure to size and value if appropriate, captured systematically rather than through active bets. No drama.
Aim for that bottom-left cluster on the scatter plot: near zero alpha, near zero volatility. That's not boring — it's rational and supported by the incredible conclusions from the Statistical Significance of Alpha chart.
You don't need to beat markets — you just need to capture their returns, which have averaged approximately an annualized return of 10% for almost 100 years now. Get wealth management advice from a reasonable priced good passive advisor, determine your risk capacity, invest, rebalance, tax loss harvest, minimize fund fees in factor funds, defer taxes and let time work.
Use the Calculator Going Forward
Any time you're pitched a "star" fund manager— by a broker, an advisor, or a glossy brochure — demand the data. To investigate the manager's skill, obtain the average annual alpha, the standard deviation of the alpha and the number of years in the track record.
Then open the t-stat calculator and run the test. If the result says you need more years than they have a track record of for a t-stat of 2, just walk away.
Don't accept stories. Don't accept three-year track records. Don't accept "our team is special" or "this time is different." Demand statistical evidence that clears the t-stat threshold of two. If they can't provide it — and they almost never can — you have your answer.
The Power Is In Your Hands
You now have a tool that cuts through marketing and hype. Three inputs, one calculator, a definitive answer. You can test whether any track record implies skill or luck in 30 seconds.
Once you see that the average winner needs 153 years of data, that spectacular one-year returns typically vanish, and that even Warren Buffett failed the test in his second act, you stop chasing mirages.
Here's what to do next:
● Bookmark the calculator: https://www.ifa.com/t-stat-calculator#tcalc2
● Test any fund you're considering before investing
● If the result says "30+ years," walk away
● Focus on capturing well documented market returns with at low fees and the broadest diversification
Investing isn't about finding heroes. It's about accepting what markets actually reward: patience, diversification, low costs, and discipline. The fund management industry has been selling you a story for decades — the myth of the star manager, the promise of market-beating returns, the allure of superior insight. Now you have a method and calculator to see through it.
The question was never whether skill exists. A tiny fraction of managers may possess genuine talent. The questions that matter are: Can you identify them in advance? Will they stay at the same fund long enough? Will their edge persist as assets grow? And will the fees leave enough alpha to justify the risk?
For nearly all investors, the answer to all four is no.
Markets are ruthlessly efficient at separating luck from skill — far more efficient than our pattern-seeking brains. Virtually all managers fail the two-sample significance of alpha test. Even one of the greatest investors alive failed the test in a second sample of time.
As Mark Hebner says in Step 3 of his award-winning book, Index Funds: The 12-Step Recovery Program for Active Investors, you're much better off avoiding active funds all together and trusting in the combined wisdom of millions of stock market investors around the world: "Trust the collective brain, buy the haystack, and maintain risk-appropriate exposures in low-cost globally diversified index portfolios."
Resources
Barras, L., Scaillet, O., & Wermers, R. (2010). False discoveries in mutual fund performance: Measuring luck in estimated alphas. Journal of Finance, 65(1), 179–216.
Carhart, M. M. (1997). On persistence in mutual fund performance. Journal of Finance, 52(1), 57–82.
Fama, E. F., & French, K. R. (2010). Luck versus skill in the cross-section of mutual fund returns. Journal of Finance, 65(5), 1915–1947.
Jensen, M. C. (1968). The performance of mutual funds in the period 1945–1964. Journal of Finance, 23(2), 389–416.
Sharpe, W. F. (1991). The arithmetic of active management. Financial Analysts Journal, 47(1), 7–9.
Taleb, N. N. (2001). Fooled by randomness: The hidden role of chance in life and in the markets. Random House.
ROBIN POWELL is the Creative Director at Index Fund Advisors (IFA). He is also a financial journalist and the Editor of The Evidence-Based Investor. This article reflects IFA's investment philosophy and is intended for informational purposes only.
DISCLOSURES:


 X
X