
 Risk Capacity
 Wealth Management
 Outsourced CIO
 Retirement Plans
 Institutional
 Financial
  Open an Account
 IFA App

 Articles
 Charts
 Investor Education ▾
 Fund
Fund
 Store
Store

 Taxes
Taxes Back-testing Disclosures
 Glossary
 Form CRS
Every trading day asks the same question: will markets rise or fall relative to the median? Our analysis of more than 6,600 S&P 500 trading days using a Markov Chain model — methodology available upon request — finds that the odds of tomorrow being "Up" or "Down" have historically hovered near 50/50, regardless of the prior period's result. In this data set, the market has shown no exploitable memory: no pattern in past returns has reliably predicted what comes next. That is a central reason market timing is so difficult to execute successfully, and why staying invested has historically rewarded patient investors.
The reason is not mysterious; it is structural. As Eugene Fama laid out in his landmark 1970 paper on efficient markets, prices in a well-functioning market already reflect all available information.² The moment new news arrives, it is absorbed almost instantly into the price — which means the past has already been embedded in today's price, and yesterday's move offers no exploitable clue about tomorrow's. That is the academic root of the market's short memory, and the reason no amount of chart-reading changes the odds.
The Cost of Guessing Wrong
Market timing is exceptionally difficult to execute successfully — not because investors are unintelligent, but because the odds are stacked against anyone who attempts it. To succeed consistently, a market timer must be right twice: once getting out, and again getting back in, and must repeat that feat over decades. Missing just a handful of the market's best days, which often cluster right after its worst ones, has historically cut portfolios' long-term returns more than sitting through every downturn would have. Fear sells the exit; euphoria sells the re-entry. Both are emotional decisions dressed up as strategy, and both tend to arrive at exactly the wrong moment. Some investors attempt tactical adjustments or risk-management overlays in response to changing conditions; the evidence on whether such approaches add value over long periods is mixed, and any strategy should be weighed against an investor's own goals, time horizon, and risk capacity.
A Century of Compounding
The data make the case starkly. Since 1926 — nearly a century of market history — the S&P 500 has delivered an average annual total return of about 10%, according to Dimensional Fund Advisors' long-term study of calendar-year returns.¹ That number was never earned in a straight line. It was earned through wars, inflation shocks, recessions, and crashes, by investors who simply stayed put while the market did what markets do: recover and then compound further. Anyone who jumped in and out along the way, chasing a certainty that never existed, almost certainly earned less.
The arithmetic of staying put is worth seeing in full. A hypothetical $100 invested at a constant 10% annual return — with every dividend reinvested and not a single dollar withdrawn — would grow to $1,378,061 over 100 years. This is a hypothetical, illustrative calculation only, not an actual or projected investment result. It excludes fees, taxes, and inflation; no real portfolio compounds at a perfectly constant rate; and actual investor experience will differ, potentially substantially. Returns are never guaranteed and may be significantly lower than this example. Still, the arithmetic shows why the decades matter more than the days, and why an interrupted compounding stream can never reach the same destination.
You can calculate the future value (FV) of an investment using this formula, where P is the initial investment ($100), r is the annual rate of return (0.10), and t is the number of years (100): FV = P(1 r)t. So, FV = $100 (1.10)100 = $1,378,061.
This is where the Rule of 72 becomes more than arithmetic — it becomes an argument for patience. At a 10% return, an investment doubles roughly every seven years. Break that compounding even once with a poorly timed exit, and the clock doesn't pause — it resets. The century of data doesn't reward the investor who guessed correctly; it rewards the one who never had to guess at all.
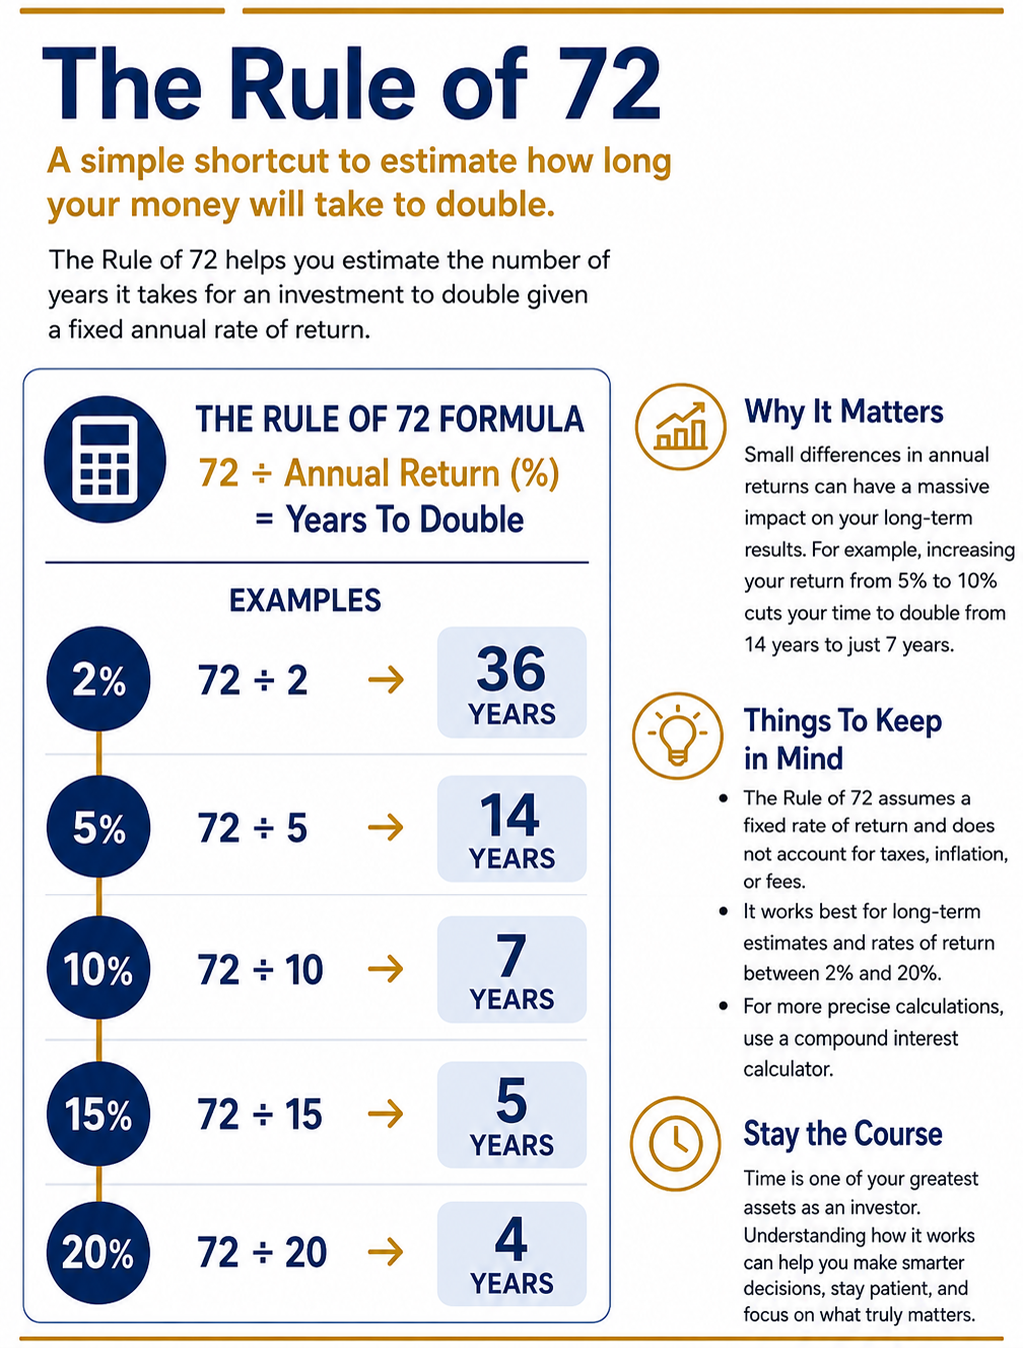
Illustrative only. Markets do not deliver consistent annual returns, and the Rule of 72 assumes a fixed rate that does not exist in practice.
Match your portfolio to your risk capacity, then let time — not timing — do the work. This is a general principle, not personalized advice; individual circumstances vary, and any investor should consult a qualified financial professional before making investment decisions.
To talk through how this applies to your own plan, reach out to an IFA Wealth Advisor.
Sources: ¹ Dimensional Fund Advisors, "The Uncommon Average: Long-Term Context on Annual Returns," dimensional.com/us-en/insights/the-uncommon-average. S&P 500 calendar-year returns, 1926–present. ² Fama, Eugene F. "Efficient Capital Markets: A Review of Theory and Empirical Work." The Journal of Finance, Vol. 25, No. 2 (May 1970): 383–417.
Disclosure: This article is for educational purposes only and is not intended as investment advice. References to historical market behavior and statistical models are illustrative and do not guarantee future results. All investing involves risk, including the potential loss of principal. Past performance is not indicative of future performance. No investment strategy, including diversification and asset allocation, can guarantee a profit or protect against loss in declining markets. Diversification does not ensure a profit or protect against loss.
















 Home
Home 888-643-3133
 Contact Us
 Newsletter Subscribe
 eMoney
 IFA Apps
 Index Funds Book on Kindle
 Index Funds Audiobook
 Careers
 Facebook
 X
X LinkedIn
 Instagram
 Youtube
 Terms
Terms Index Descriptions