As index funds' popularity rises, so do pressures on active managers to limit costs without sacrificing revenue growth. A prime way to accomplish such a financial feat: Buy rival shops and consolidate disparate operations by centralizing functions relating to fund administration, marketing and technology.
In recent years "the rise of passive indexing has put pressure on management fees, while technology has accelerated change in the sector," reports the Financial Times. Citing statistics compiled by funds researcher Refinitiv, the paper adds: "Traditional asset managers have raced to build scale as well as diversify offerings through M&A (mergers and acquisitions.)"1
Against such a backdrop comes the emergence of Victory Capital. For years it operated as KeyCorp's asset management arm. In 2013, an employee-led buyout from the bank formed an independent funds company, Victory Capital Management.
In 2018, it went public and listed on the Nasdaq stock exchange under the symbol VCTR. As part of its IPO disclosures, Victory Capital listed Crestview Partners and another private equity player, Reverence Capital, owning a combined 69% of the company. The remaining 31% stake was held by directors and employees, according to Victory Capital's Form S1 filing with the Securities and Exchange Commission. 2
As a public company, Victory Capital has taken deal-making seriously. A central part of its growth strategy is gobbling up established fund shops such as Munder, Sycamore, Compass, Newbridge, RS Investments, WestEnd and New Energy. But its biggest splash in M&A activity came in 2019 when it bought the asset management unit of the United Services Automobile Association (USAA).
In order to take over the fund family of one of America's largest insurance carries, Victory Capital reportedly had to pay a guaranteed $850 million. Such a lofty pricetag made the merger one of the largest in M&A history for fund providers. It also marked the 12th acquisition by Victory Capital since going public. By early 2023, its assets under management were more than $161 billion and Fortune magazine had named it as one of America's fastest growing companies.
The pitch by Victory Capital to potential buyout targets is rather straightforward: Let us handle the paperwork and backoffice tasks and we'll let you focus on investment management. On the company's website David Brown, its CEO, has described his aggregator firm as "an innovative, next generation business model that aims to put investment excellence first and deliver real solutions in all market environments."
Given such rapid growth in recent years, an objective investor might ask: Has Victory Capital's family of actively managed mutual funds lived up to its promise?
For years, we've been digging into the historical performances of fund families through our Deeper Look research series. In this installment, we'll put under our microscope the active mutual fund strategies run under the auspices of Victory Capital.
Controlling for Survivorship Bias
It's important for investors to understand the idea of survivorship bias. While there are 80 active mutual funds that are currently offered through Victory Capital, these aren't necessarily the only strategies this company has ever managed. In fact, there are ten mutual funds that no longer exist. This can be for a variety of reasons including poor performance or the fact that they were merged with another fund. We will show what their aggregate performance looks like shortly.
Fees & Expenses
Let's first examine the costs associated with Victory Capital's surviving 80 strategies. It should go without saying that if investors are paying a premium for investment "expertise," then they should be receiving above average results consistently over time. The alternative would be to simply accept a market's return, less a significantly lower fee, via an index fund.
The costs we examine include expense ratios, sales loads — front-end (A), back-end (B) and level (C) — as well as 12b-1 fees. These are considered the "hard" costs that investors incur. Prospectuses, however, do not reflect the trading costs associated with mutual funds.
Commissions and market impact costs are real expenses associated with implementing a particular investment strategy and can vary depending on the frequency and size of the trades executed by portfolio managers.
We can estimate the costs associated with an investment strategy by looking at its annual turnover ratio. For example, a turnover ratio of 100% means that the portfolio manager turns over the entire portfolio in one year. This is considered an active approach and investors holding these funds in taxable accounts will likely incur a higher exposure to tax liabilities, such as short- and long-term capital gains distributions, than those incurred by passively managed funds.
The table below details the hard costs as well as the turnover ratio for all 80 surviving active funds offered through Victory Capital that have at least five years of complete performance history. You can search this page for a symbol or name by using Control F in Windows or Command F on a Mac. Then click the link to see the Alpha Chart. Also, remember that this is what is considered an in-sample test; the next level of analysis is to do an out-of-sample test (for more information see here).
| Fund Name | Ticker | Turnover Ratio % | Prospectus Net Expense Ratio | 12b-1 Fee | Max Front Load | Global Broad Category Group | Global Category |
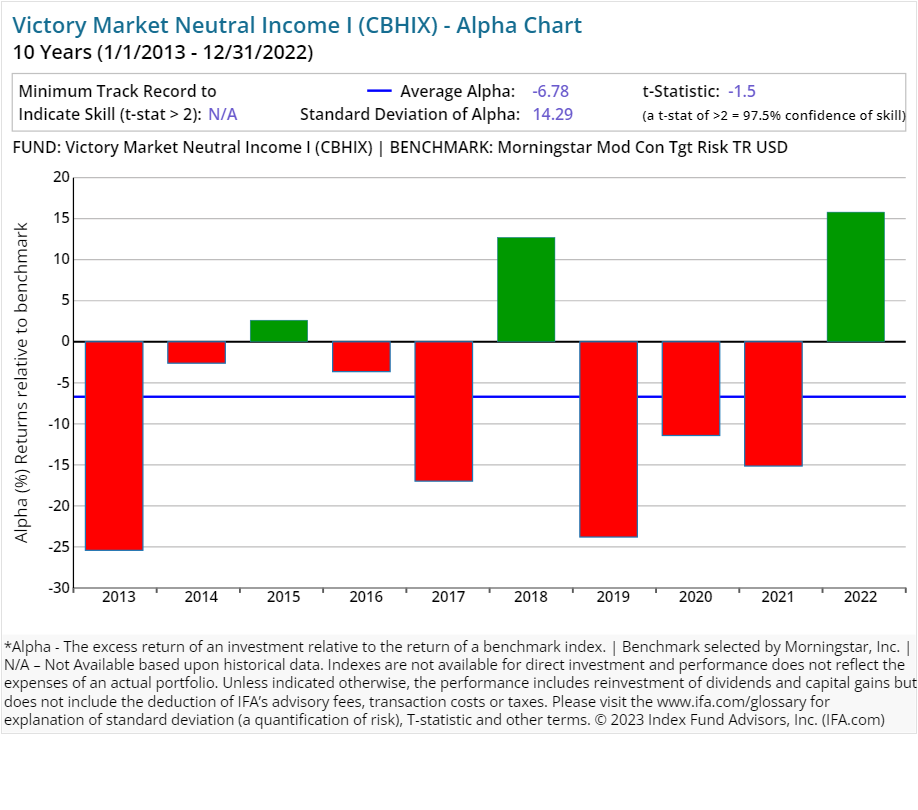
| Victory Market Neutral Income I | CBHIX | 88.00 | 0.41 | 0.00 | Alternative | Market Neutral | |
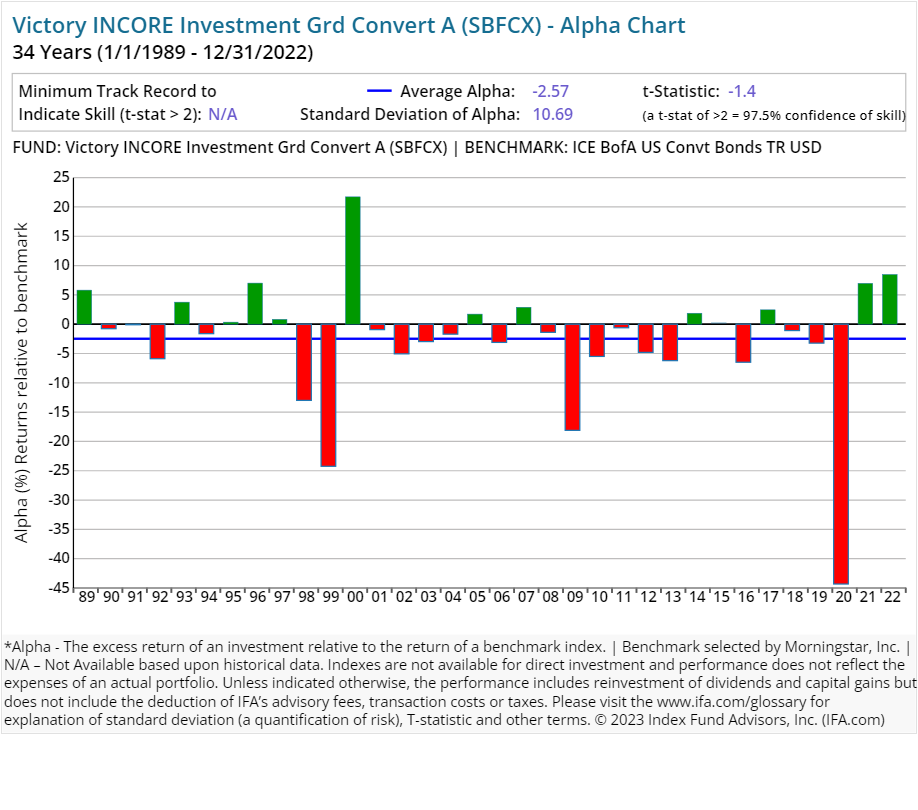
| Victory Investment Grd Convert A | SBFCX | 36.00 | 1.25 | 0.25 | 2.25 | Convertibles | Convertibles |
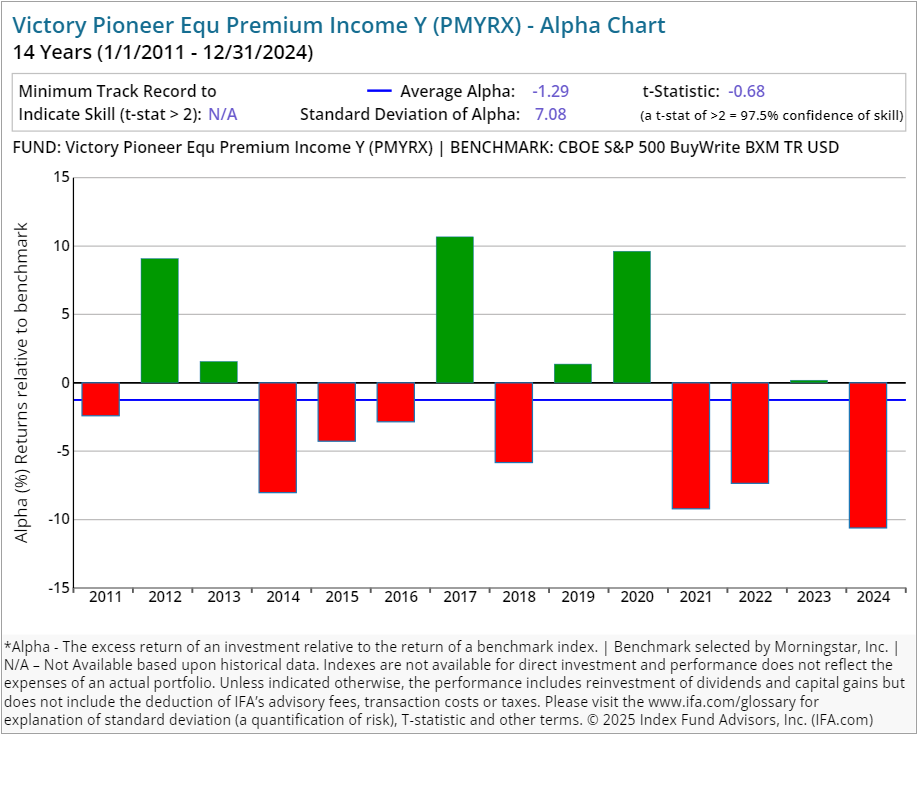
| Victory Pioneer Equ Premium Income Y | PMYRX | 114.00 | 0.90 | 0.00 | Equity | Alternative Miscellaneous | |
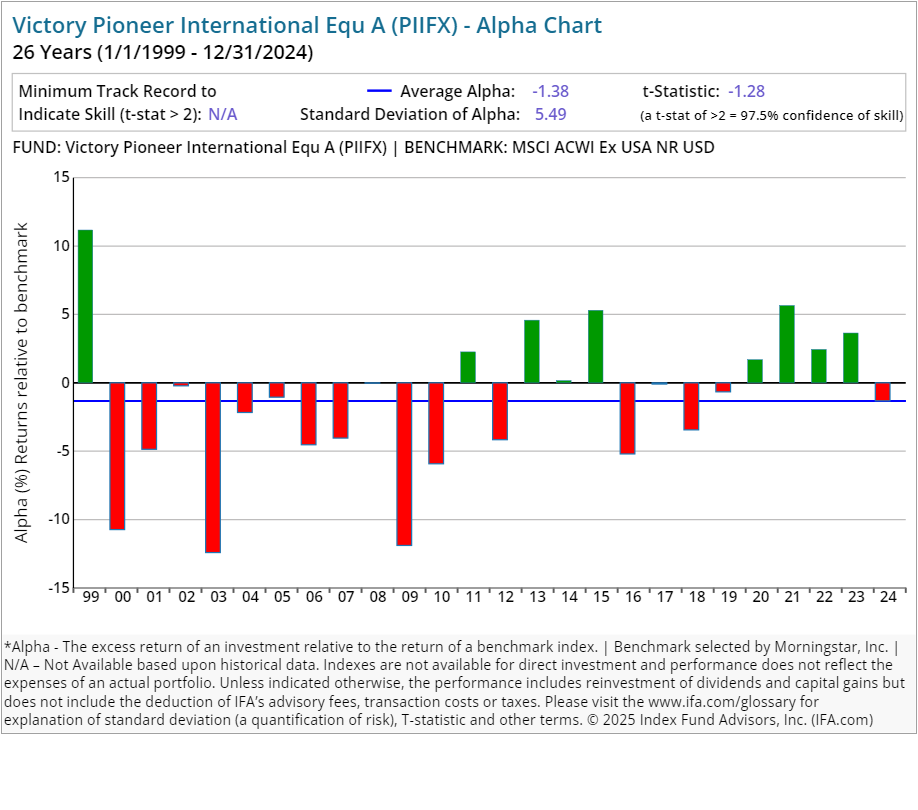
| Victory Pioneer International Equ A | PIIFX | 37.00 | 1.16 | 0.25 | 5.75 | Equity | Global Equity Large Cap |
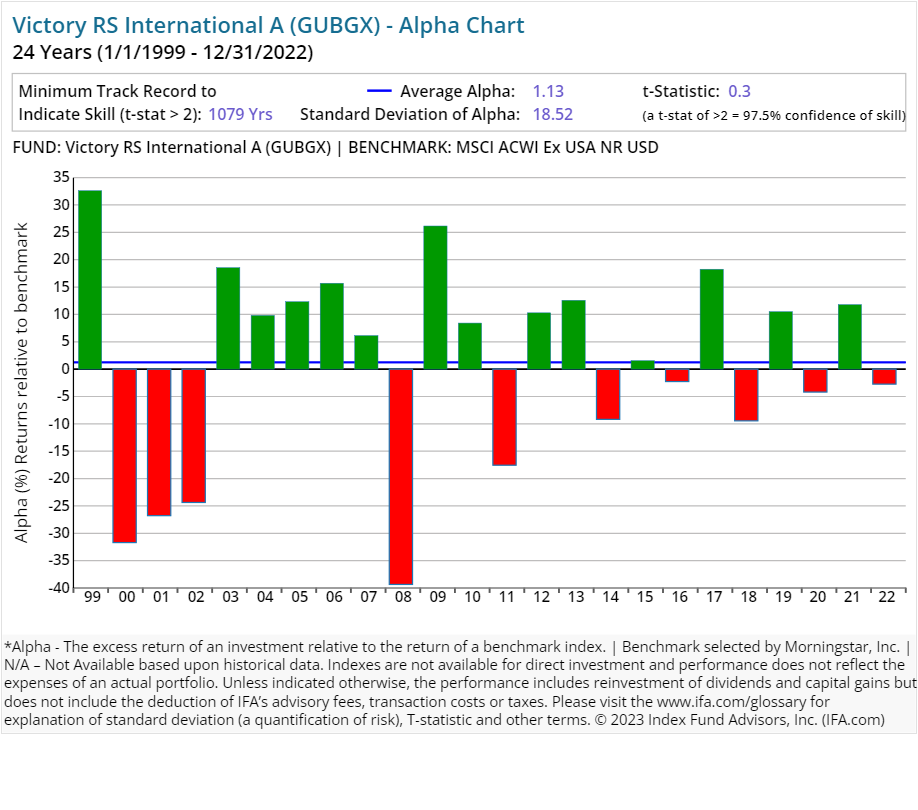
| Victory RS International A | GUBGX | 19.00 | 1.13 | 0.25 | 5.75 | Equity | Global Equity Large Cap |
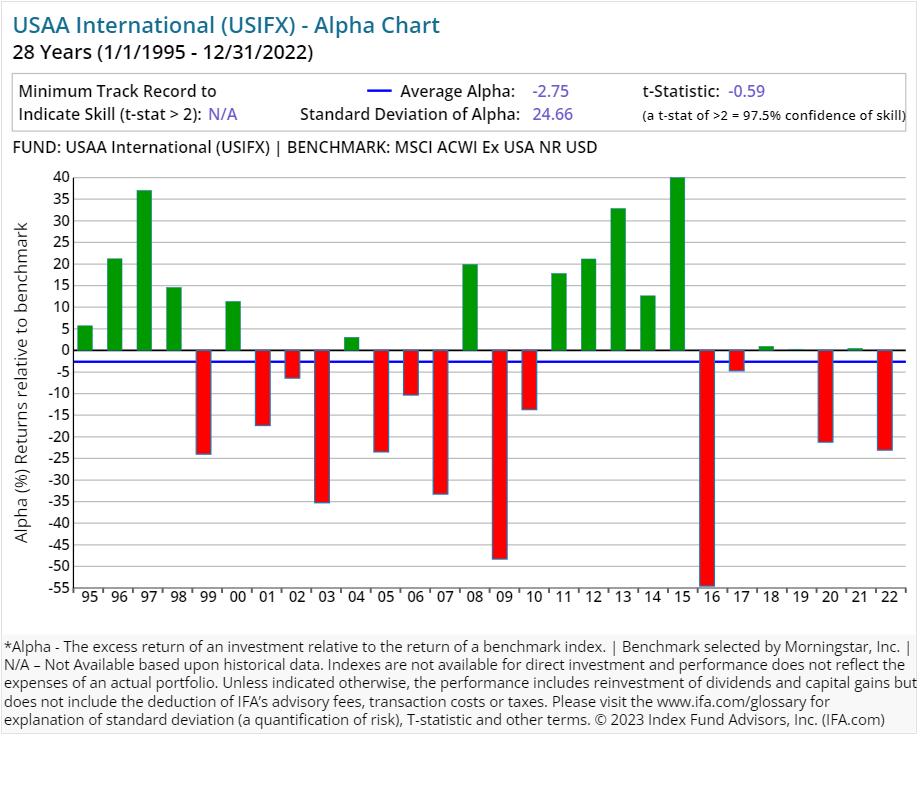
| Victory International | USIFX | 42.00 | 1.06 | Equity | Global Equity Large Cap | ||
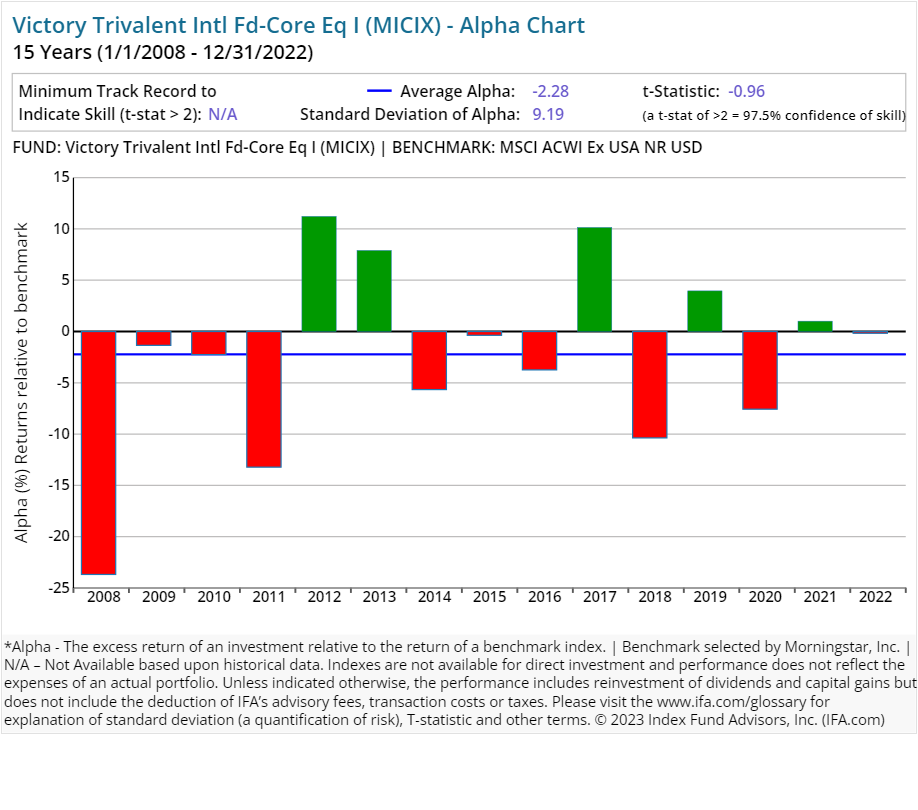
| Victory Trivalent Intl Fd-Core Eq I | MICIX | 38.00 | 0.60 | 0.00 | Equity | Global Equity Large Cap | |
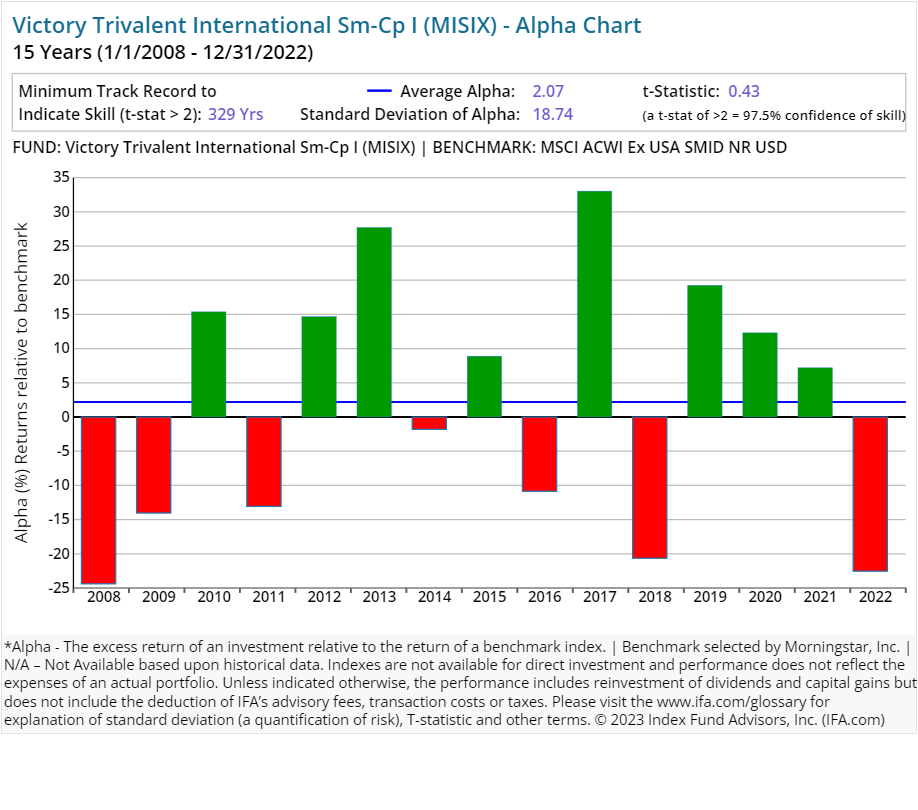
| Victory Trivalent International Sm-Cp I | MISIX | 45.00 | 0.97 | 0.00 | Equity | Global Equity Mid/Small Cap | |
| Victory Global Managed Volatility Instl | UGOFX | 37.00 | 0.70 | 0.00 | Equity | Global Equity Large Cap | |
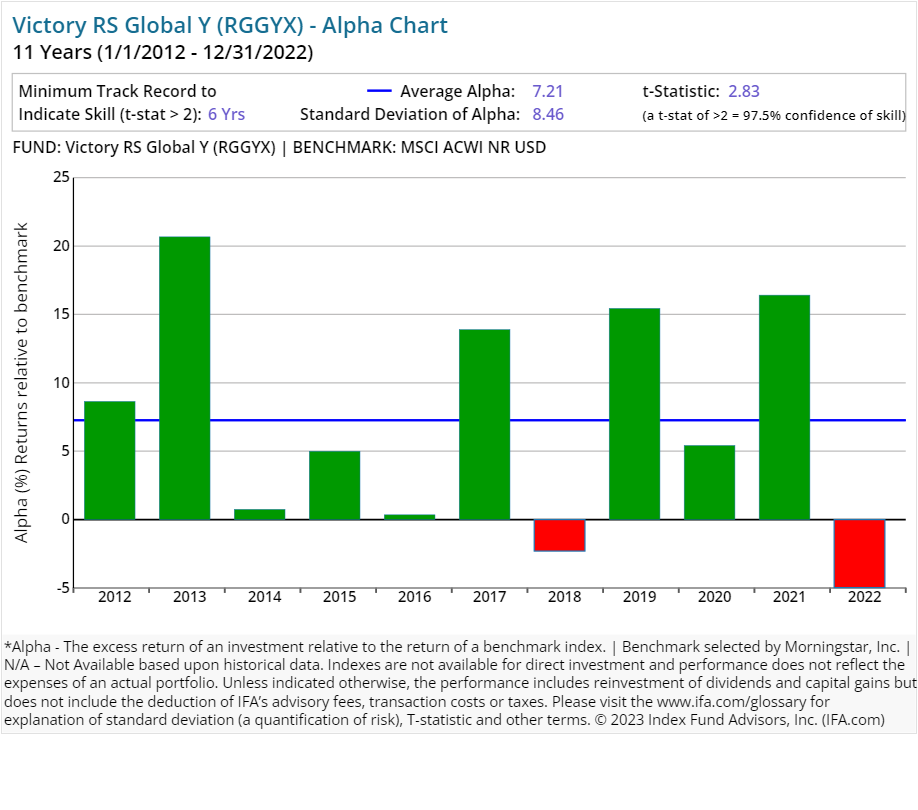
| Victory RS Global Y | RGGYX | 20.00 | 0.60 | 0.00 | Equity | Global Equity Large Cap | |
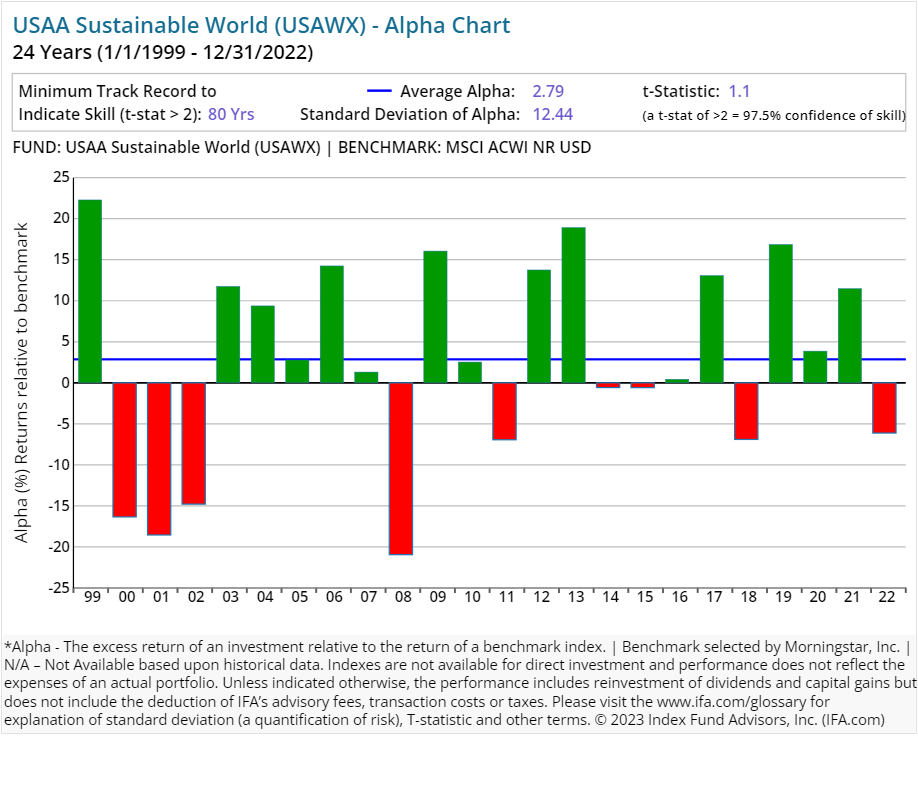
| Victory Sustainable World | USAWX | 32.00 | 1.07 | Equity | Global Equity Large Cap | ||
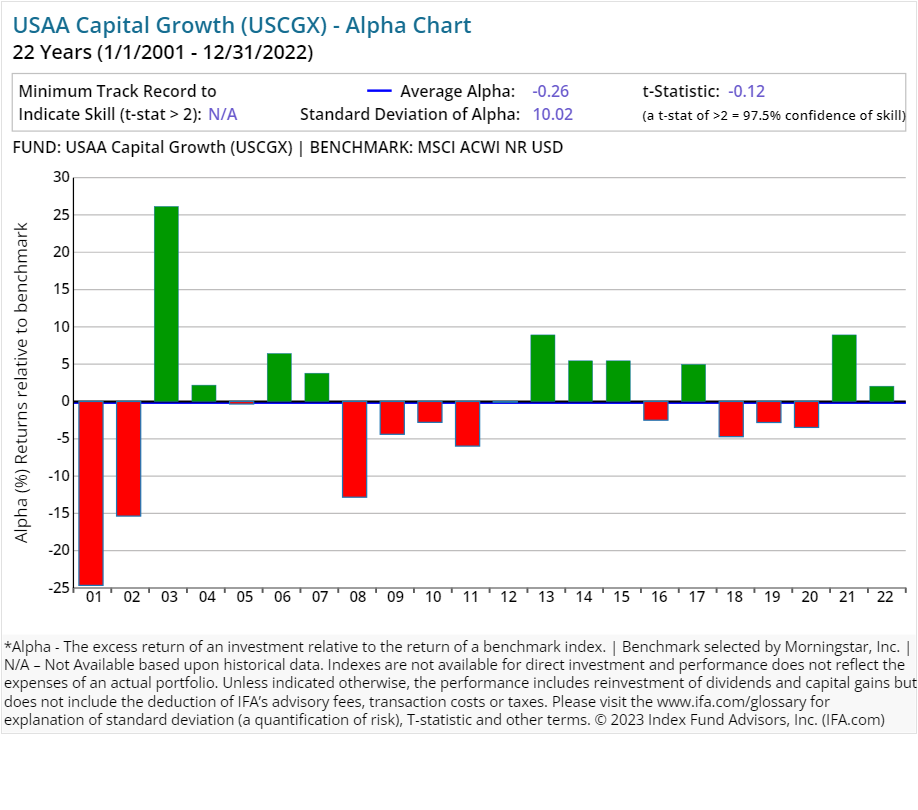
| Victory Capital Growth | USCGX | 57.00 | 1.09 | Equity | Global Equity Large Cap | ||
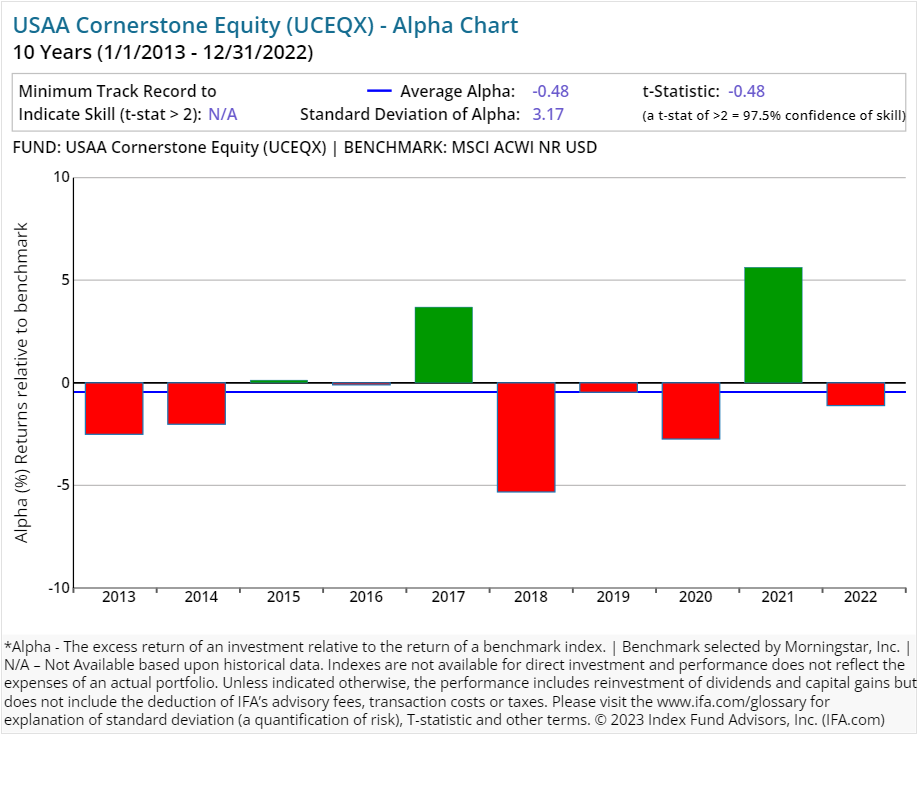
| Victory Cornerstone Equity | UCEQX | 11.00 | 0.59 | 0.00 | Equity | Global Equity Large Cap | |
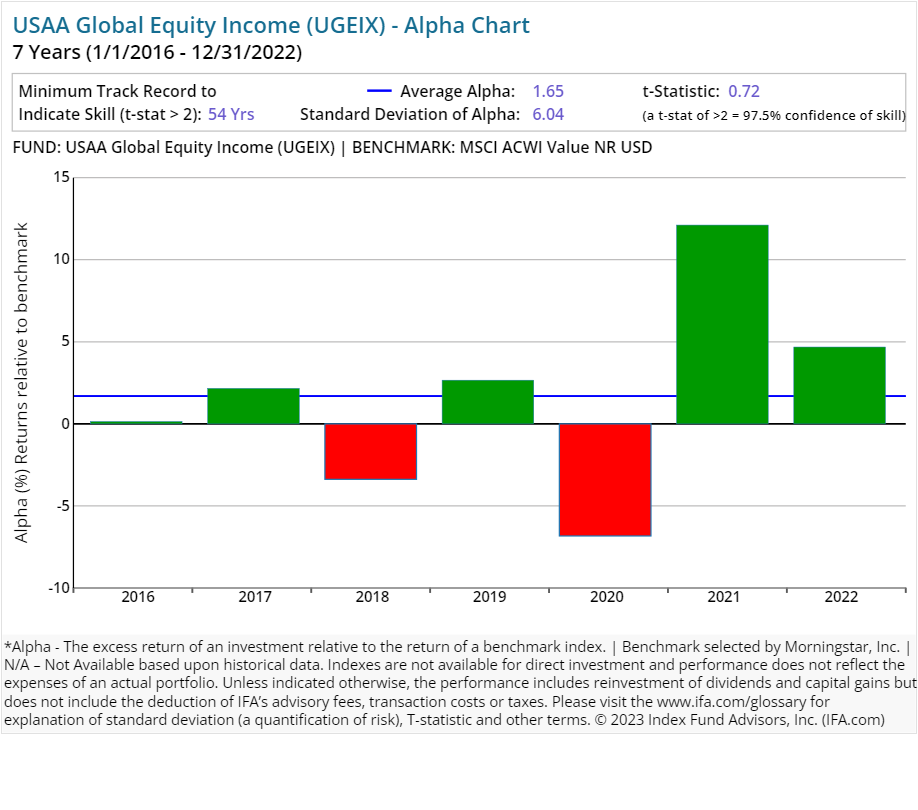
| Victory Global Equity Income | UGEIX | 83.00 | 1.03 | 0.00 | Equity | Global Equity Large Cap | |
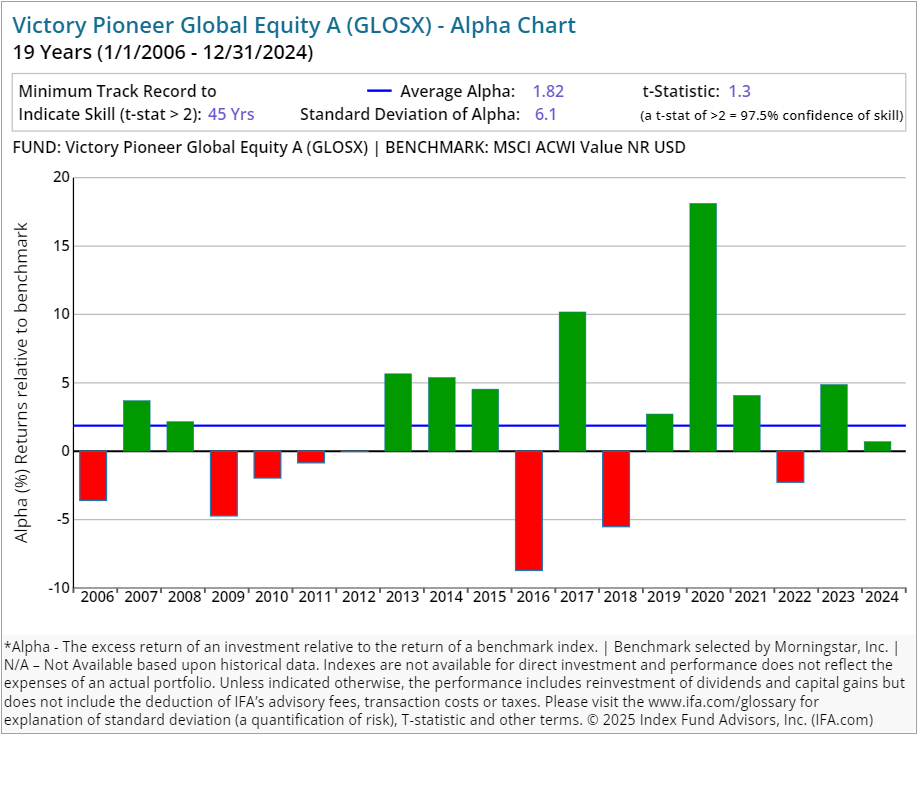
| Victory Pioneer Global Equity A | GLOSX | 52.00 | 1.10 | 0.25 | 5.75 | Equity | Global Equity Large Cap |
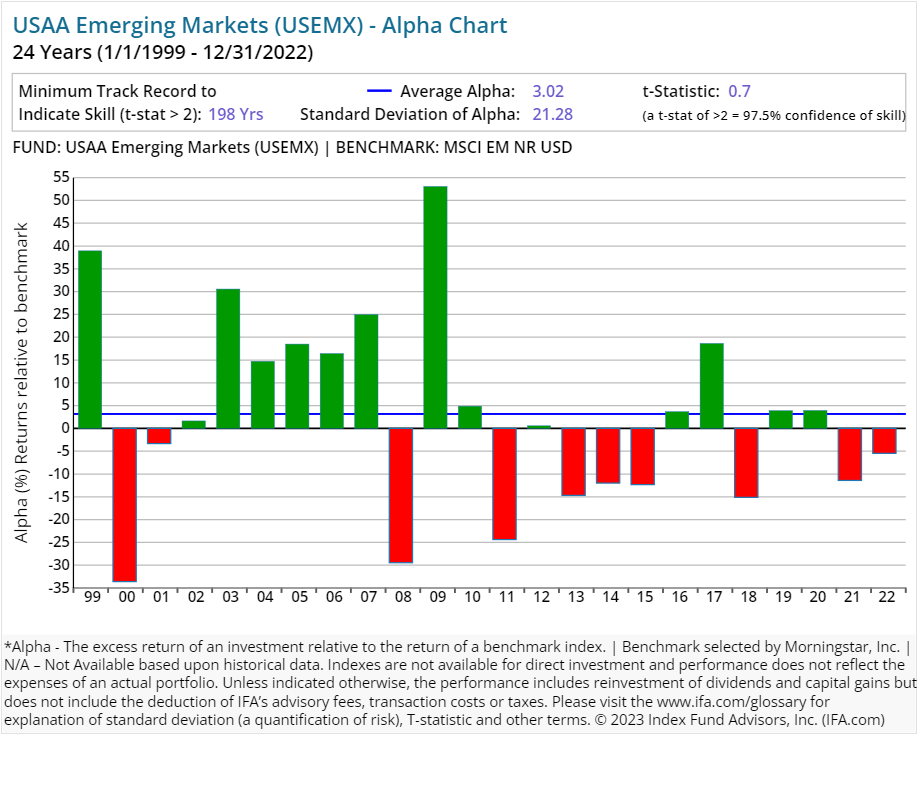
| Victory Emerging Markets | USEMX | 74.00 | 1.52 | 0.00 | Equity | Global Emerging Markets Equity | |
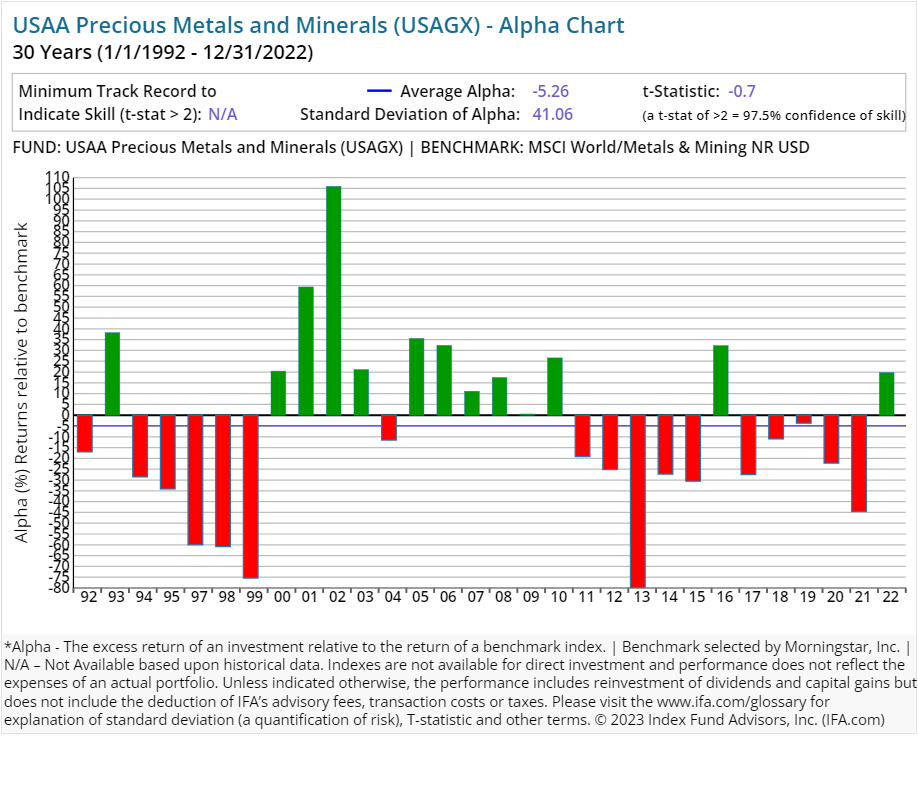
| Victory Precious Metals and Minerals | USAGX | 1.00 | 1.14 | Equity | Precious Metals Sector Equity | ||
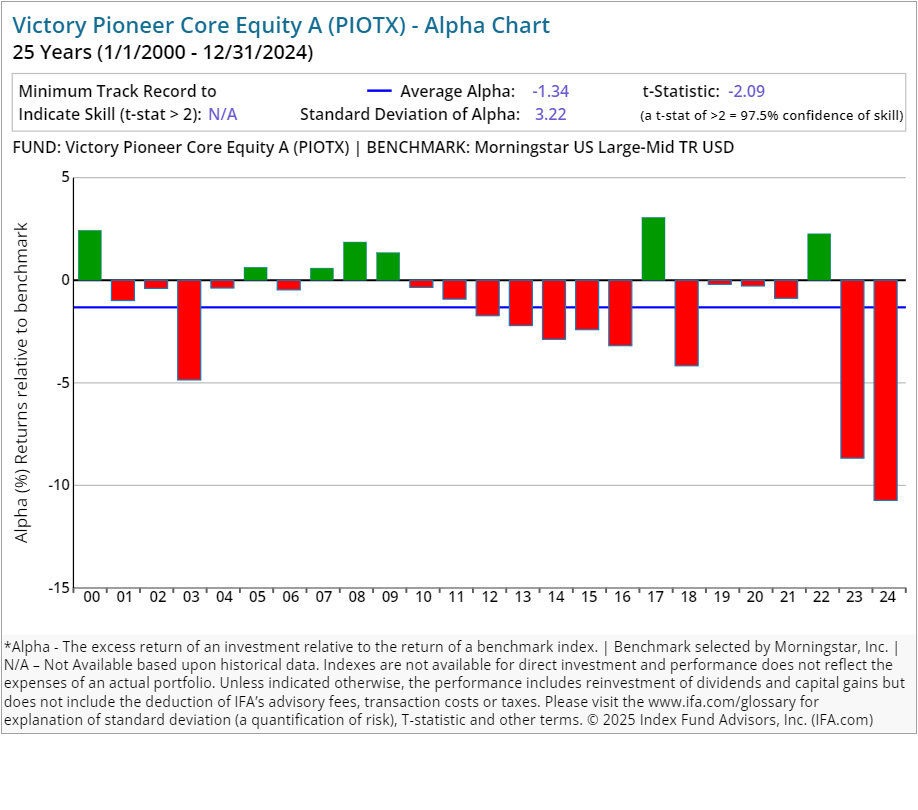
| Victory Pioneer Core Equity A | PIOTX | 54.00 | 0.86 | 0.25 | 5.75 | Equity | US Equity Large Cap Blend |
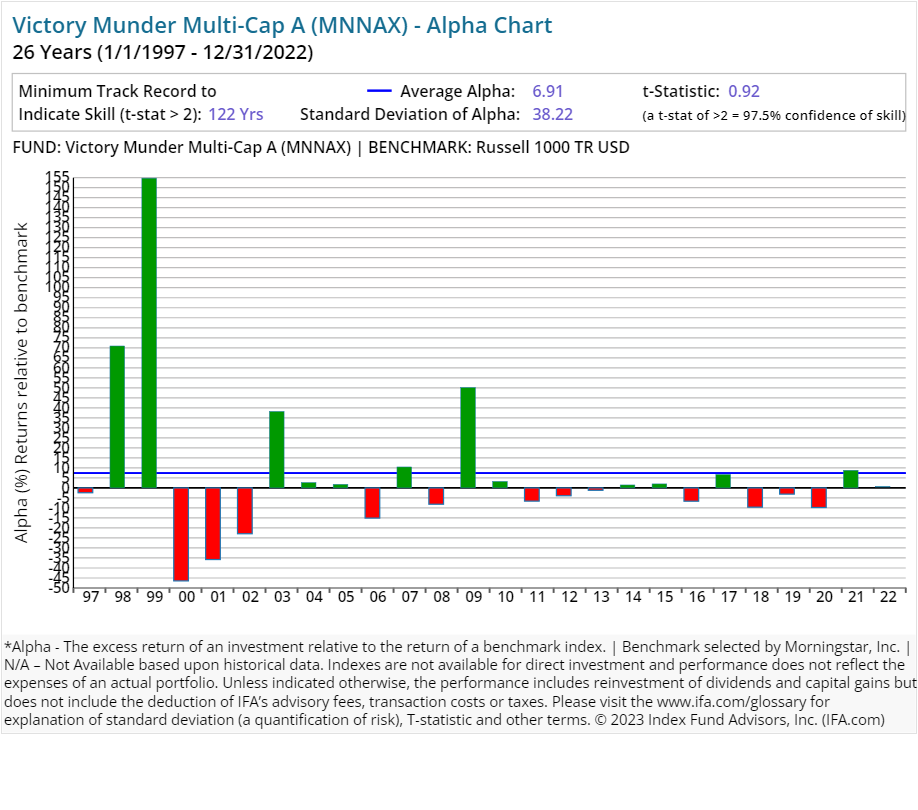
| Victory Munder Multi-Cap A | MNNAX | 75.00 | 1.26 | 0.25 | 5.75 | Equity | US Equity Large Cap Blend |
| Victory Diversified Stock A | SRVEX | 81.00 | 1.07 | 0.25 | 5.75 | Equity | US Equity Large Cap Blend |
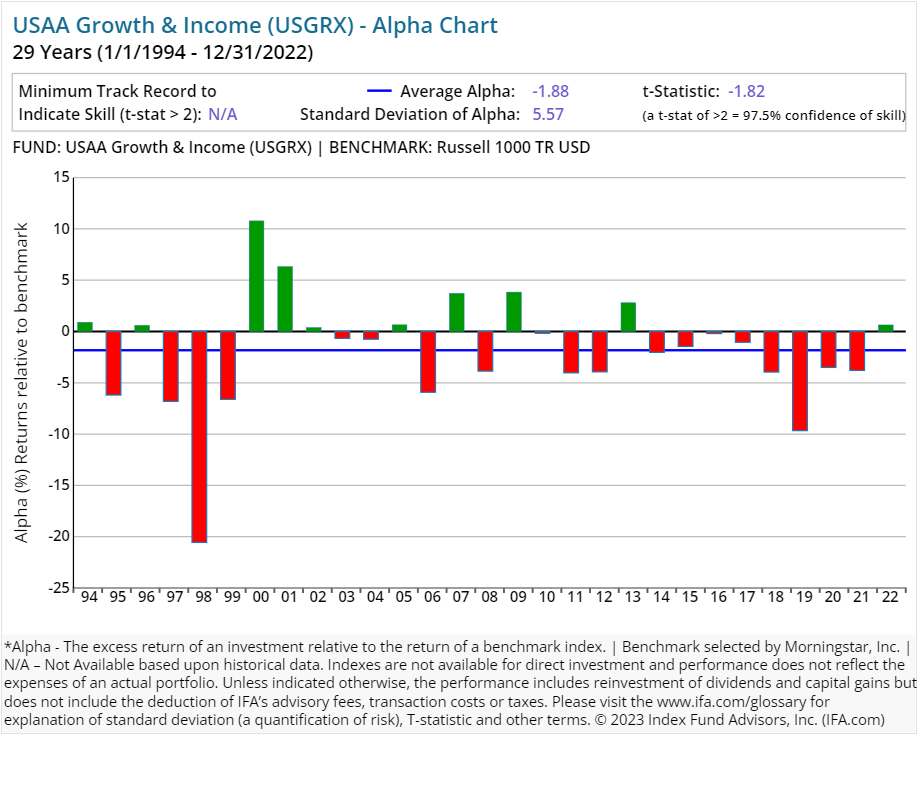
| Victory Growth & Income | USGRX | 61.00 | 0.86 | 0.00 | Equity | US Equity Large Cap Blend | |
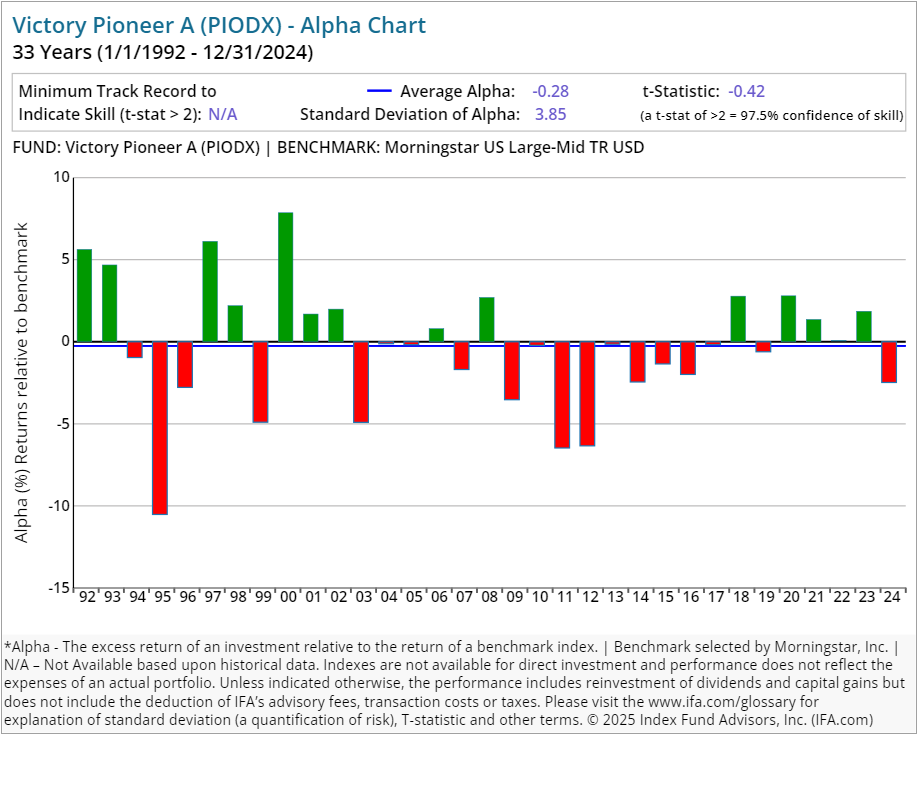
| Victory Pioneer A | PIODX | 64.00 | 0.92 | 0.25 | 5.75 | Equity | US Equity Large Cap Blend |
| Victory RS Investors A | RSINX | 74.00 | 1.33 | 0.25 | 5.75 | Equity | US Equity Mid Cap |
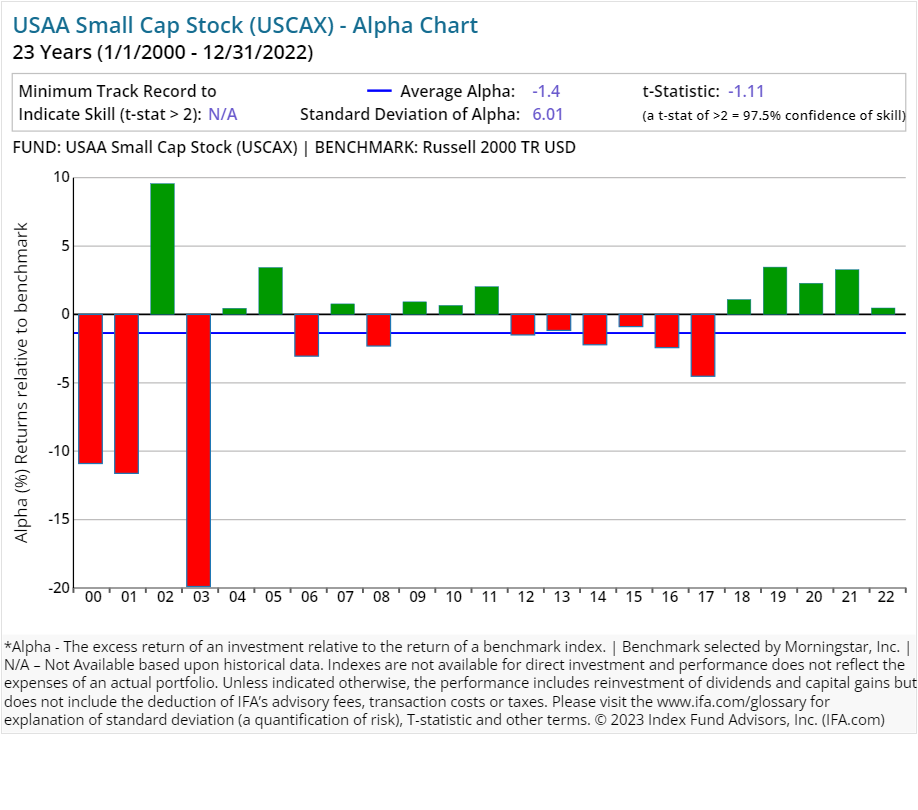
| Victory Small Cap Stock | USCAX | 62.00 | 1.01 | 0.00 | Equity | US Equity Small Cap | |
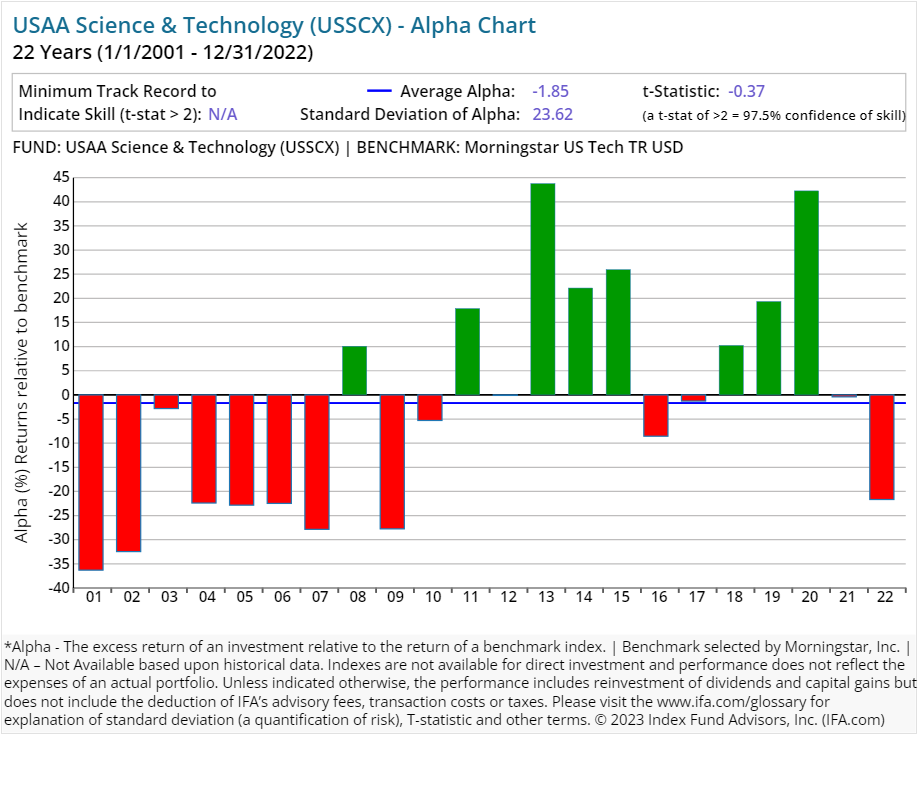
| Victory Science & Technology | USSCX | 75.00 | 0.96 | 0.00 | Equity | Technology Sector Equity | |
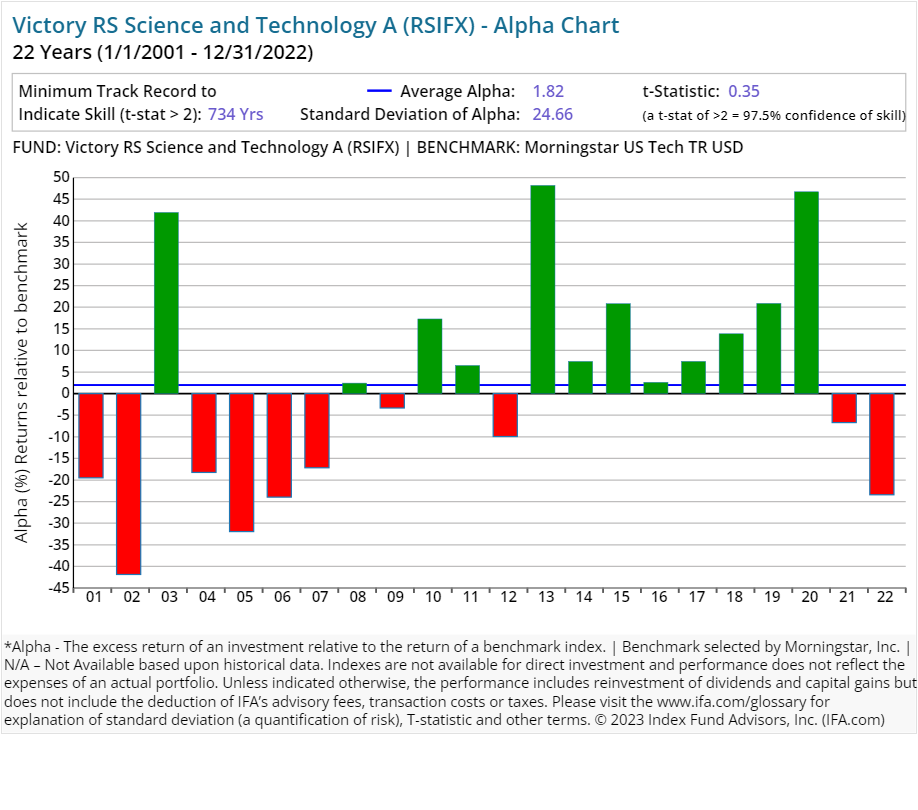
| Victory RS Science and Technology A | RSIFX | 39.00 | 1.48 | 0.25 | 5.75 | Equity | Technology Sector Equity |
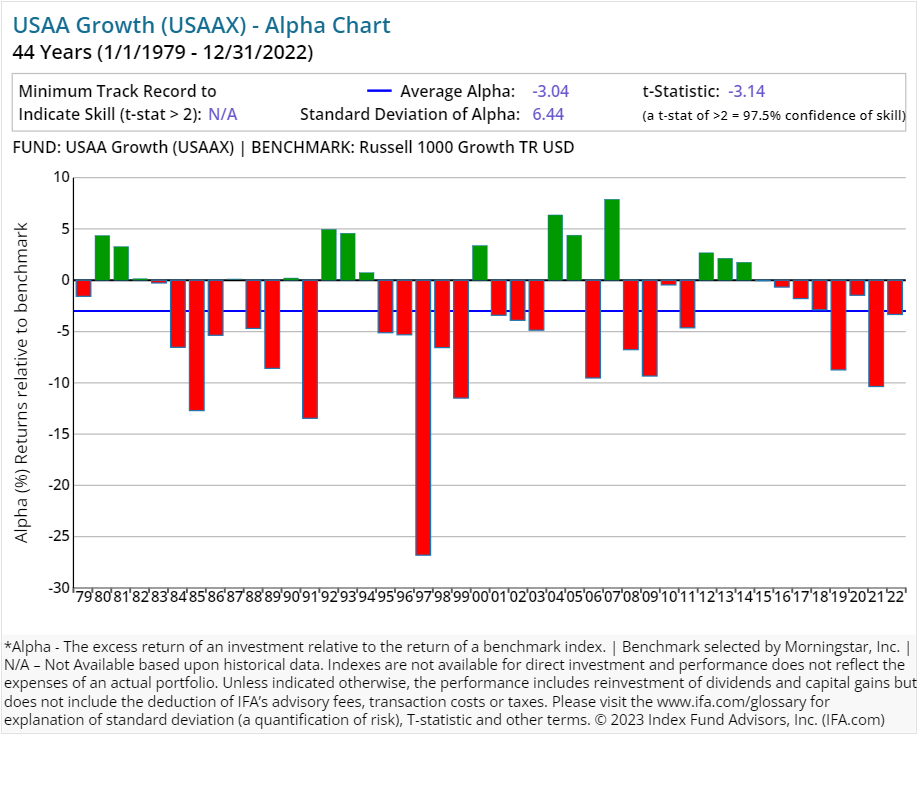
| Victory Growth | USAAX | 22.00 | 0.89 | 0.00 | Equity | US Equity Large Cap Growth | |
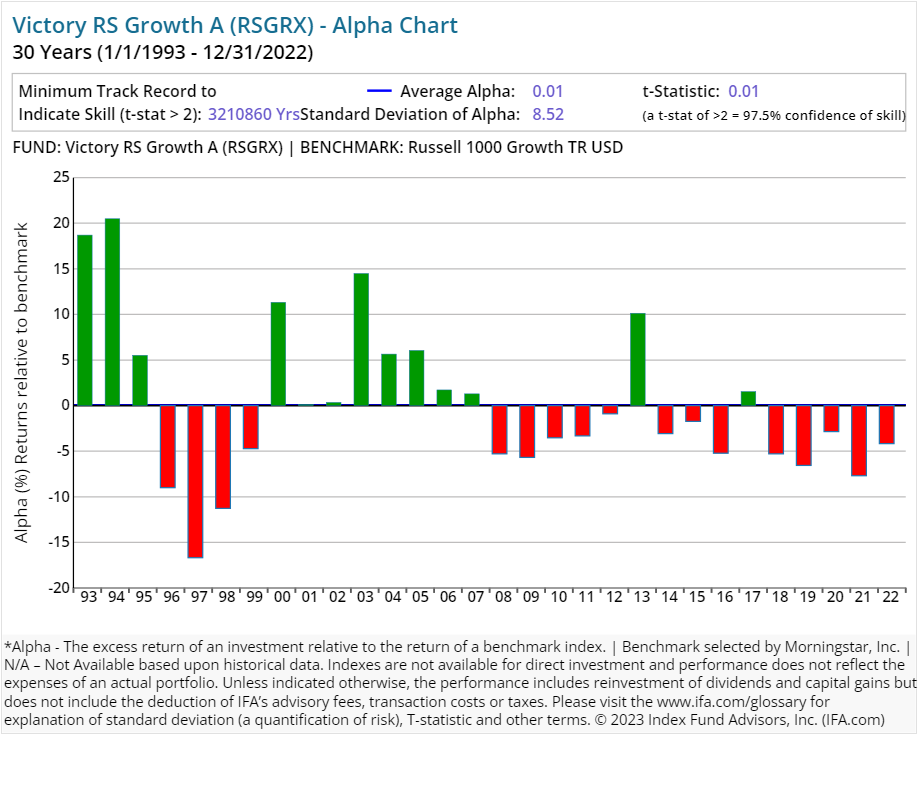
| Victory RS Growth A | RSGRX | 50.00 | 1.10 | 0.25 | 5.75 | Equity | US Equity Large Cap Growth |
| Victory Aggressive Growth | USAUX | 30.00 | 0.64 | 0.00 | Equity | US Equity Large Cap Growth | |
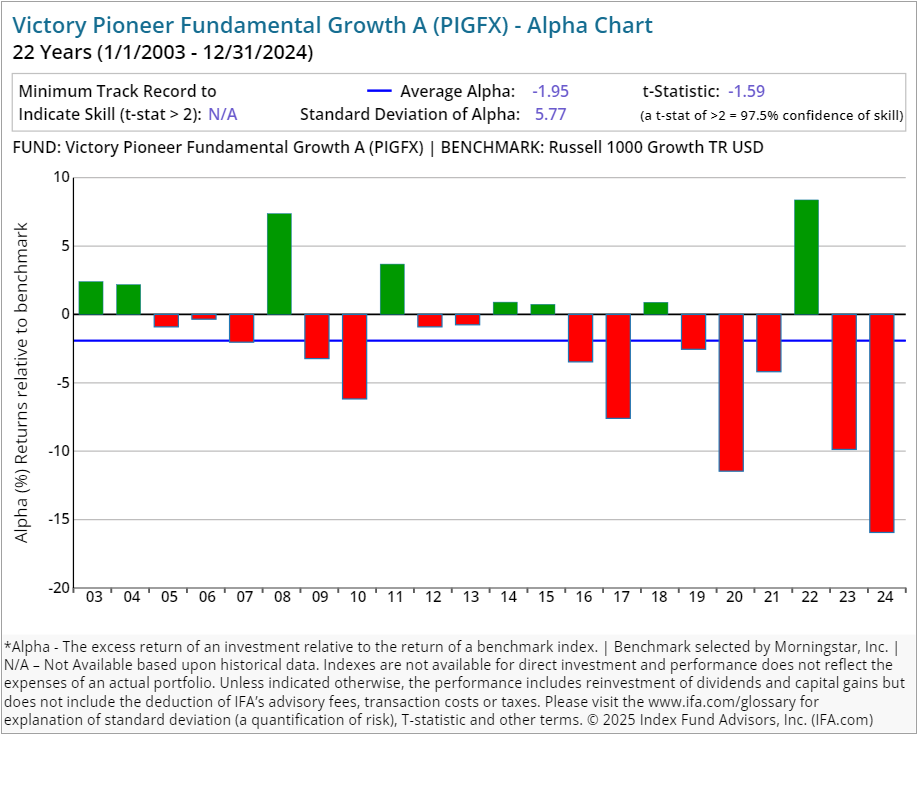
| Victory Pioneer Fundamental Growth A | PIGFX | 26.00 | 0.99 | 0.25 | 5.75 | Equity | US Equity Large Cap Growth |
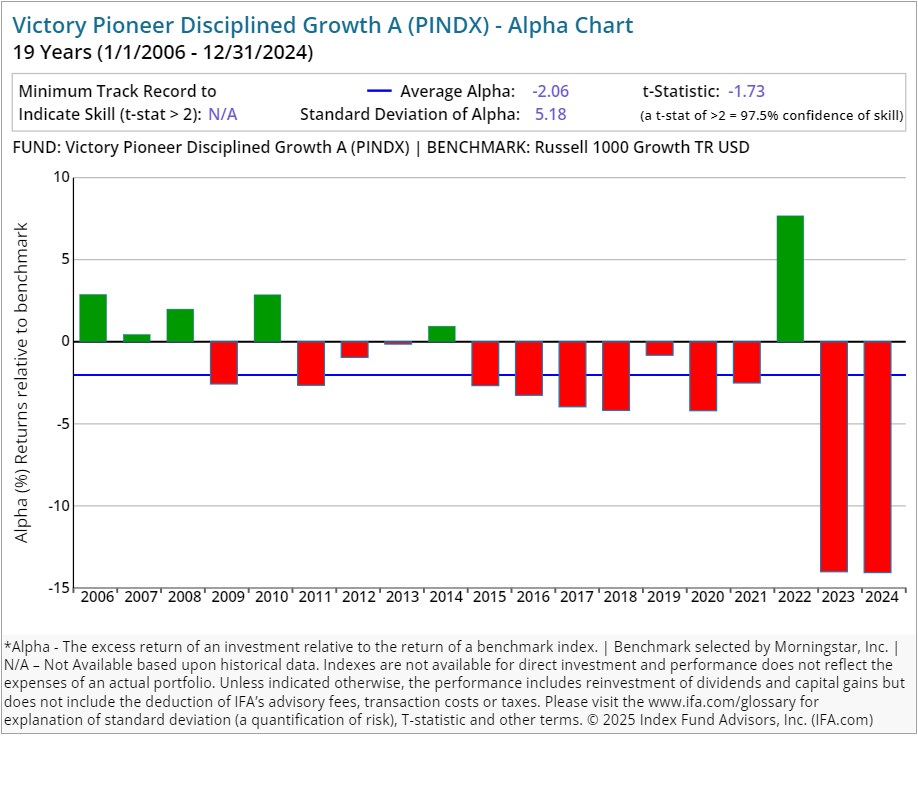
| Victory Pioneer Disciplined Growth A | PINDX | 84.00 | 0.98 | 0.25 | 5.75 | Equity | US Equity Large Cap Growth |
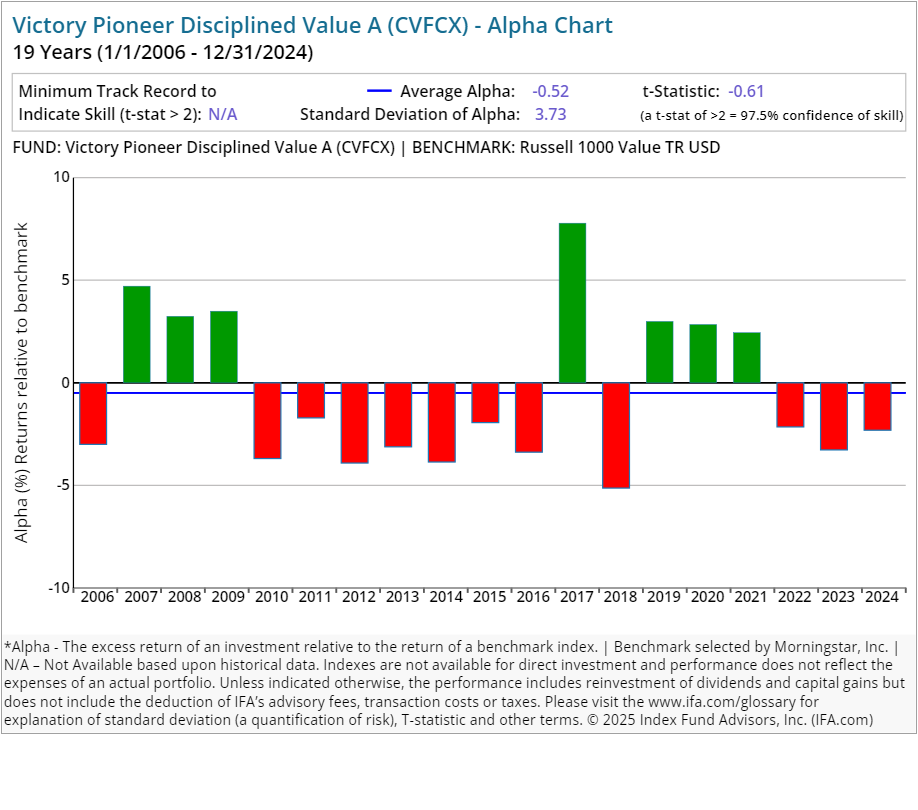
| Victory Pioneer Disciplined Value A | CVFCX | 111.00 | 0.80 | 0.25 | 5.75 | Equity | US Equity Large Cap Value |
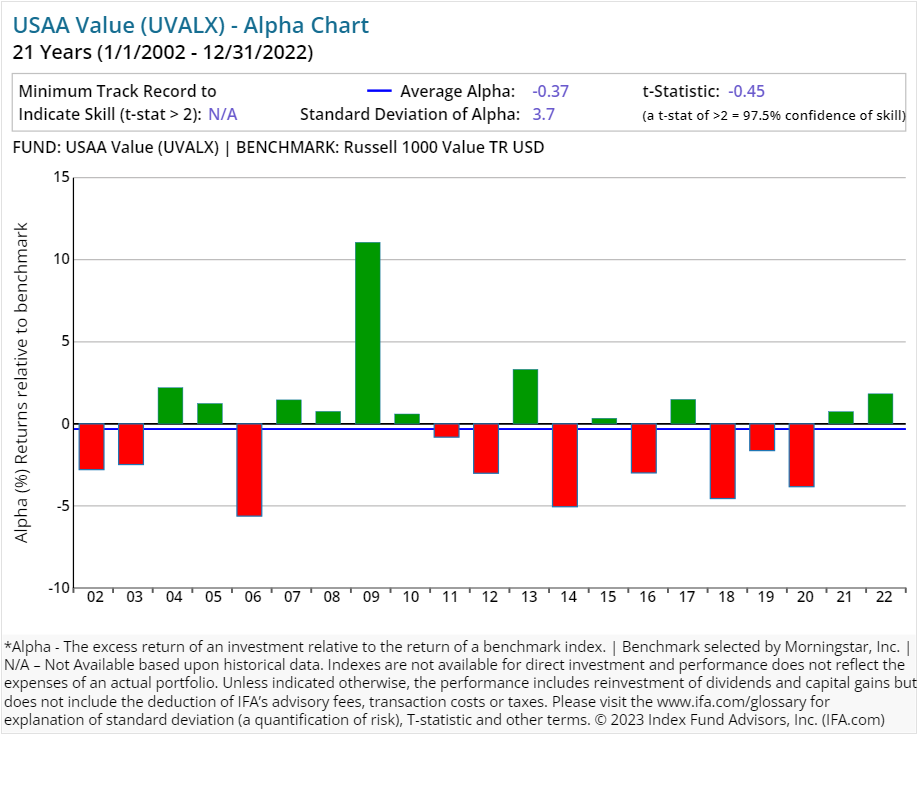
| Victory Value | UVALX | 42.00 | 0.95 | 0.00 | Equity | US Equity Large Cap Value | |
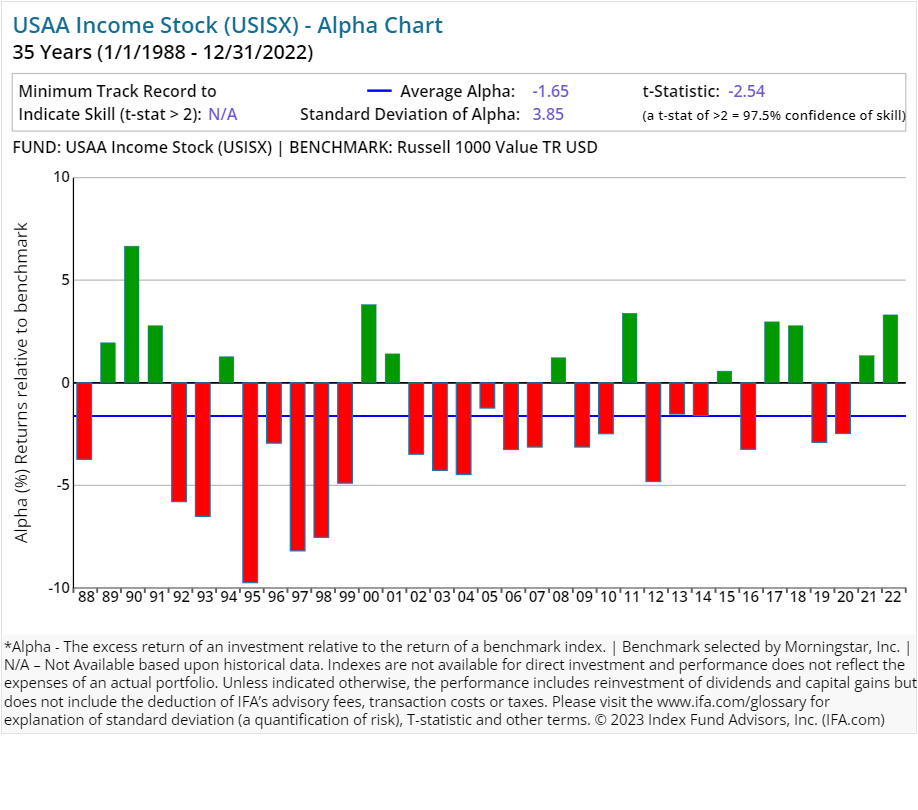
| Victory Income Stock | USISX | 58.00 | 0.75 | 0.00 | Equity | US Equity Large Cap Value | |
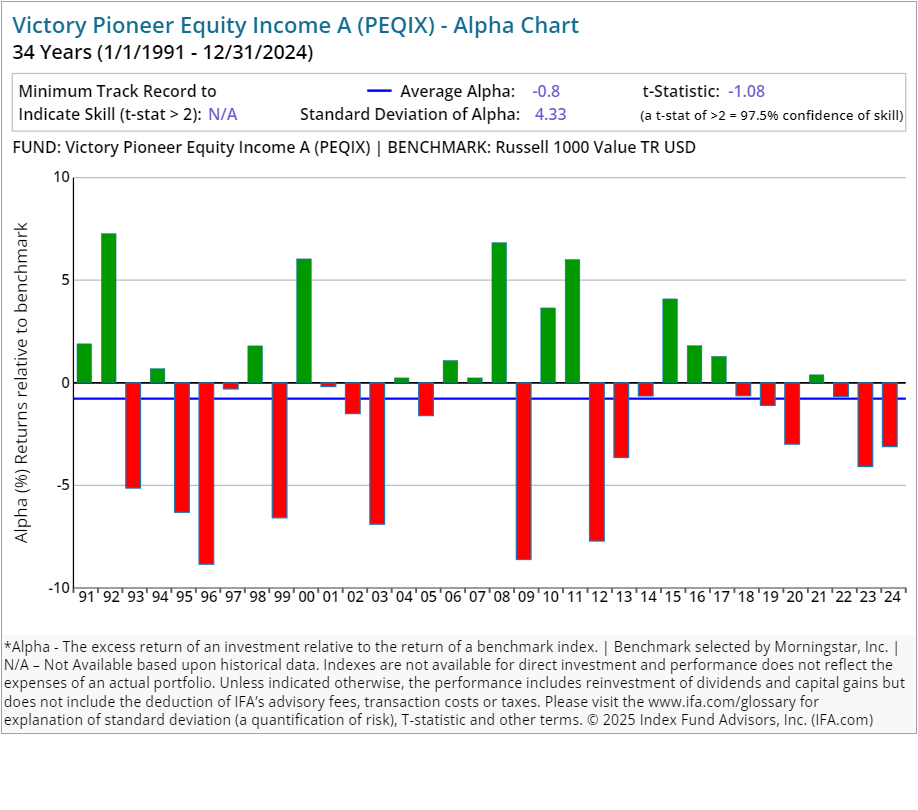
| Victory Pioneer Equity Income A | PEQIX | 59.00 | 1.00 | 0.25 | 5.75 | Equity | US Equity Large Cap Value |
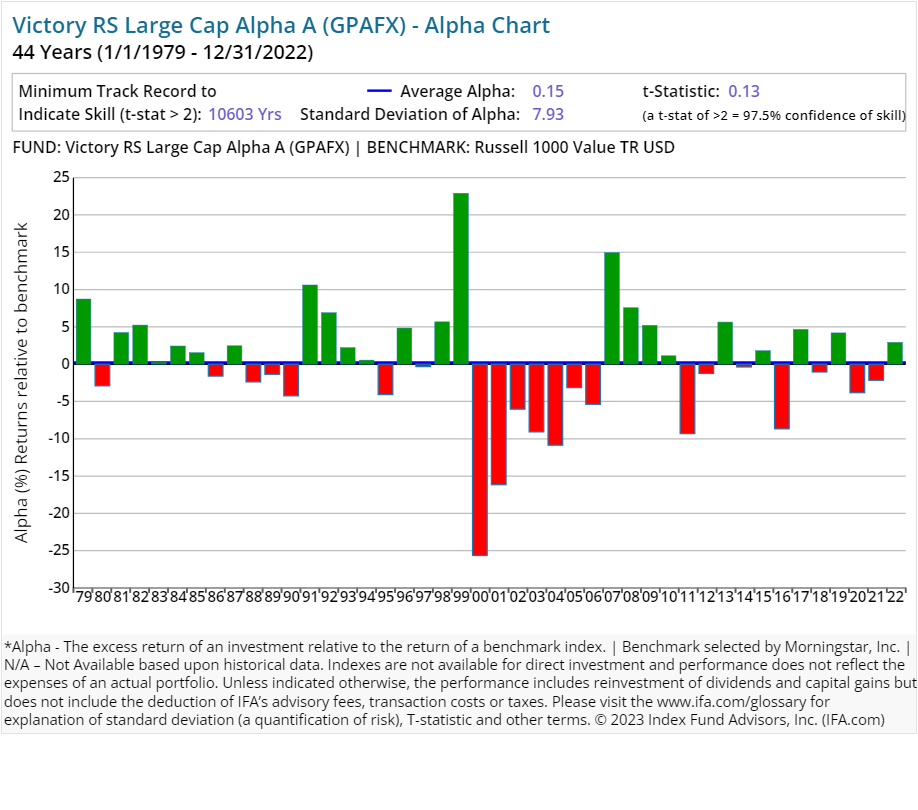
| Victory RS Large Cap Alpha A | GPAFX | 27.00 | 0.89 | 0.25 | 5.75 | Equity | US Equity Large Cap Value |
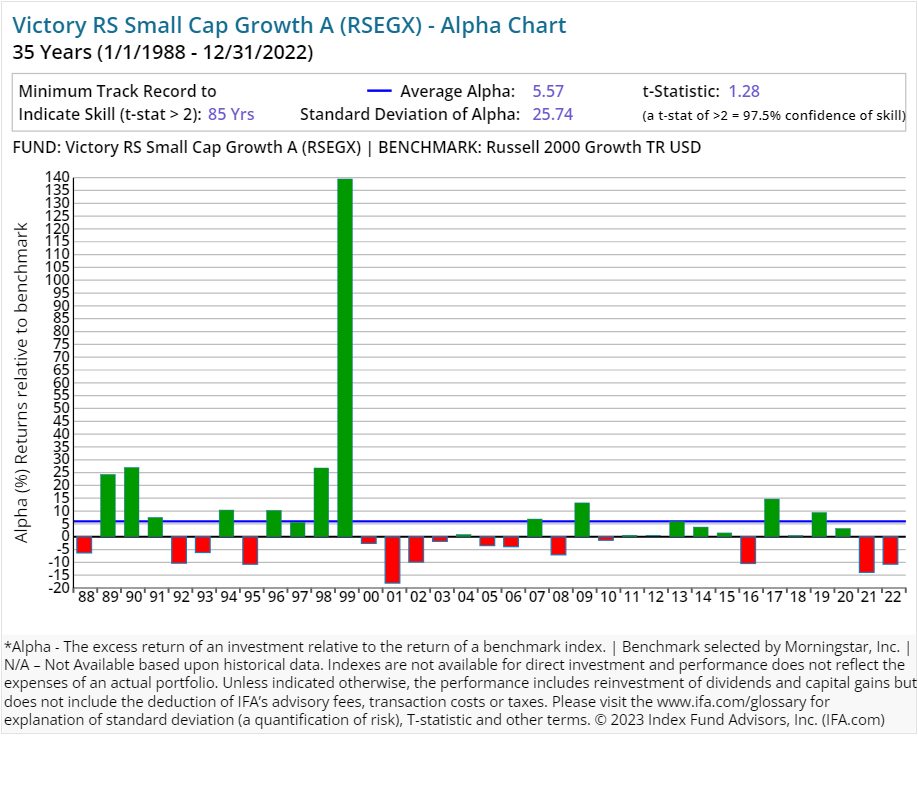
| Victory RS Small Cap Growth A | RSEGX | 120.00 | 1.40 | 0.25 | 5.75 | Equity | US Equity Small Cap |
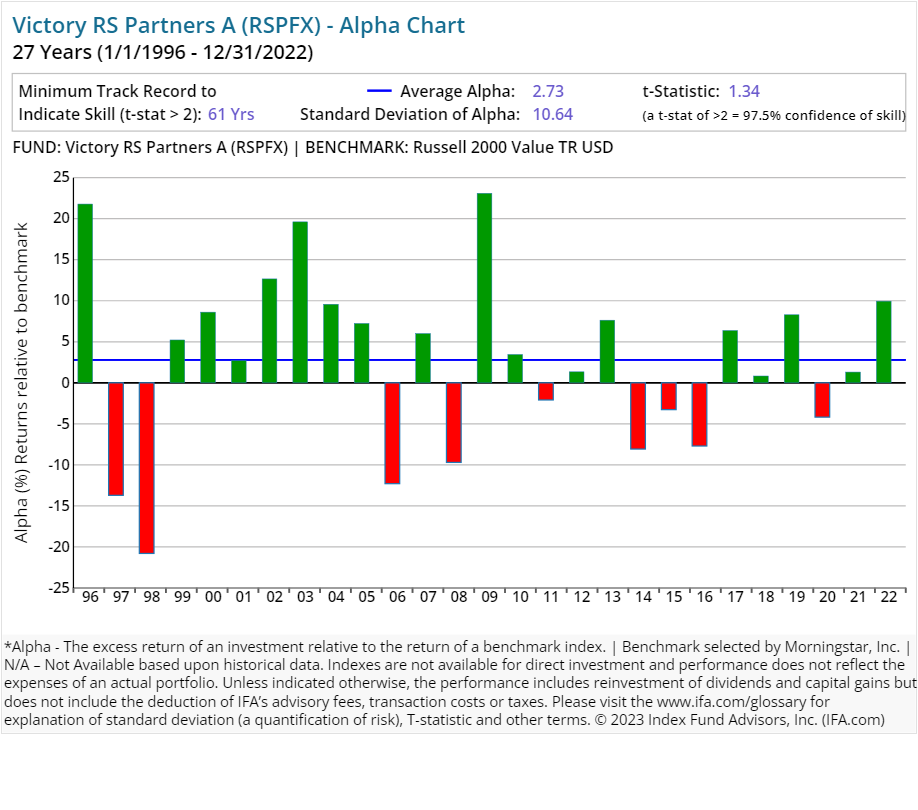
| Victory RS Partners A | RSPFX | 48.00 | 1.33 | 0.25 | 5.75 | Equity | US Equity Small Cap |
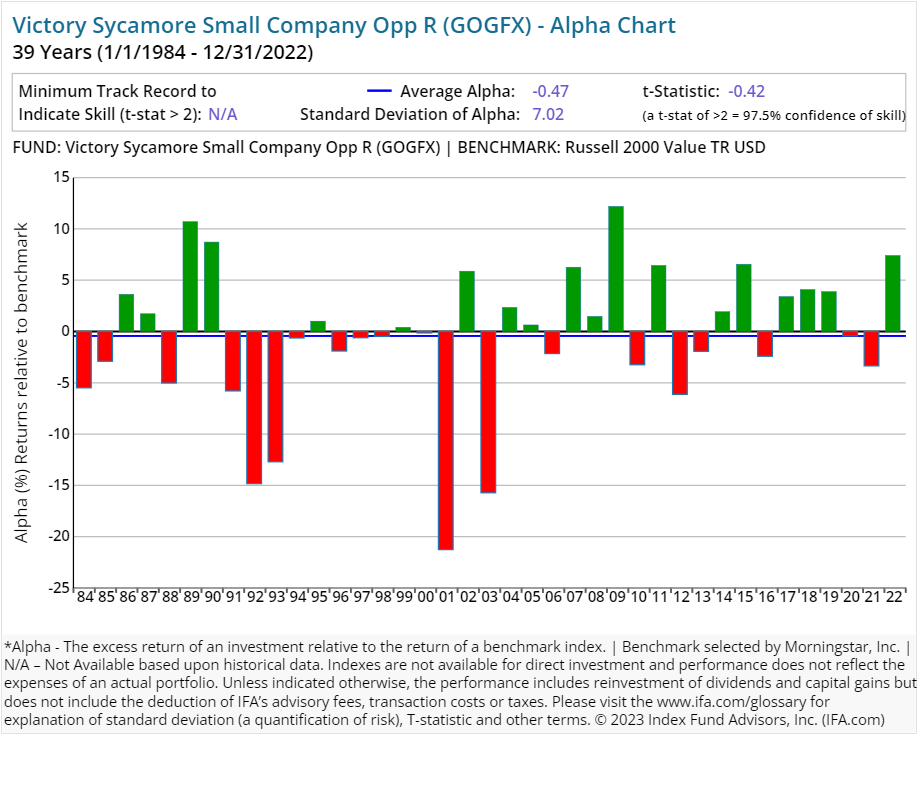
| Victory Sycamore Small Company Opp R | GOGFX | 37.00 | 1.46 | 0.50 | Equity | US Equity Small Cap | |
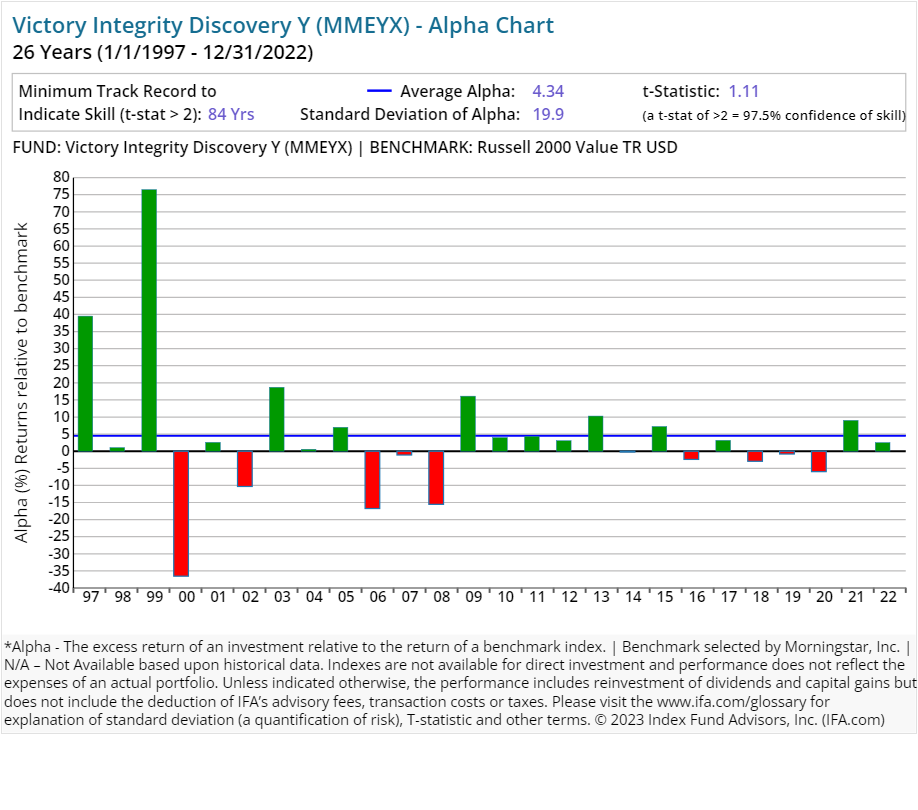
| Victory Integrity Discovery Y | MMEYX | 37.00 | 1.44 | 0.00 | Equity | US Equity Small Cap | |
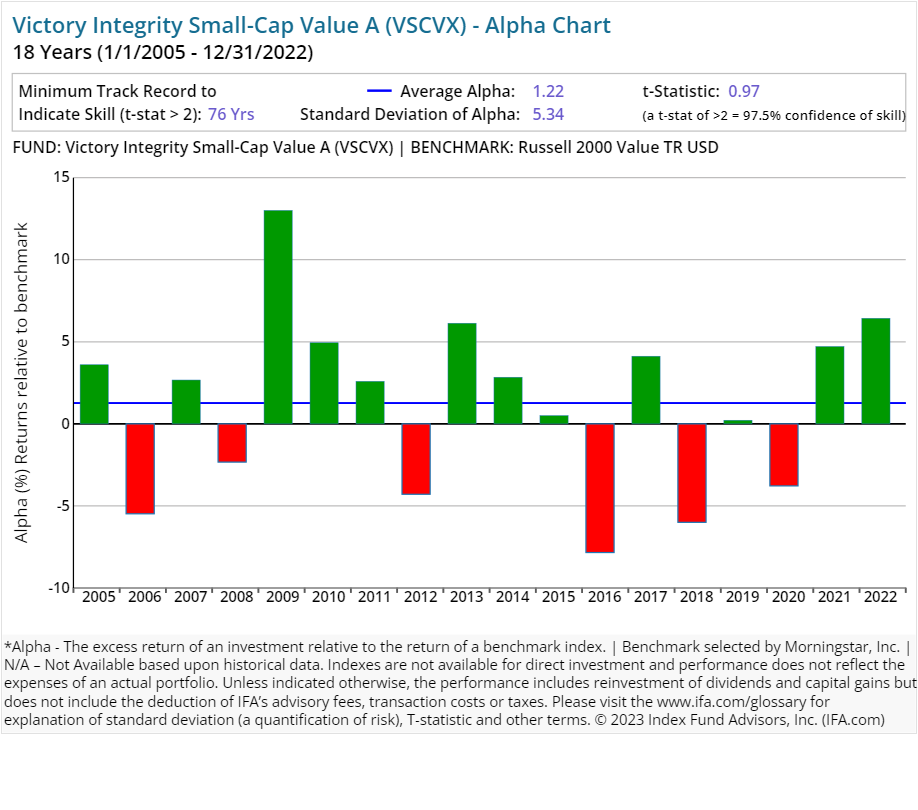
| Victory Integrity Small-Cap Value A | VSCVX | 62.00 | 1.44 | 0.25 | 5.75 | Equity | US Equity Small Cap |
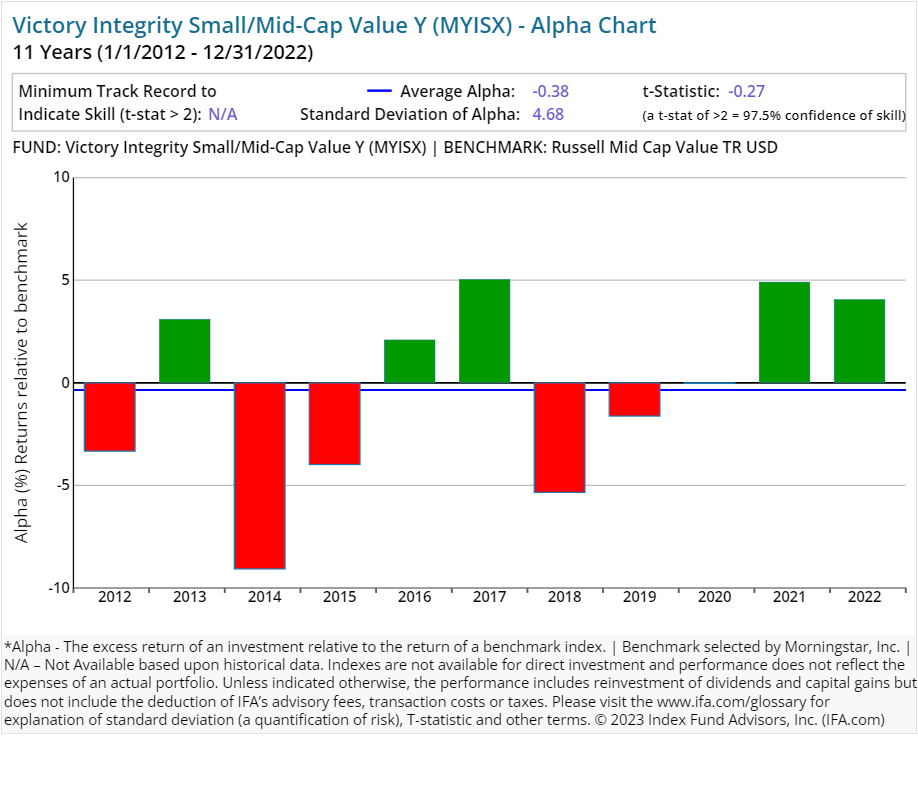
| Victory Integrity Small/Mid-Cap Value Y | MYISX | 75.00 | 0.88 | 0.00 | Equity | US Equity Small Cap | |
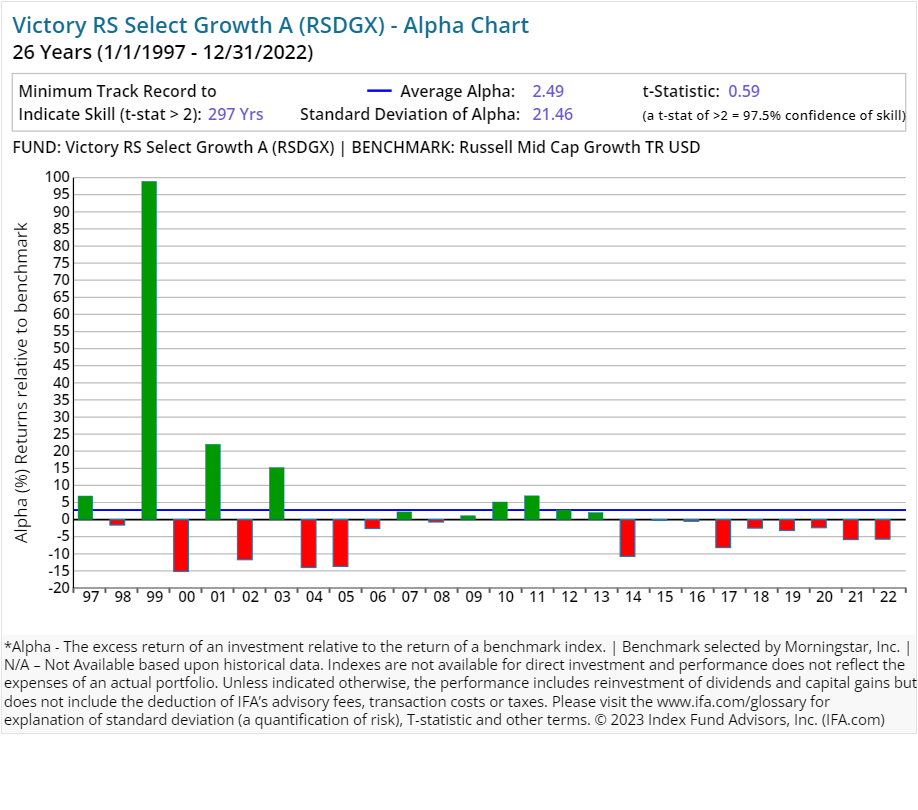
| Victory RS Select Growth A | RSDGX | 129.00 | 1.40 | 0.25 | 5.75 | Equity | US Equity Mid Cap |
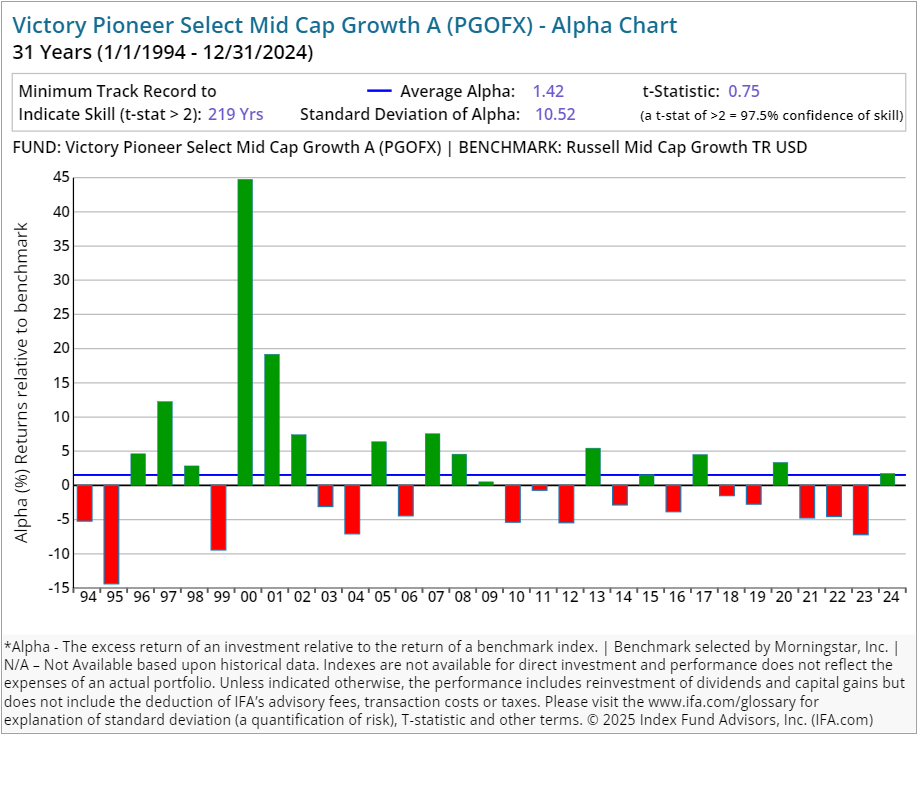
| Victory Pioneer Select Mid Cap Growth A | PGOFX | 53.00 | 0.99 | 0.25 | 5.75 | Equity | US Equity Mid Cap |
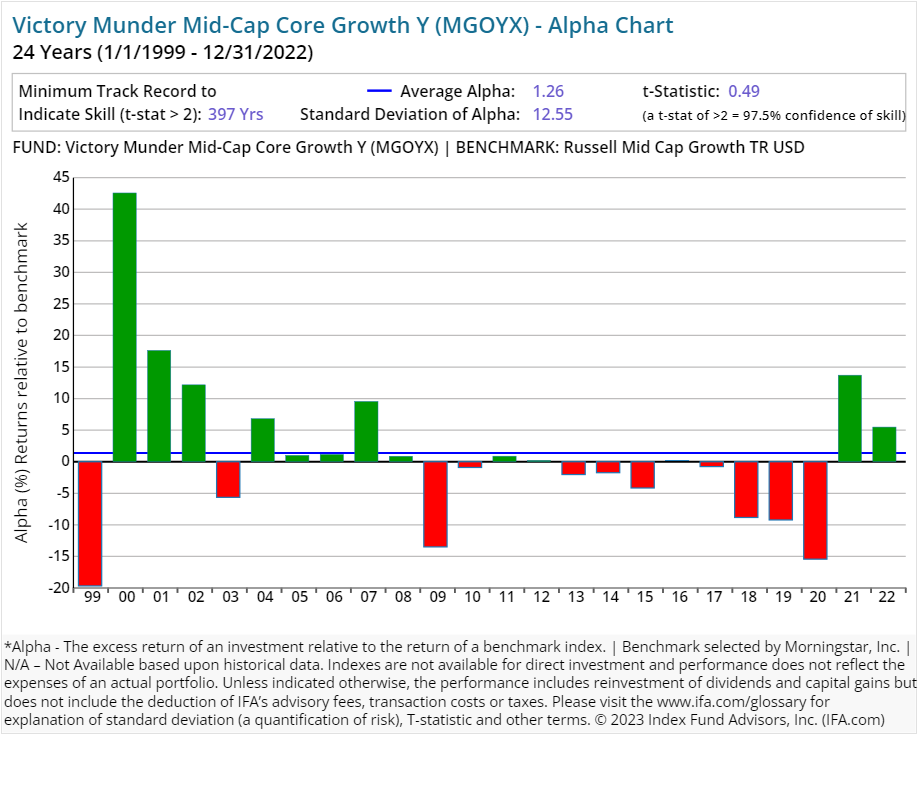
| Victory Munder Mid-Cap Core Growth Y | MGOYX | 53.00 | 1.00 | 0.00 | Equity | US Equity Mid Cap | |
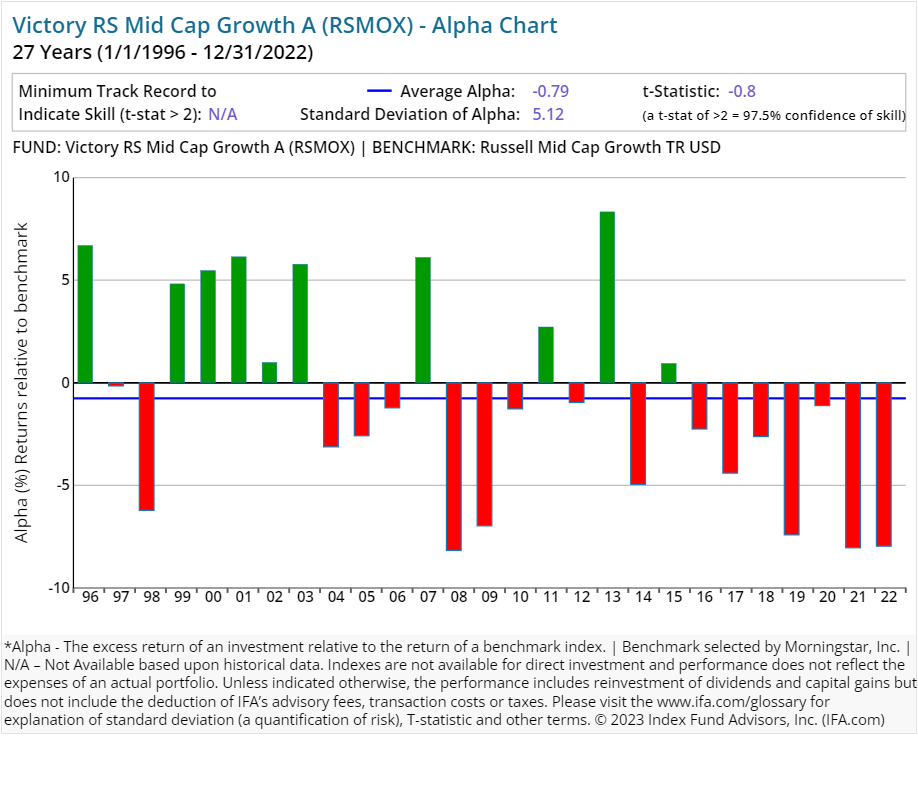
| Victory RS Mid Cap Growth A | RSMOX | 126.00 | 1.20 | 0.25 | 5.75 | Equity | US Equity Mid Cap |
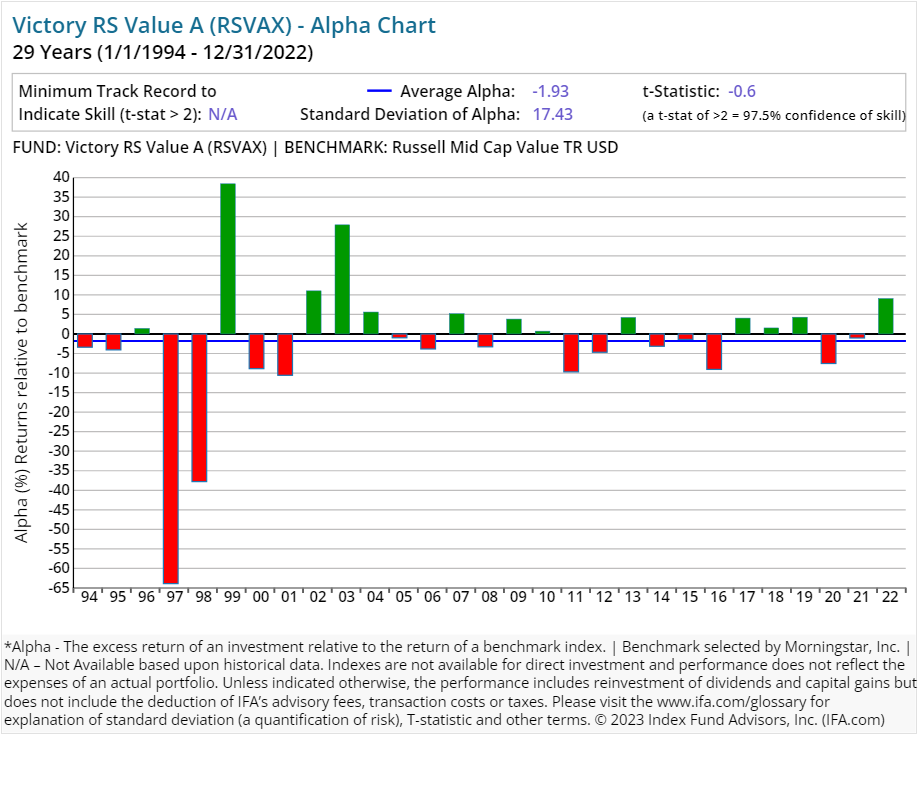
| Victory RS Value A | RSVAX | 39.00 | 1.30 | 0.25 | 5.75 | Equity | US Equity Mid Cap |
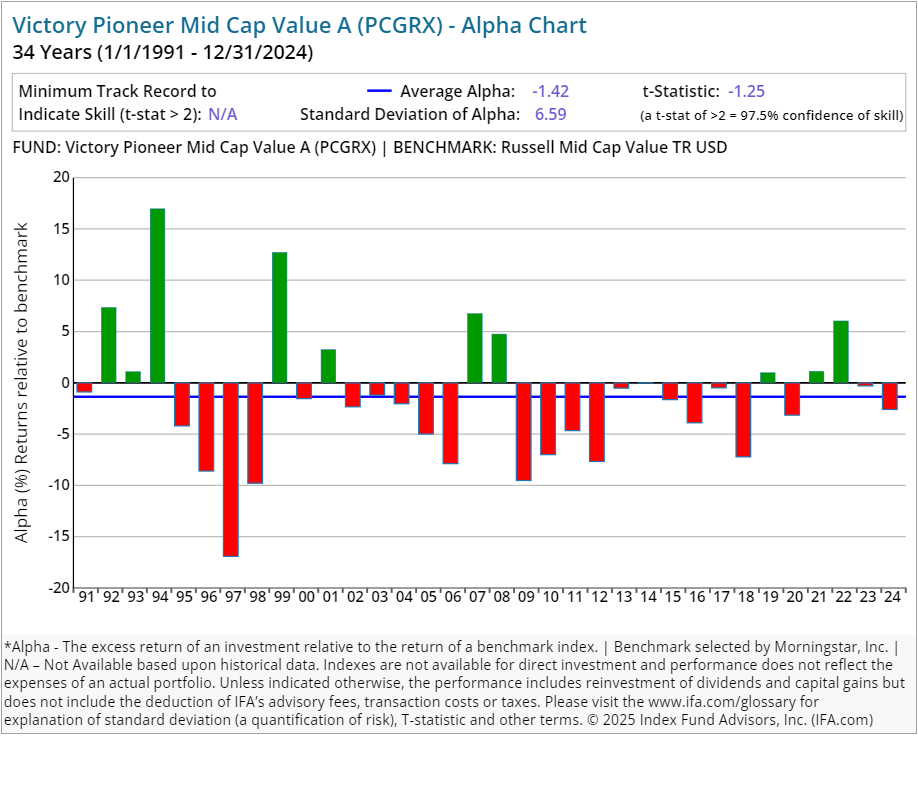
| Victory Pioneer Mid Cap Value A | PCGRX | 33.00 | 1.17 | 0.25 | 5.75 | Equity | US Equity Mid Cap |
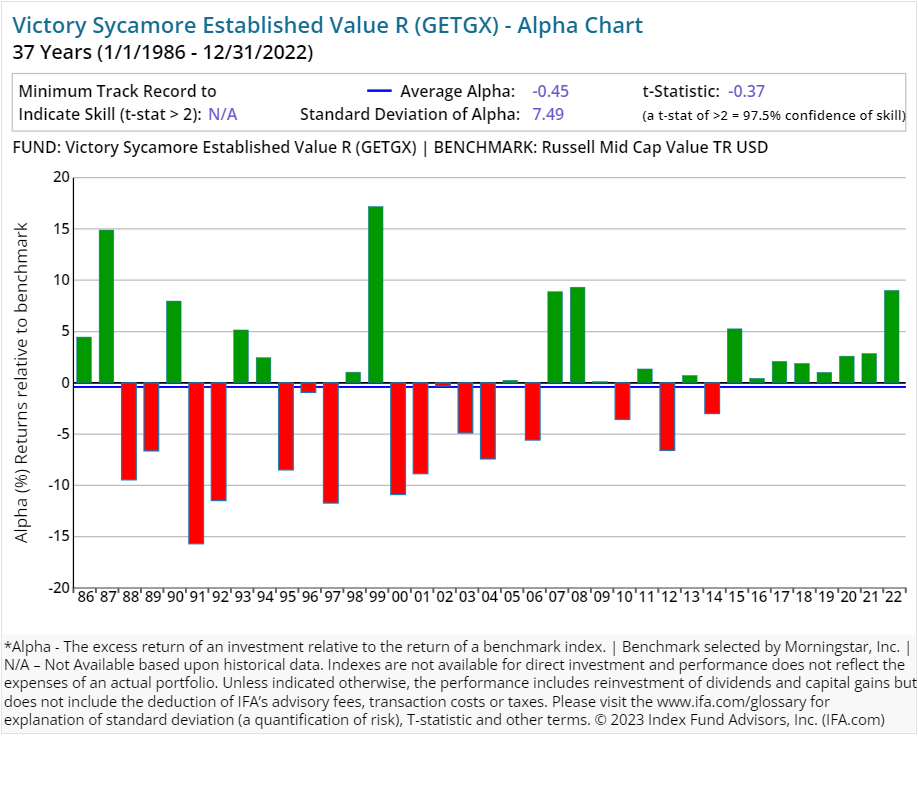
| Victory Sycamore Established Value R | GETGX | 34.00 | 1.11 | 0.50 | Equity | US Equity Mid Cap | |
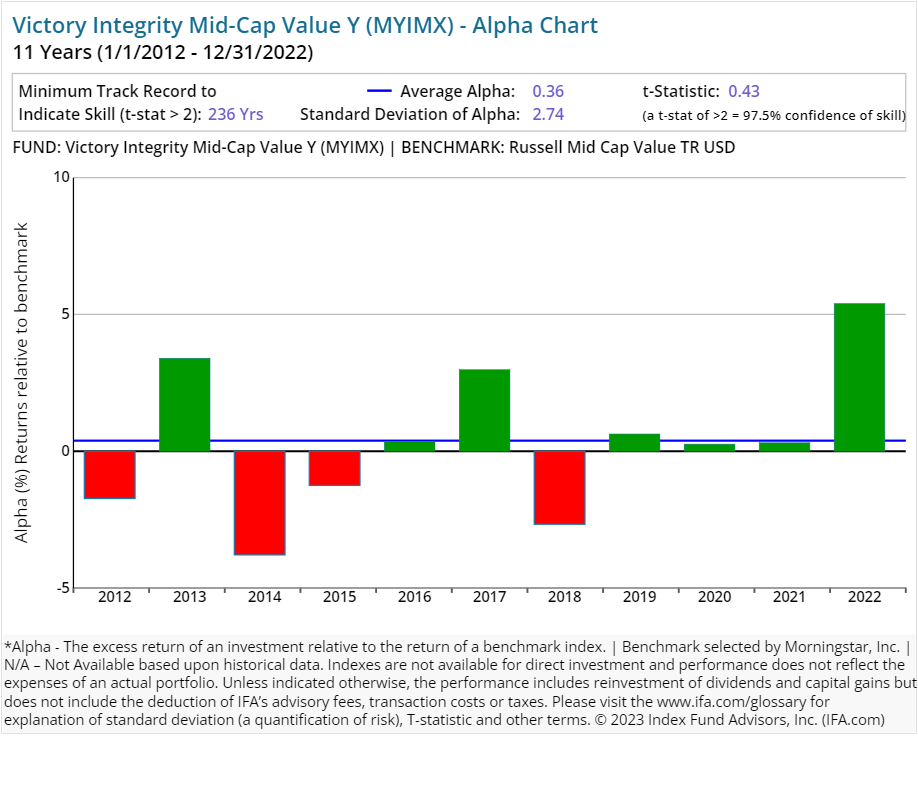
| Victory Integrity Mid-Cap Value Y | MYIMX | 75.00 | 0.75 | 0.00 | Equity | US Equity Mid Cap | |
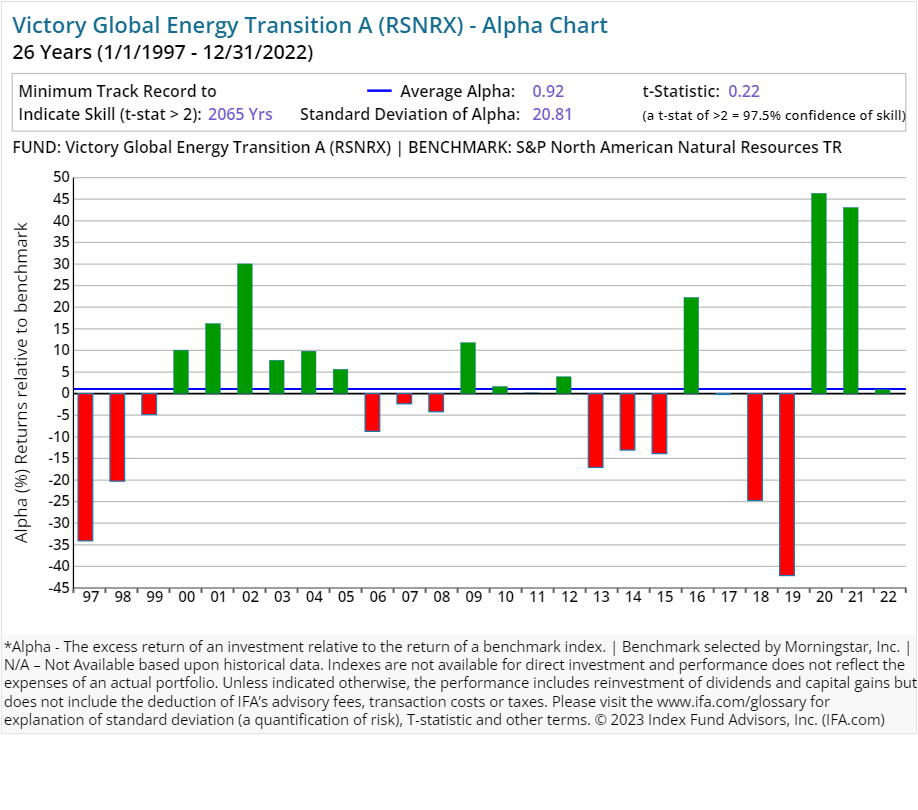
| Victory Global Energy Transition A | RSNRX | 57.00 | 1.48 | 0.25 | 5.75 | Equity | Natural Resources Sector Equity |
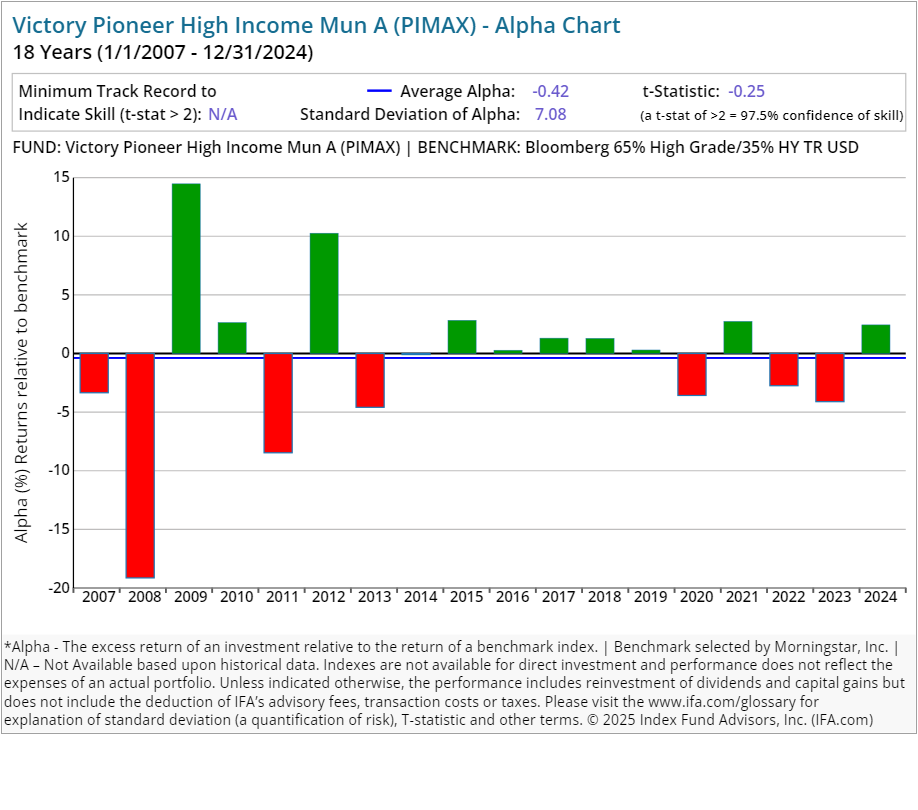
| Victory Pioneer High Income Mun A | PIMAX | 30.00 | 0.82 | 0.25 | 4.50 | Fixed Income | US Municipal Fixed Income |
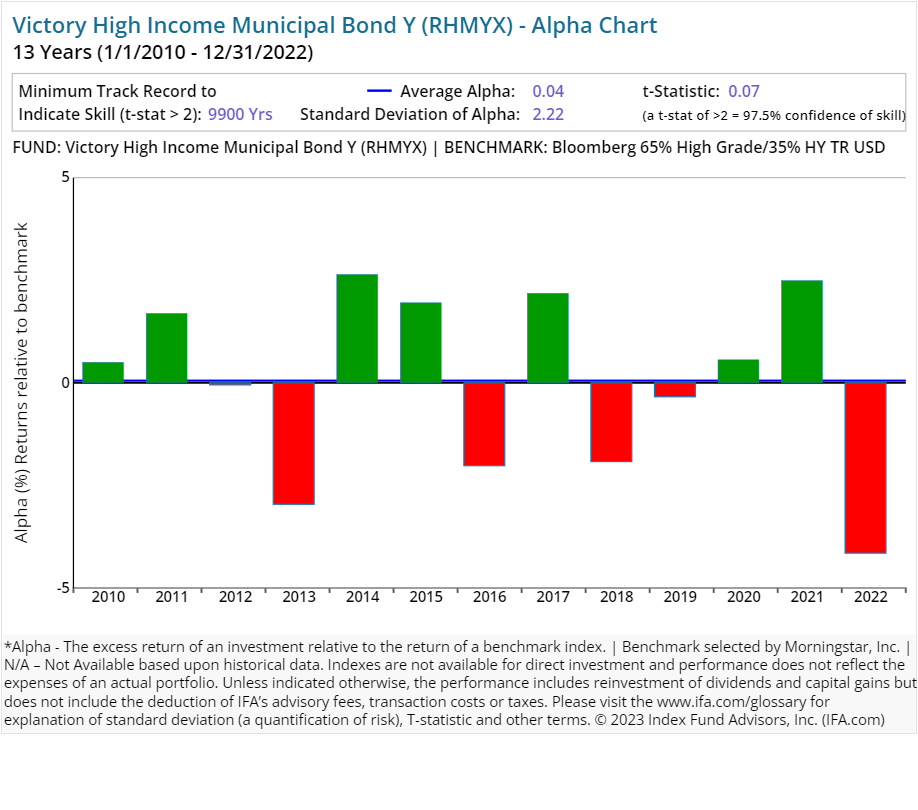
| Victory High Income Municipal Bond Y | RHMYX | 8.00 | 0.57 | 0.00 | Fixed Income | US Municipal Fixed Income | |
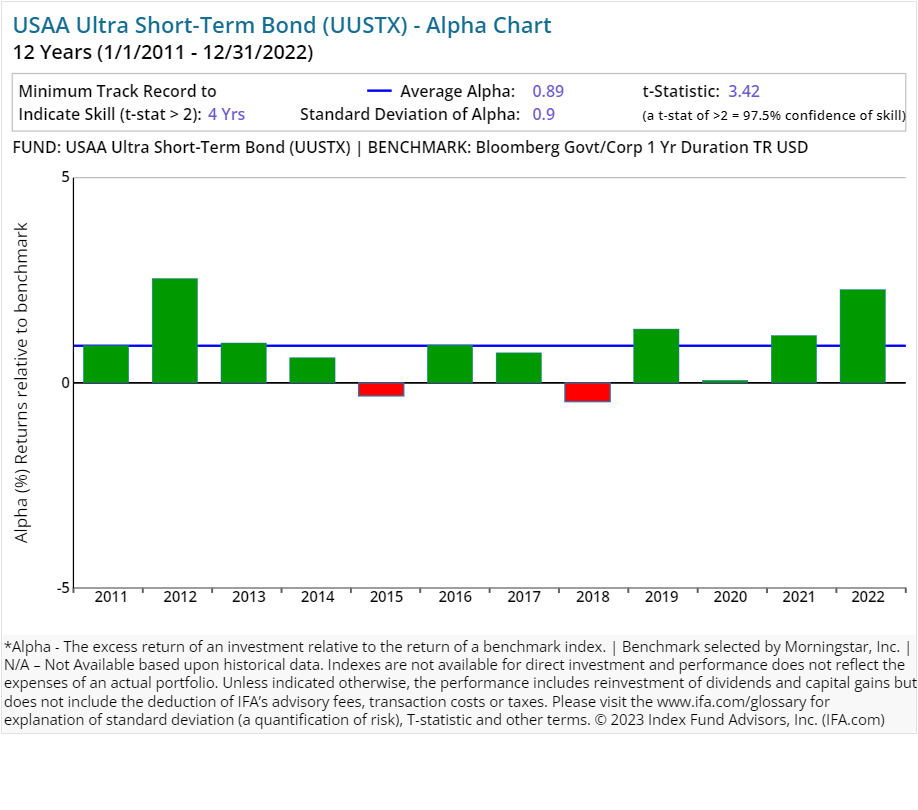
| Victory Ultra Short-Term Bond | UUSTX | 47.00 | 0.59 | 0.00 | Fixed Income | US Fixed Income | |
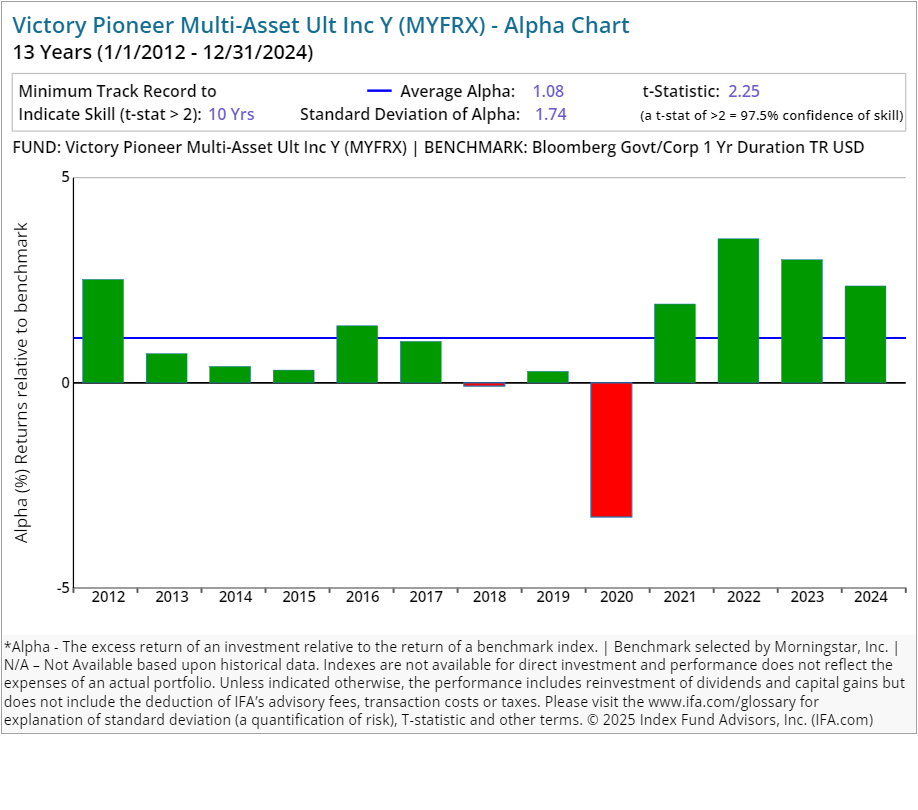
| Victory Pioneer Multi-Asset Ult Inc Y | MYFRX | 53.00 | 0.44 | 0.00 | Fixed Income | US Fixed Income | |
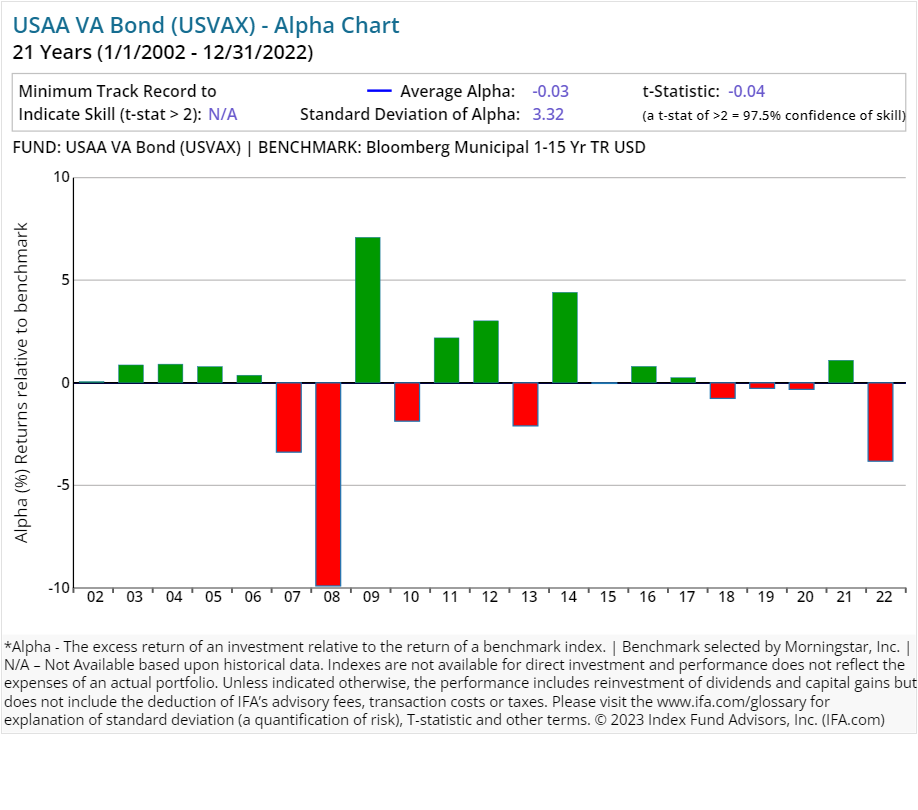
| Victory VA Bond | USVAX | 6.00 | 0.58 | 0.00 | Fixed Income | US Municipal Fixed Income | |
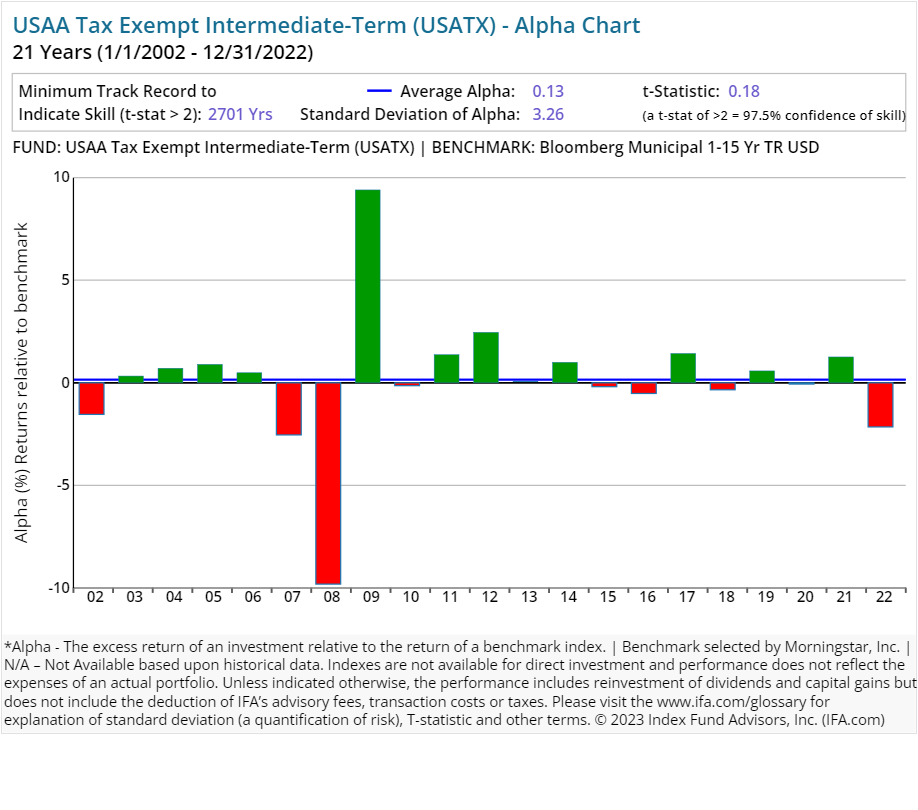
| Victory Tax Exempt Intermediate-Term | USATX | 13.00 | 0.49 | 0.00 | Fixed Income | US Municipal Fixed Income | |
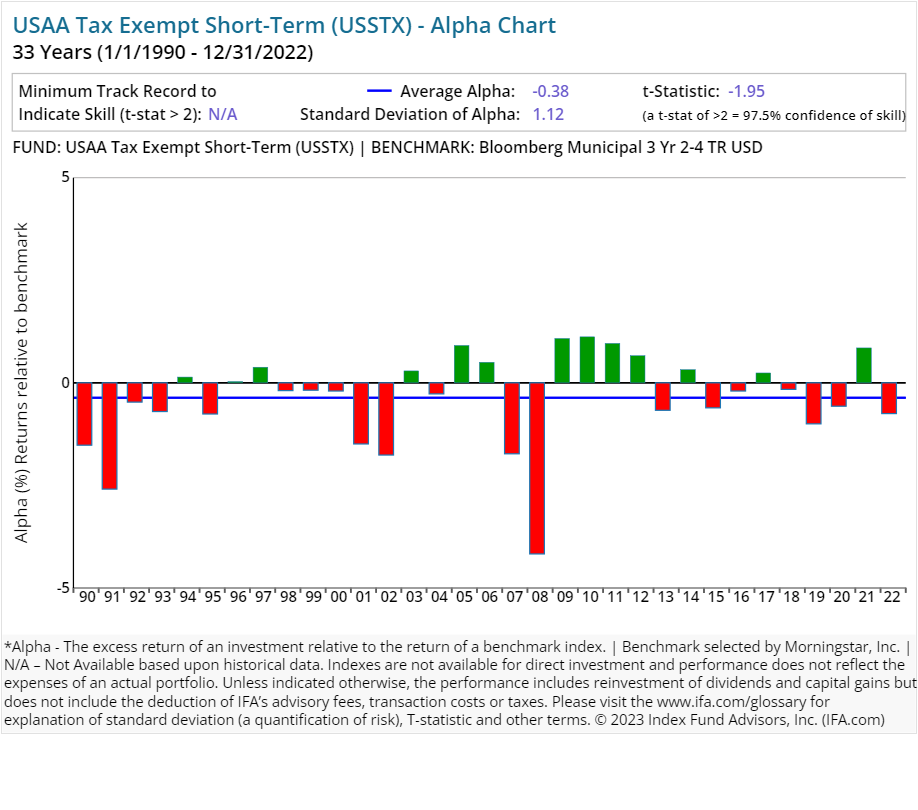
| Victory Tax Exempt Short-Term | USSTX | 31.00 | 0.50 | 0.00 | Fixed Income | US Municipal Fixed Income | |
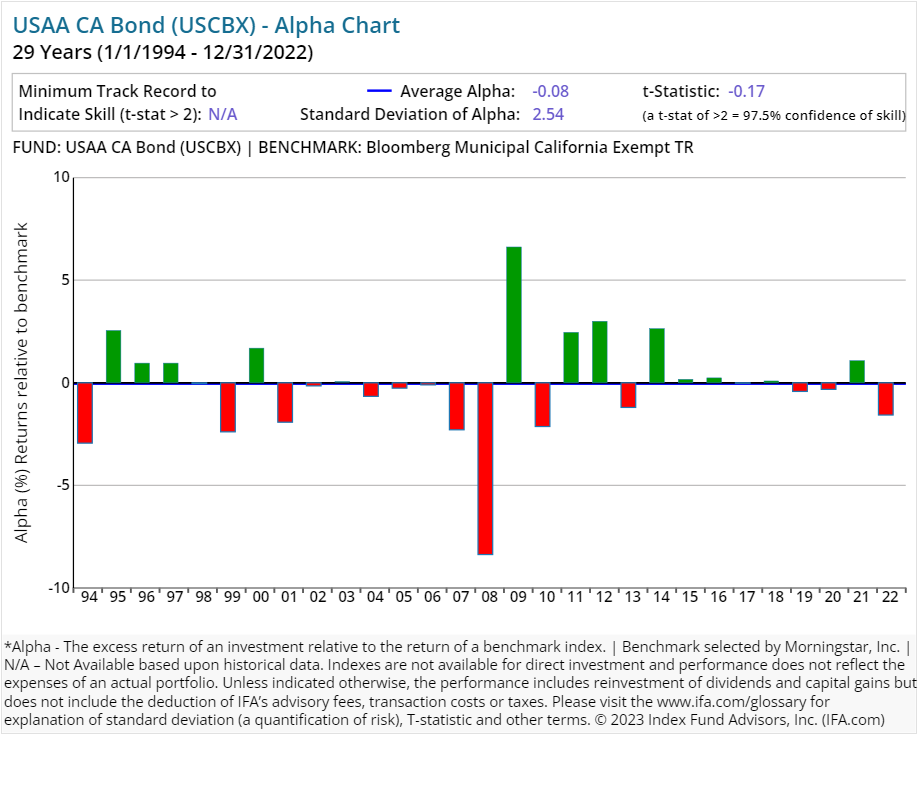
| Victory CA Bond | USCBX | 11.00 | 0.55 | 0.00 | Fixed Income | US Municipal Fixed Income | |
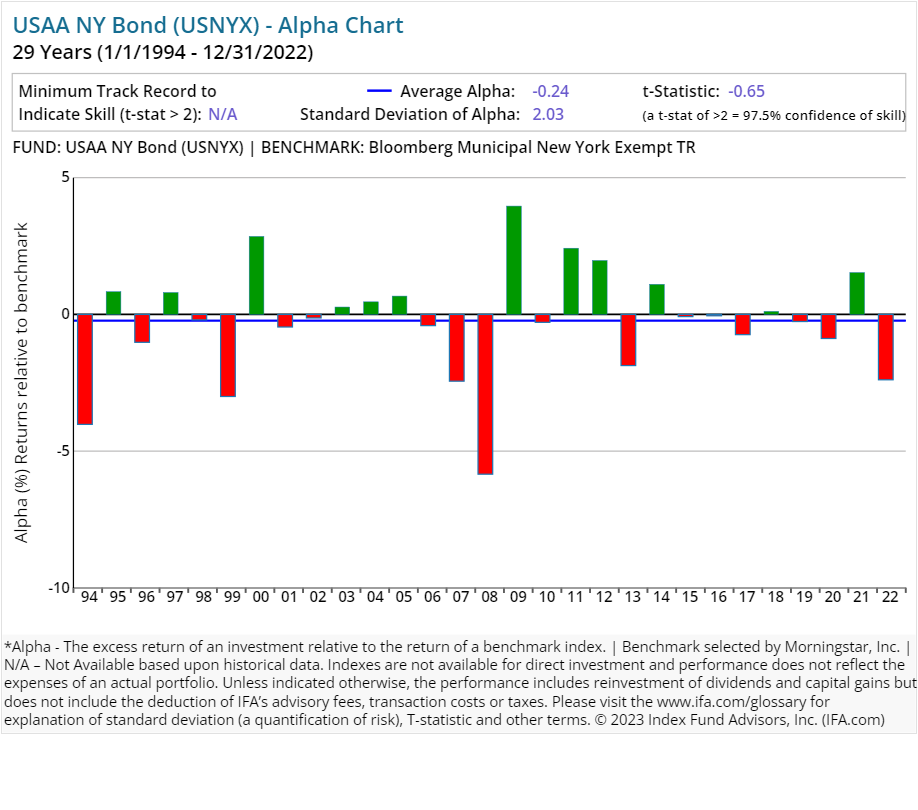
| Victory NY Bond | USNYX | 4.00 | 0.66 | 0.00 | Fixed Income | US Municipal Fixed Income | |
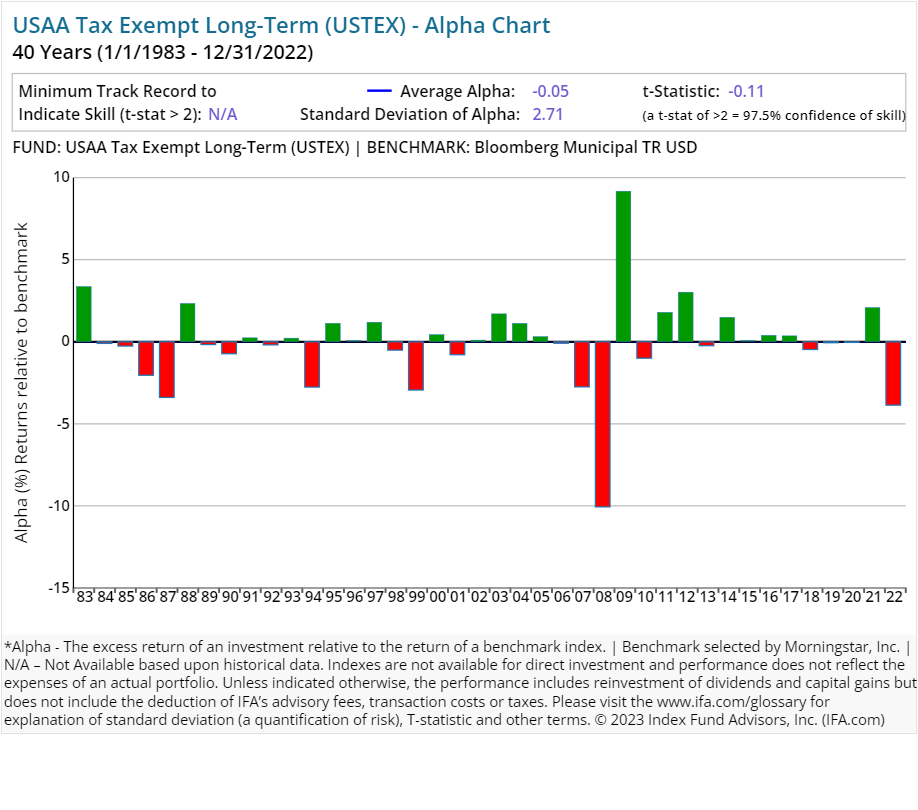
| Victory Tax Exempt Long-Term | USTEX | 4.00 | 0.45 | Fixed Income | US Municipal Fixed Income | ||
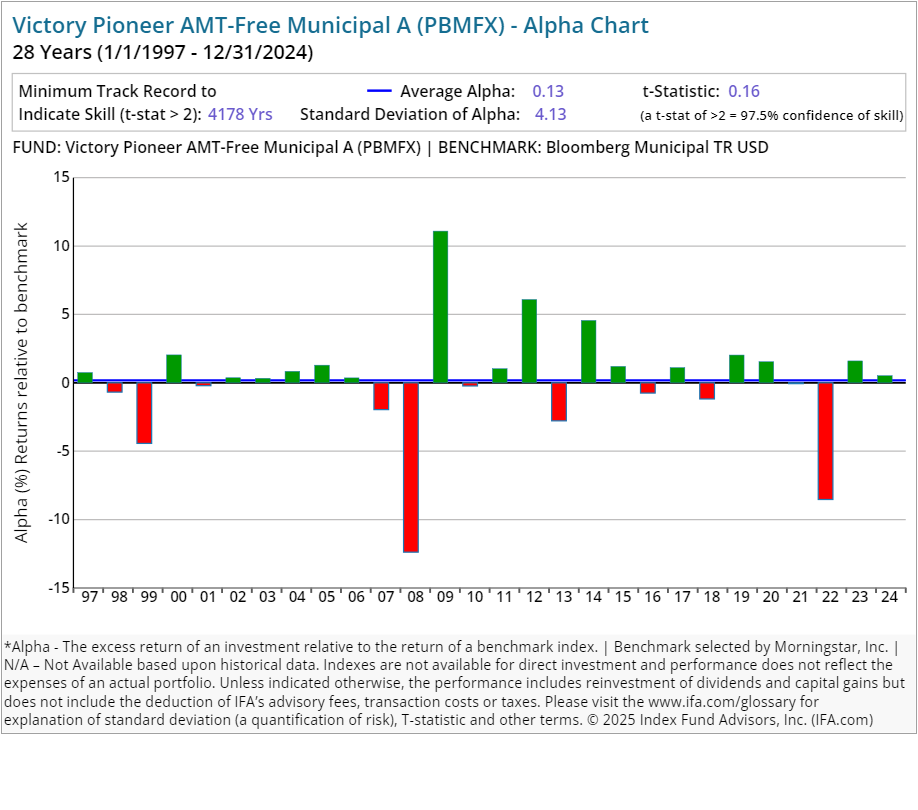
| Victory Pioneer AMT-Free Municipal A | PBMFX | 76.00 | 0.79 | 0.25 | 4.50 | Fixed Income | US Municipal Fixed Income |
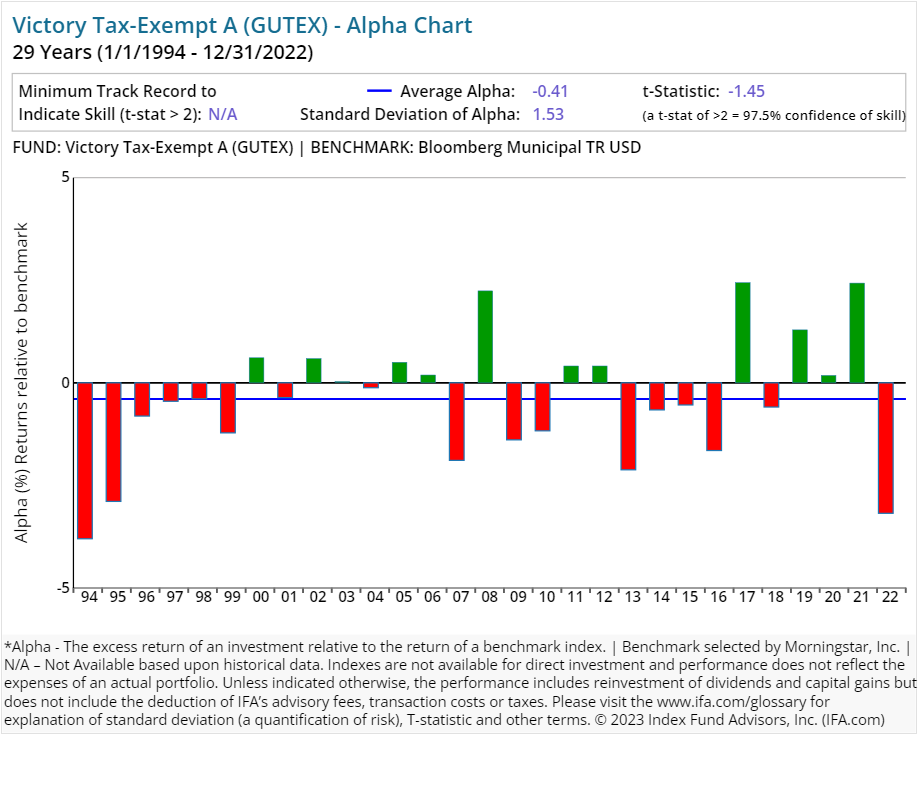
| Victory Tax-Exempt A | GUTEX | 18.00 | 0.80 | 0.25 | 2.25 | Fixed Income | US Municipal Fixed Income |
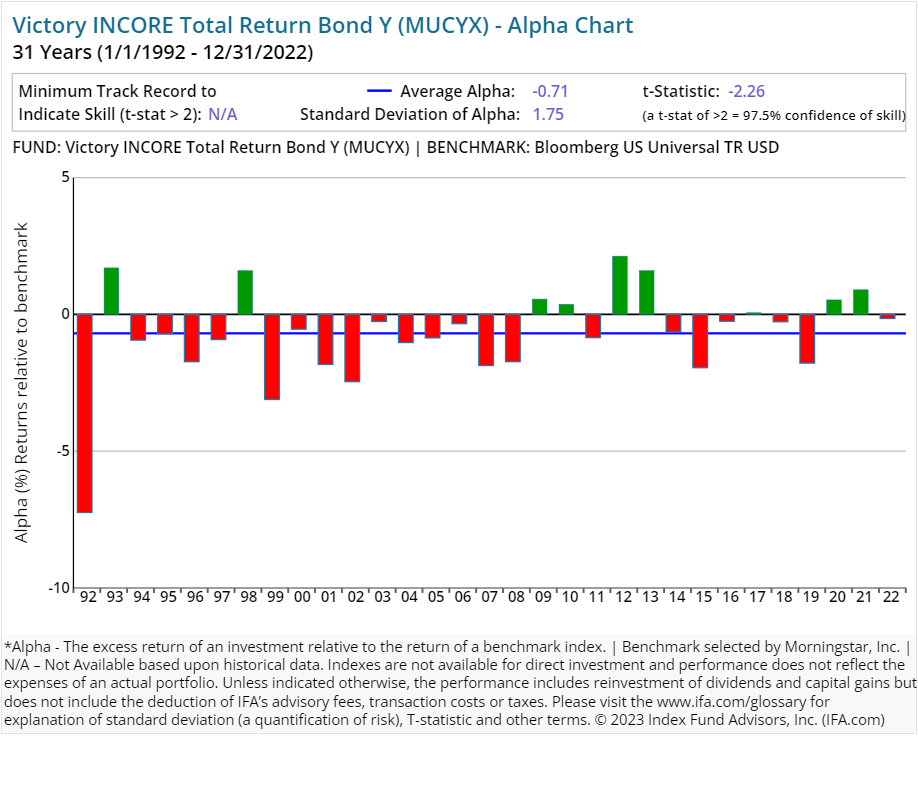
| Victory Core Bond Y | MUCYX | 142.00 | 0.60 | 0.00 | Fixed Income | US Fixed Income | |
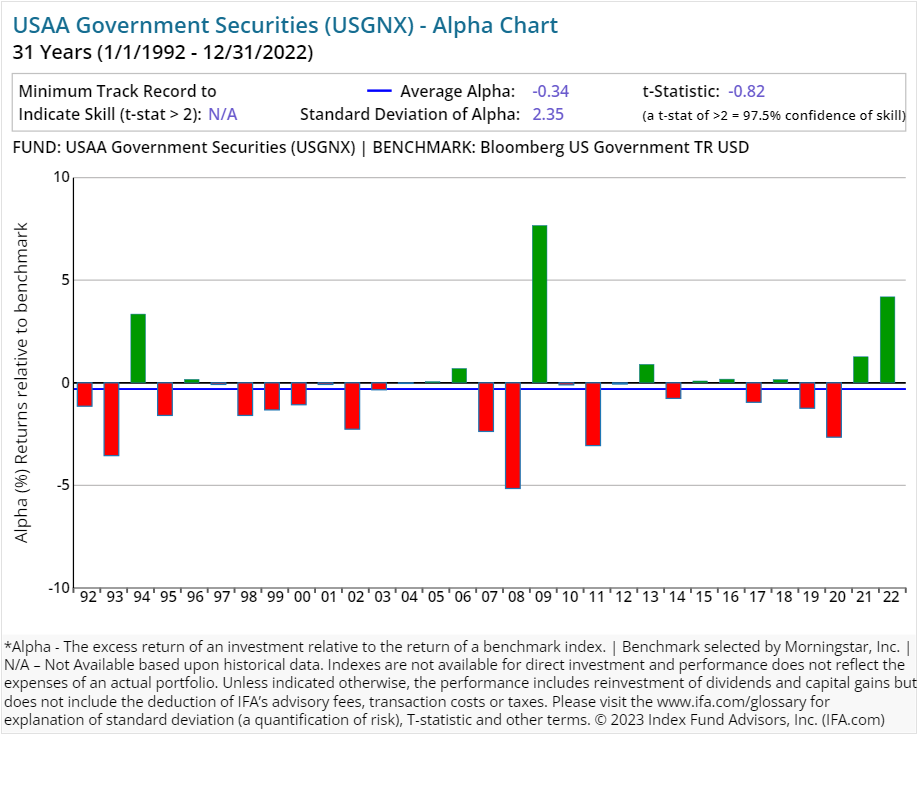
| Victory Government Securities | USGNX | 20.00 | 0.51 | 0.00 | Fixed Income | US Fixed Income | |
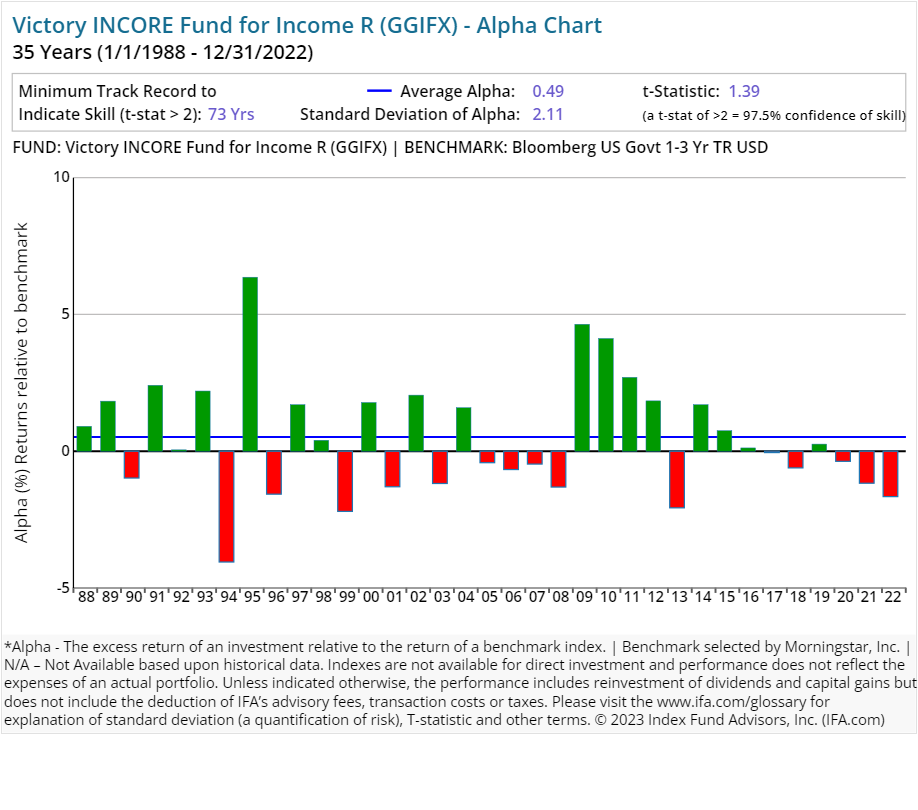
| Victory Fund for Income R | GGIFX | 3.00 | 0.91 | 0.25 | Fixed Income | US Fixed Income | |
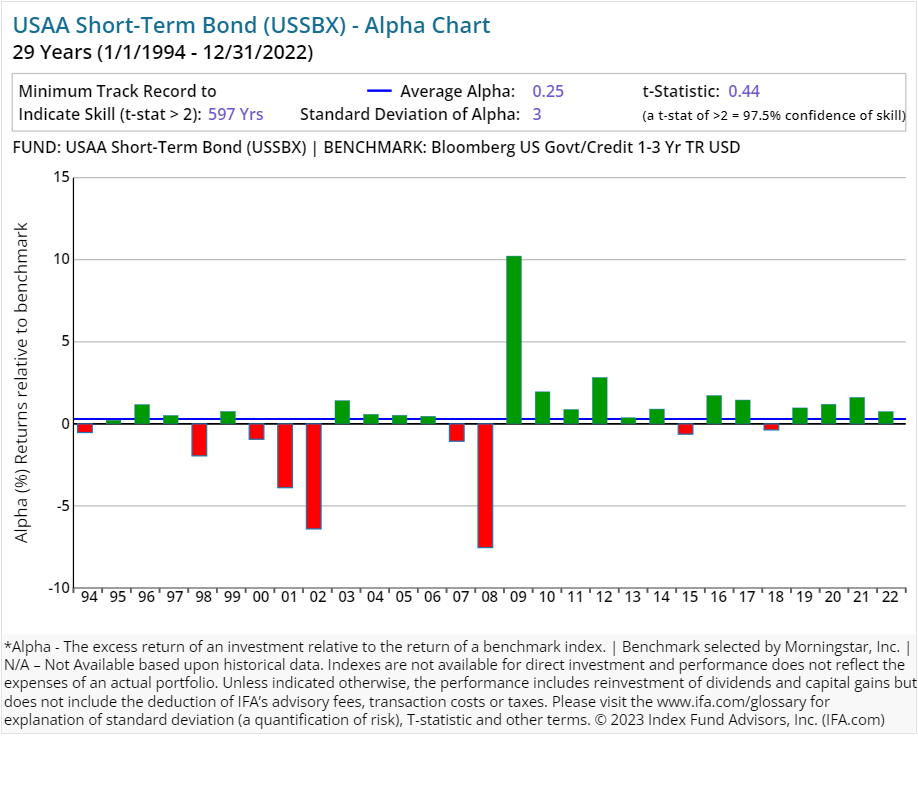
| Victory Short-Term Bond | USSBX | 46.00 | 0.57 | Fixed Income | US Fixed Income | ||
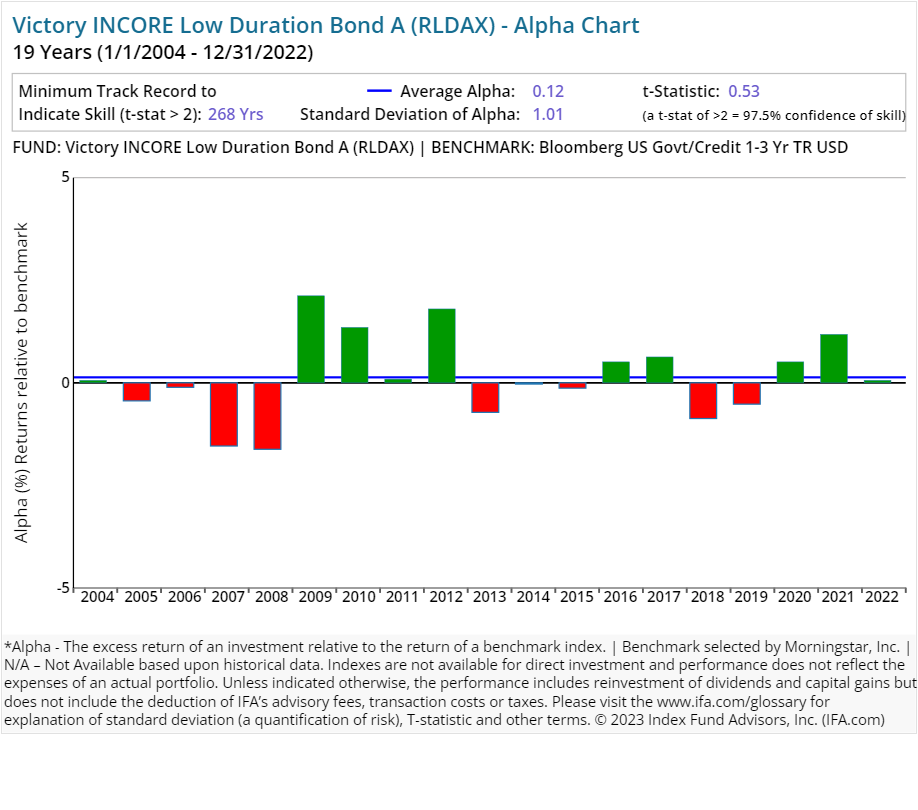
| Victory Low Duration Bond A | RLDAX | 38.00 | 0.85 | 0.25 | 2.25 | Fixed Income | US Fixed Income |
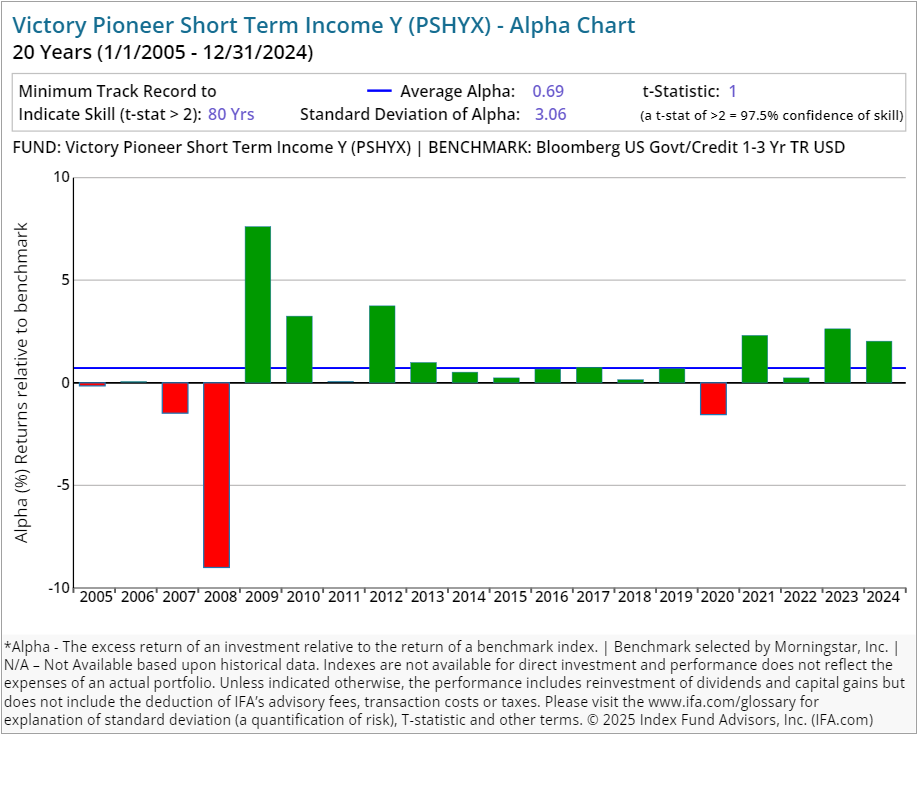
| Victory Pioneer Short Term Income Y | PSHYX | 40.00 | 0.46 | 0.00 | Fixed Income | US Fixed Income | |
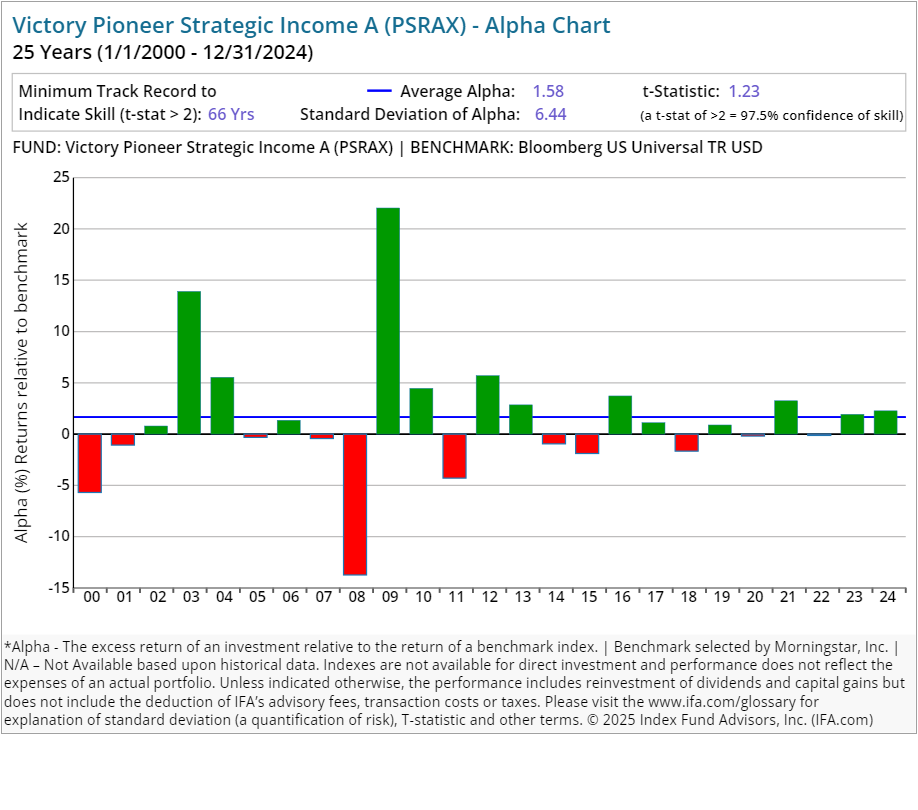
| Victory Pioneer Strategic Income A | PSRAX | 63.00 | 1.11 | 0.25 | 4.50 | Fixed Income | US Fixed Income |
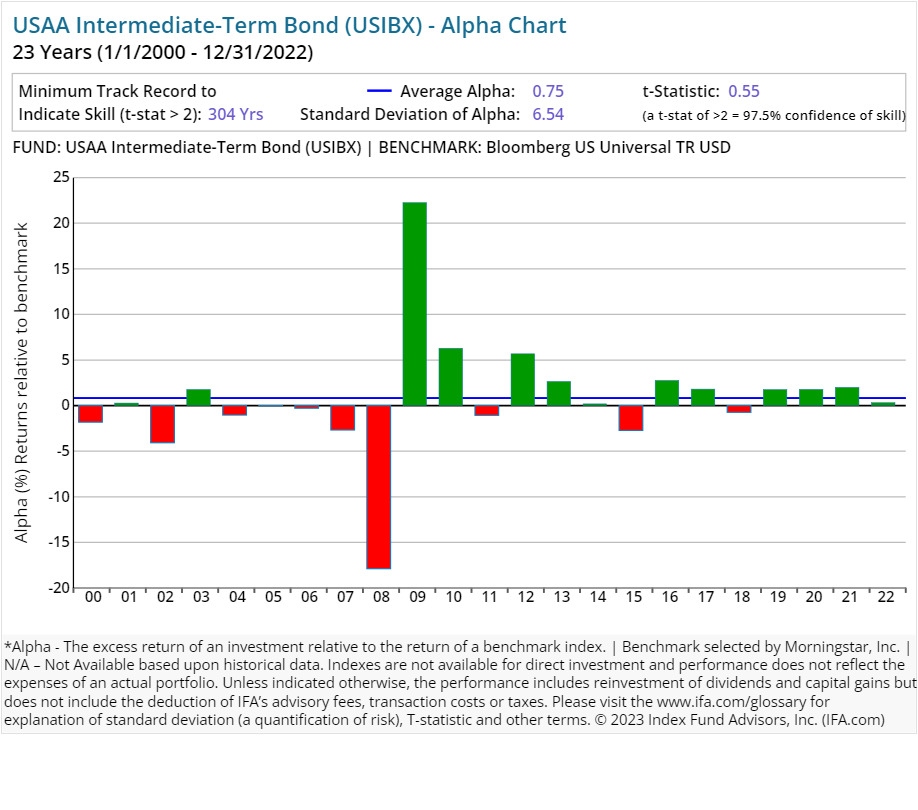
| Victory Core Plus Intermediate Bond Fund | USIBX | 36.00 | 0.64 | 0.00 | Fixed Income | US Fixed Income | |
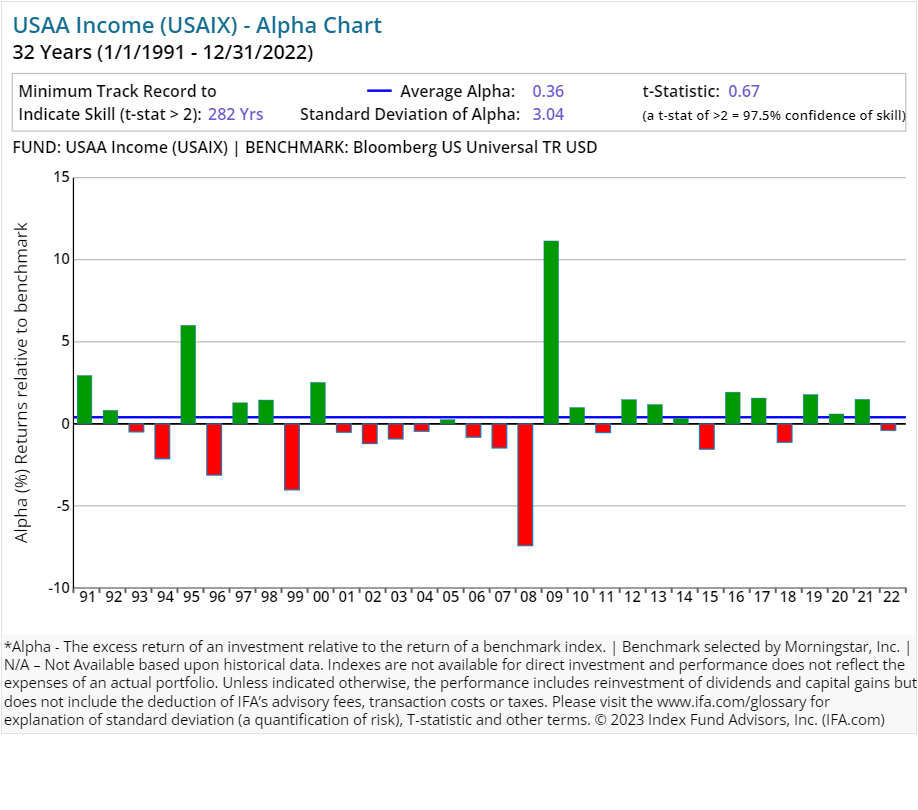
| Victory Income | USAIX | 25.00 | 0.59 | 0.00 | Fixed Income | US Fixed Income | |
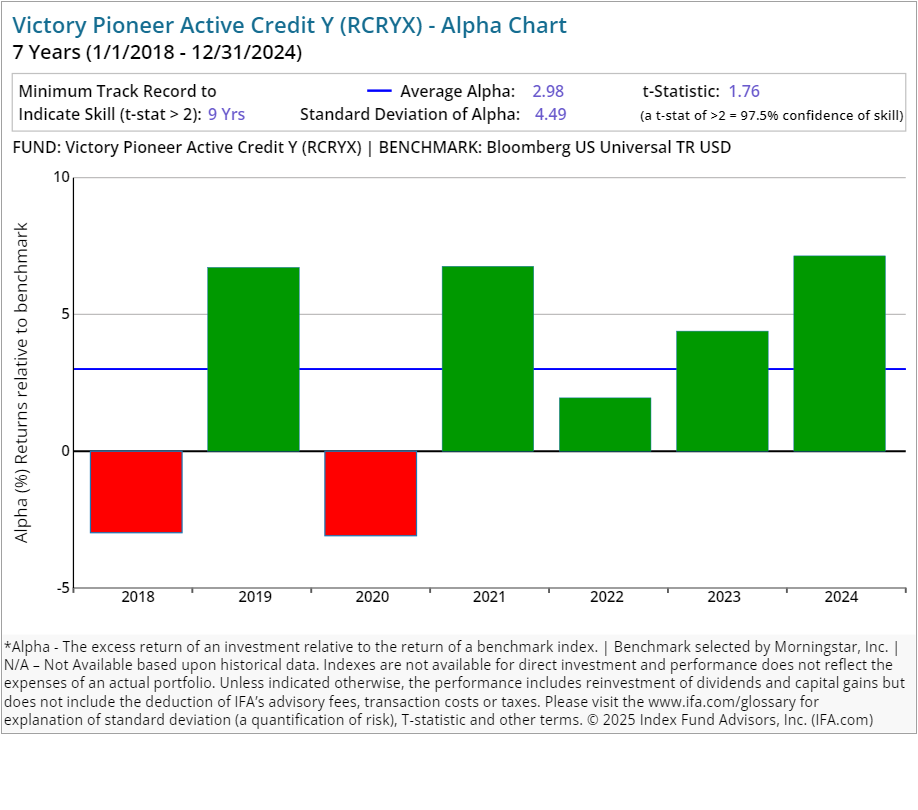
| Victory Pioneer Active Credit Y | RCRYX | 46.00 | 0.61 | 0.00 | Fixed Income | US Fixed Income | |
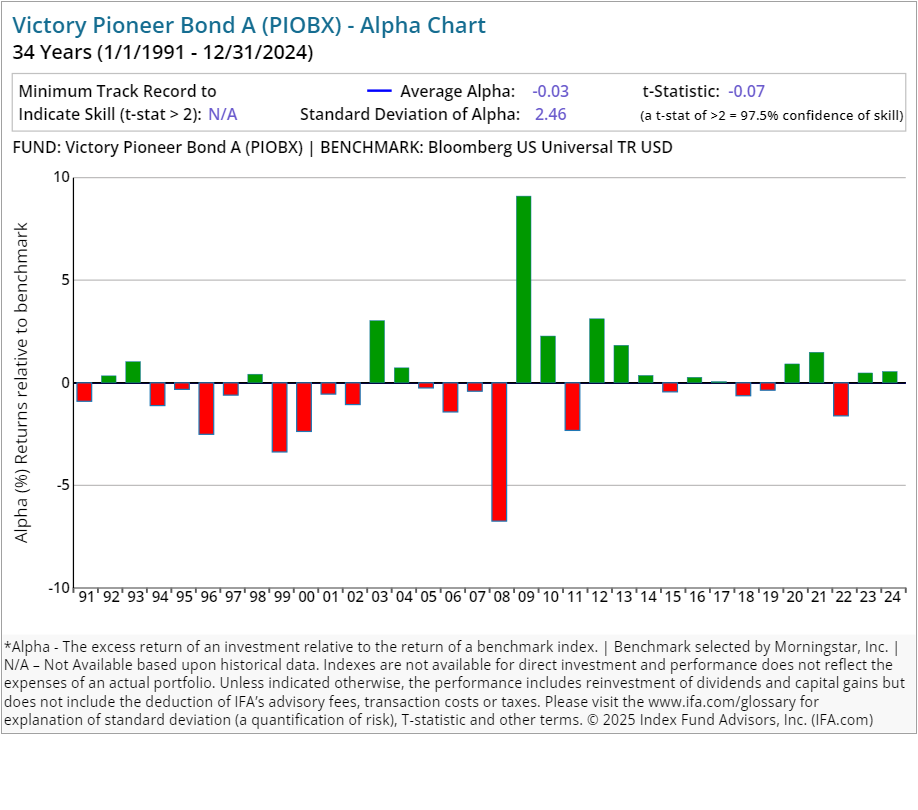
| Victory Pioneer Bond A | PIOBX | 44.00 | 0.81 | 0.25 | 4.50 | Fixed Income | US Fixed Income |
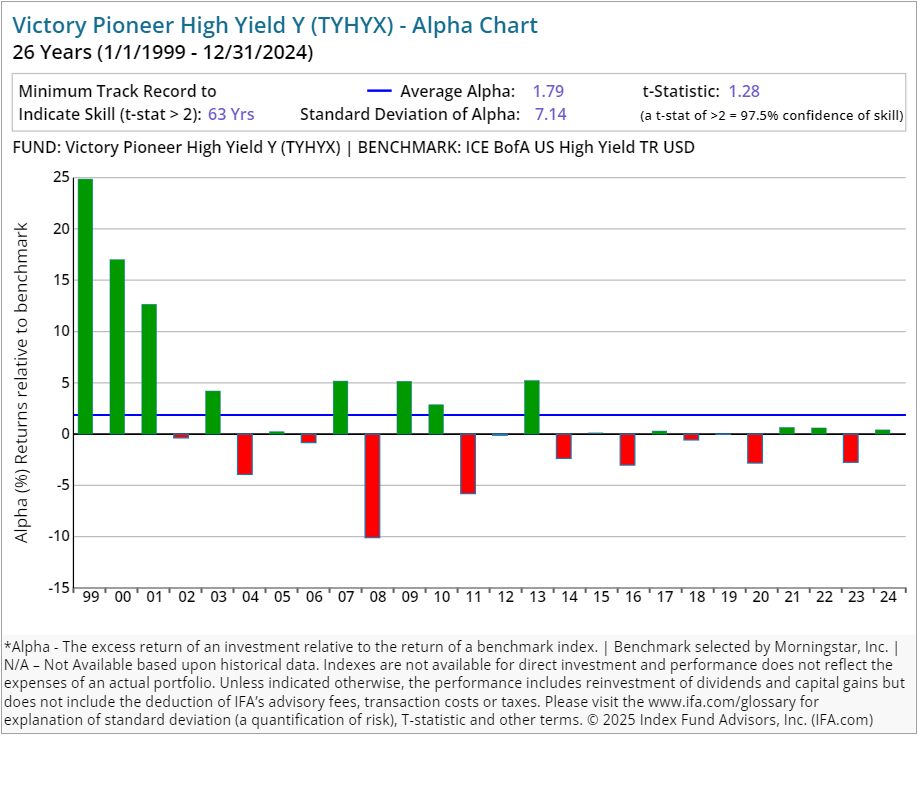
| Victory Pioneer High Yield Y | TYHYX | 60.00 | 0.85 | 0.00 | Fixed Income | US Fixed Income | |
| Victory High Income | USHYX | 58.00 | 0.79 | 0.00 | Fixed Income | US Fixed Income | |
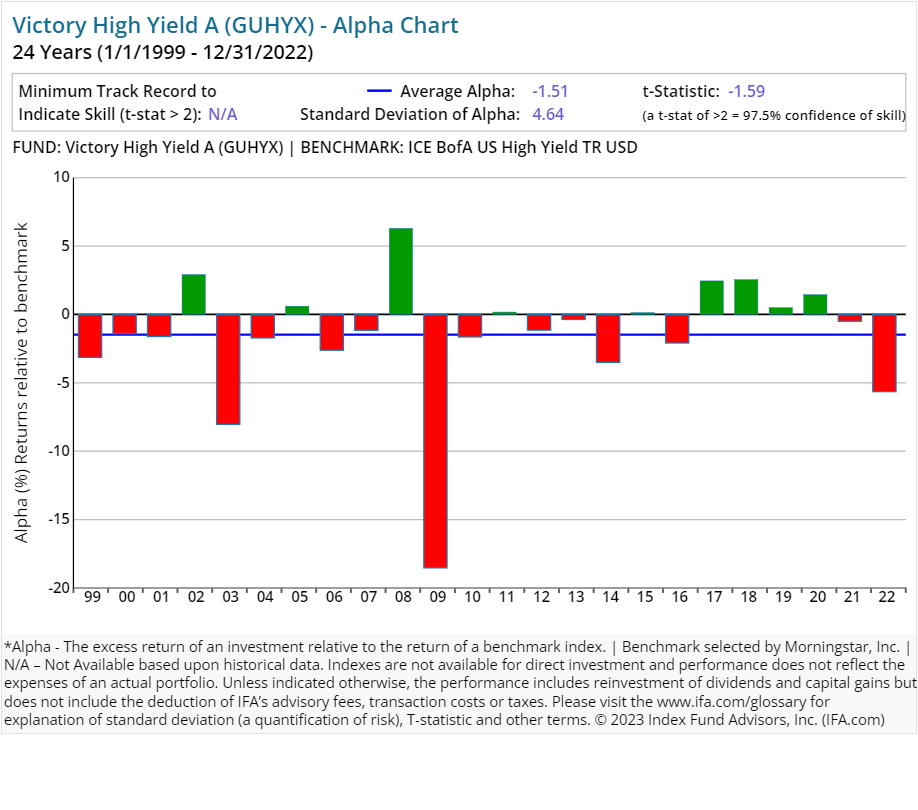
| Victory High Yield A | GUHYX | 88.00 | 1.02 | 0.25 | 2.25 | Fixed Income | US Fixed Income |
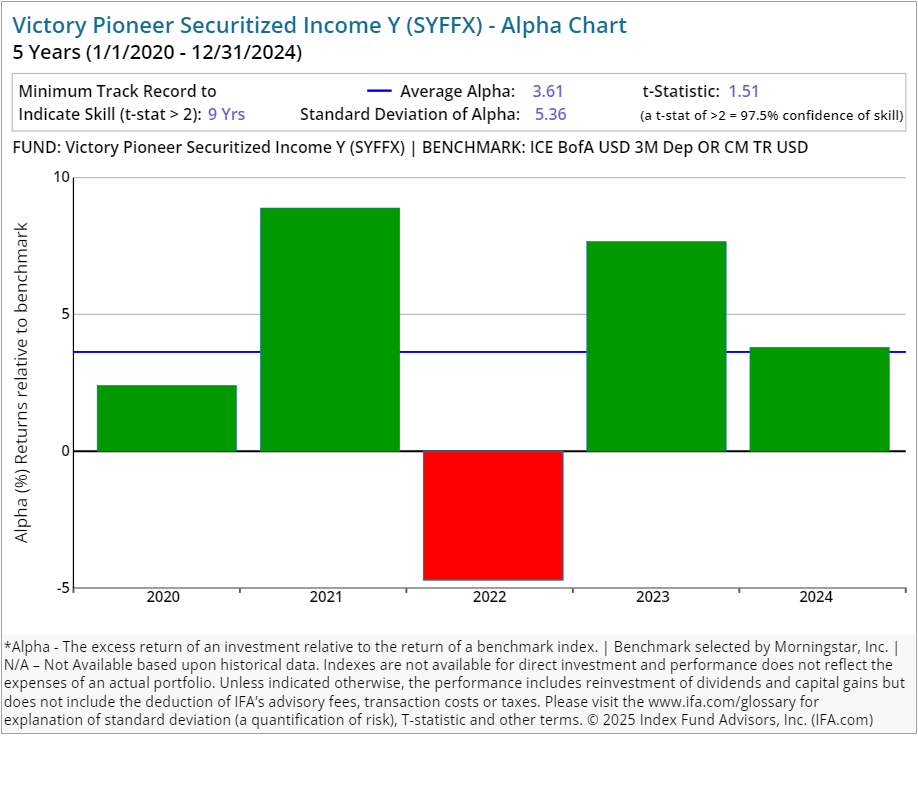
| Victory Pioneer Securitized Income Y | SYFFX | 30.00 | 0.65 | 0.00 | Fixed Income | US Fixed Income | |
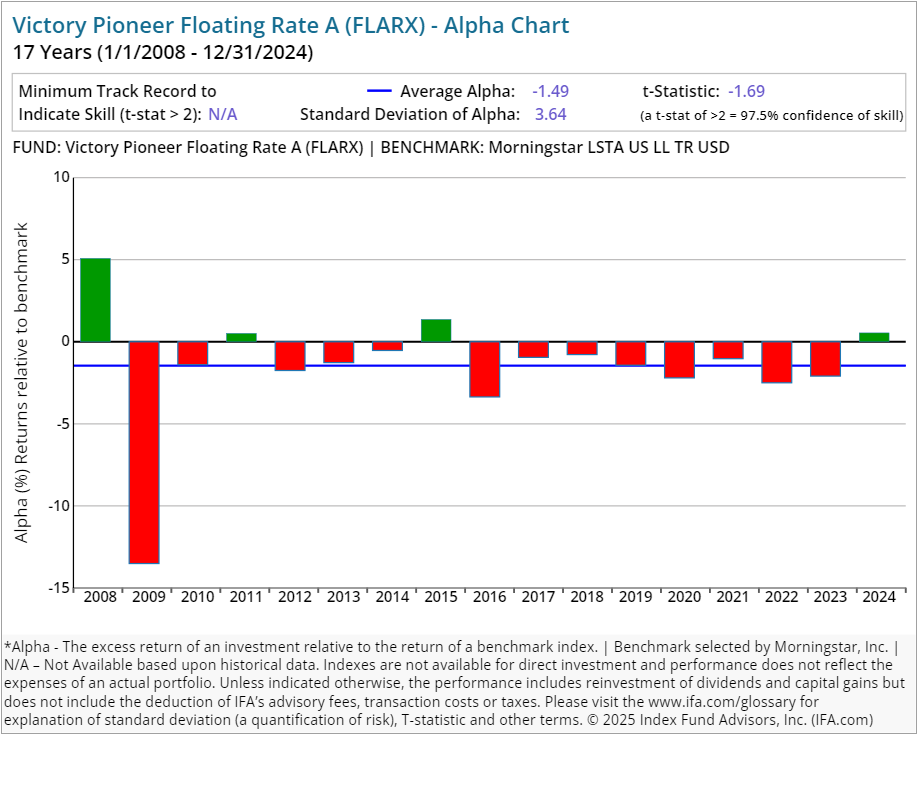
| Victory Pioneer Floating Rate A | FLARX | 64.00 | 1.08 | 0.25 | 4.50 | Fixed Income | US Fixed Income |
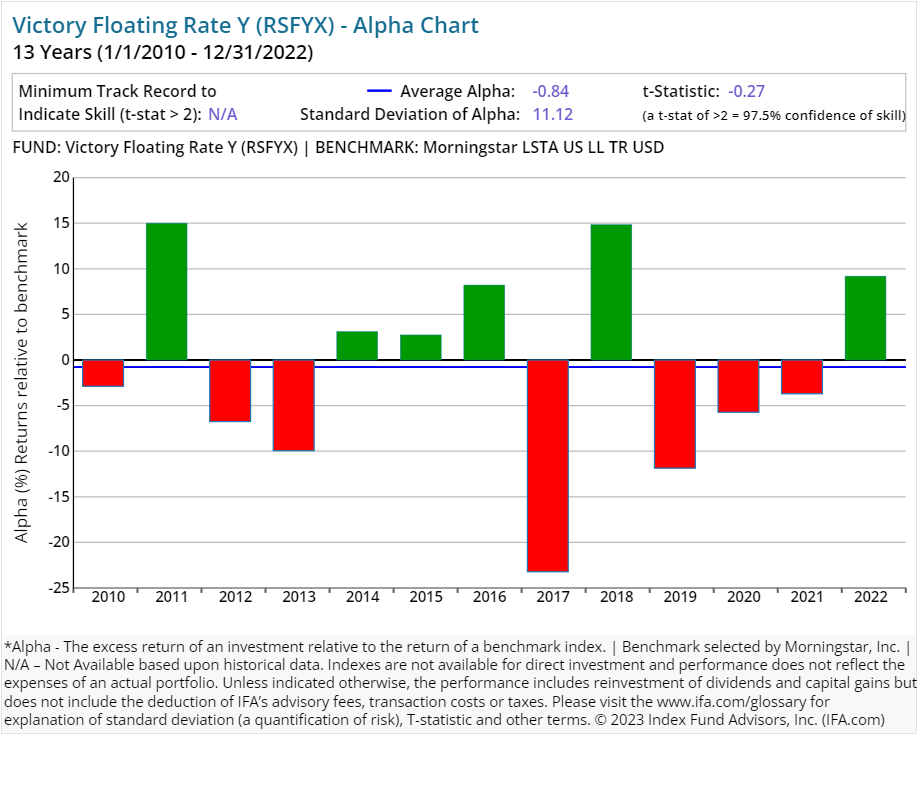
| Victory Floating Rate Y | RSFYX | 52.00 | 0.79 | 0.00 | Fixed Income | US Fixed Income |
On average, an investor who utilized an active equity strategy from Victory Capital experienced a 1.06% expense ratio. Similarly, an investor who utilized an active bond strategy from the company experienced a 0.69% expense ratio.
These expenses can have a substantial impact on an investor's overall accumulated wealth if they are not backed by superior performance. The average turnover ratios for active equity and bond strategies from Victory Capital were 55.80% and 39.86%, respectively. This implies an average holding period of 21.51 to 30.10 months.
Victory Capital's investment strategies tend to involve active portfolio management with relatively higher portfolio turnover compared to typical passive strategies. These turnover-related costs, while not itemized directly to the investor, are included as part of the overall calculations impacting fund performance and expenses.
By contrast, most index funds have very long holding periods — decades, in fact, thus deafening themselves to the random noise that accompanies short-term market movements, and focusing instead on the long-term. Again, turnover is a cost that is not easily itemized to the investor but is definitely embedded in the overall performance.
Performance Analysis
The next question we address is whether investors can expect superior performance in exchange for the higher costs associated with Victory Capital's implementation of active management. We compare each of its 90 strategies with data for five or more years against its Morningstar assigned benchmark to see just how well each has delivered on their perceived value proposition. We also use the oldest share class of each fund, which sometimes are older than its assigned benchmark. In those cases, comparisons can only be made for the length of time that the benchmark has data available.
We have included alpha charts for each of their current strategies at the bottom of this article. Here is what we found:
-
56.67% (51 of 90 funds) have underperformed their respective benchmarks or did not survive the period since inception.
-
43.33% (39 of 90 funds) have outperformed their respective benchmarks since inception, having delivered a positive alpha.
Here's the real kicker, however:
- 3.33% (3 of 90 funds) have outperformed the respective benchmarks consistently enough since inception to provide 97.5% confidence that such outperformance will persist as opposed to being based on random outcomes.
It's safe to say that the majority of funds offered by Victory Capital have not outperformed their Morningstar assigned benchmark. The inclusion of the statistical significance of alpha is key to this exercise, as it indicates which outcomes are due to a skill that is likely to repeat and those that are more likely due to a random-chance outcome.
Regression Analysis
How we define or choose a benchmark is extremely important. If we relied solely on commercial indexes assigned by Morningstar, then we may form a false conclusion that Victory Capital has the "secret sauce" as active managers.
Since Morningstar is limited in terms of trying to fit the best commercial benchmark with each fund in existence, there is of course going to be some error in terms of matching up proper characteristics such as average market capitalization or average price-to-earnings ratio.
A better way of controlling these possible discrepancies is to run multiple regressions where we account for the known dimensions (betas) of expected return in the U.S. (i.e., market, size, relative price, etc.) as identified by the Fama/French Three-Factor Model.
For example, if we were to look at all of the U.S.-based strategies from Victory Capital that've been around for the past 10 years, we could run multiple regressions to see what each fund's alpha looks like once we control for the multiple betas that are being systematically priced into the overall market.
The chart below displays the average alpha and standard deviation of that alpha for the past 10 years through 2024. Screening criteria include funds with holdings of 90% or greater in U.S. equities and uses the oldest available share classes.
As shown above, only four mutual funds had a positive excess return over the Fama/French Three-Factor Model. However, none of the equity funds reviewed produced a statistically significant level of alpha, based on a t-stat of 2.0 or greater. (For a review of how to calculate a fund's t-stat, see the section of this study that follows the individual Victory Capital alpha charts.)
Why is this important? A t-stat of the alpha which is 2.0 or greater would give an investor confidence that a manager's results would be attributable to skill and repeatable. A t-stat of less than 2.0 would indicate that a manager's performance was attributable more to luck.
Conclusion
Like many of the other largest financial institutions, a deep analysis into the performance of Victory Capital's lineup of mutual funds has yielded a not so surprising result: active management is likely to fail many investors. We conclude this is due to market efficiency, costs and increased competition in the financial services sector.
As we always like to remind investors, a more reliable investment strategy for capturing the returns of global markets is to buy, hold and rebalance a globally diversified portfolio of index funds.
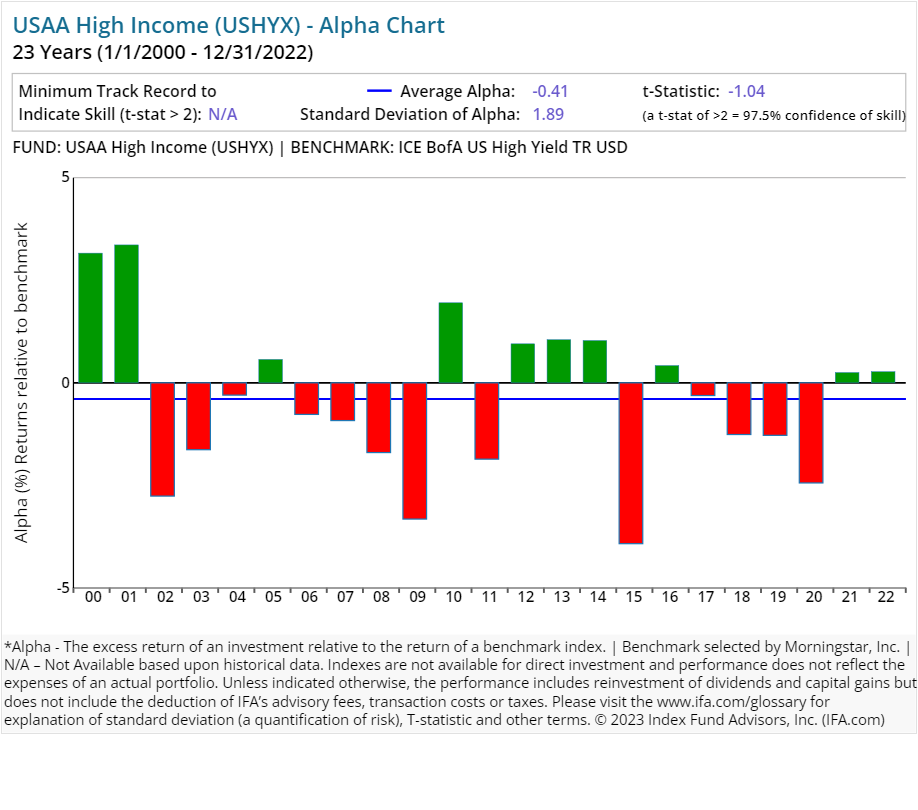
Below are the individual alpha charts for the existing Victory Capital mutual funds that have five years or more of a track record.


Here is a calculator to determine the t-stat. Don't trust an alpha or average return without one.
The Figure below shows the formula to calculate the number of years needed for a t-stat of 2. We first determine the excess return over a benchmark (the alpha) then determine the regularity of the excess returns by calculating the standard deviation of those returns. Based on these two numbers, we can then calculate how many years we need (sample size) to support the manager's claim of skill.
Footnotes:
1.) The Financial Times, "State Street's departing fund chief warns about consolidation trend," Dec. 20, 2022.
2.) Securities and Exchange Commission, Form S-1 for Victory Capital Holdings Inc., Jan. 11, 2018.


 X
X