In 1875, insurance agent John Fairfield Dryden opened his own business in Newark, N.J., focused on policies to cover burial-related costs. Since then, Prudential Financal has expanded to become one of the largest insurance carriers and asset managers in the world with $1.35 trillion in total assets under management (AUM). It oversees some $4 trillion of gross life insurance policies and employs more than 40,000 workers in 40-plus countries.1
Still, Prudential — a Fortune 500 company that trades on the New York Stock Exchange (NYSE: PRU) — in recent years has run into fierce competition in core insurance and asset management businesses. By late 2022, company executives had announced they were ahead of cost-cutting targets and "achieved $750 million in run-rate savings."
A bright spot over the years has been Prudential's Global Investment Management (PGIM) unit, which most recently had more than $1.5 trillion in AUM. By far the largest chunk of its asset management fees — about 44% at last count — came from public fixed-income products. Public equity funds and real estate accounted for 21% each, according to PGIM.
Prudential's investment management arm has been ranked within the top 20 in terms of global AUM and one of the three largest managers of real estate assets in the world, notes Morningstar. In its latest analysis of PGIM's prospects, the independent funds research firm adds "despite the significant scale, Prudential's total assets under management significantly trail that of BlackRock, Vanguard, Fidelity and other (leading asset-management) firms." 2
Also, Morningstar points out that Prudential's asset-management segment contributes a relatively small percentage (about 15%) of the insurer's overall earnings.
Many investors know about Prudential through its retirement business, which is broken into institutional and retirement plan strategies. The company estimated it worked with more than $350 billion worth of retirement accounts in the U.S. alone. Driven by market competition, however, Prudential sold its recordkeeping and administration operations to Empower in early 2022. This included backoffice services related to 401(k) plans and other defined contribution platforms — as well as traditional (defined benefit) pension plans.
Given such a changing backdrop, we thought it'd be worthwhile to put under our research microscope Prudential's family of active mutual funds. This analysis is part of our ongoing Deeper Look series, which investigates claims by managers of peer performance superiority by holding them to a higher standard — i.e., how they've done over longer periods against their respective indexes.
Controlling for Survivorship Bias
It's important for investors to understand the idea of survivorship bias. While there are 53 active mutual funds with five or more years of performance-related data currently offered by Prudential, it doesn't necessarily mean these are the only strategies this company has ever managed. In fact, there are 39 mutual funds that no longer exist. This can be for a variety of reasons including poor performance or the fact that they were merged with another fund. We will show what their aggregate performance looks like shortly.
Fees & Expenses
Let's first examine the costs associated with Prudential's surviving 53 strategies. It should go without saying that if investors are paying a premium for investment "expertise," then they should be receiving above average results consistently over time. The alternative would be to simply accept a market's return, less a significantly lower fee, via an index fund.
The costs we examine include expense ratios, sales loads and 12b-1 marketing fees for Class A shares (front-end load), Class B shares (back-end load) and Class C shares (level load). These are considered the "hard" costs that investors incur. Prospectuses, however, do not reflect the trading costs associated with mutual funds.
Commissions and market impact costs are real expenses associated with implementing a particular investment strategy and can vary depending on the frequency and size of the trades executed by portfolio managers.
We can estimate the costs associated with an investment strategy by looking at its annual turnover ratio. For example, a turnover ratio of 100% means that the portfolio manager turns over the entire portfolio in one year. This is considered an active approach, and investors holding these funds in taxable accounts will likely incur a higher exposure to tax liabilities, such as short- and long-term capital gains distributions, than those incurred by passively managed funds.
The table below details the hard costs as well as the turnover ratio for all 53 surviving active funds offered by Prudential that have at least five years of complete performance history. You can search this page for a symbol or name by using Control F in Windows or Command F on a Mac. Then click the link to see the Alpha Chart. Also, remember that this is what is considered an in-sample test; the next level of analysis is to do an out-of-sample test (for more information see here).
| Fund Name | Ticker | Turnover Ratio % | Prospectus Net Expense Ratio | 12b-1 Fee | Deferred Load | Max Front Load | Global Broad Category Group | Global Category |
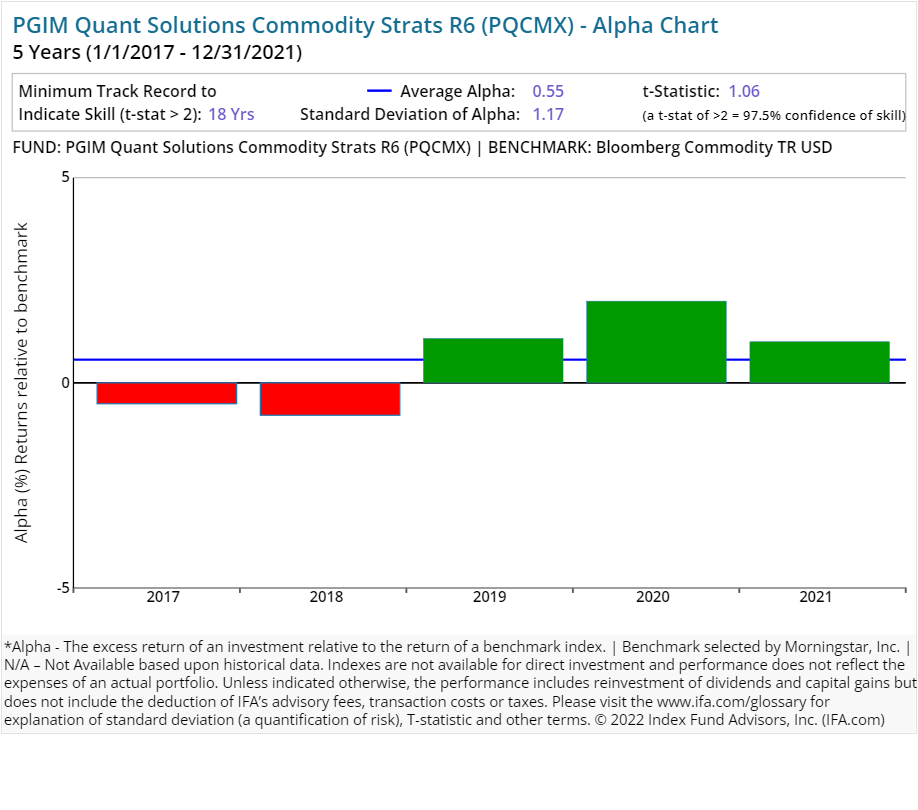
| PGIM Quant Solutions Commodity Strats R6 | PQCMX | 0.00 | 0.70 | Commodities | Commodities Broad Basket | |||
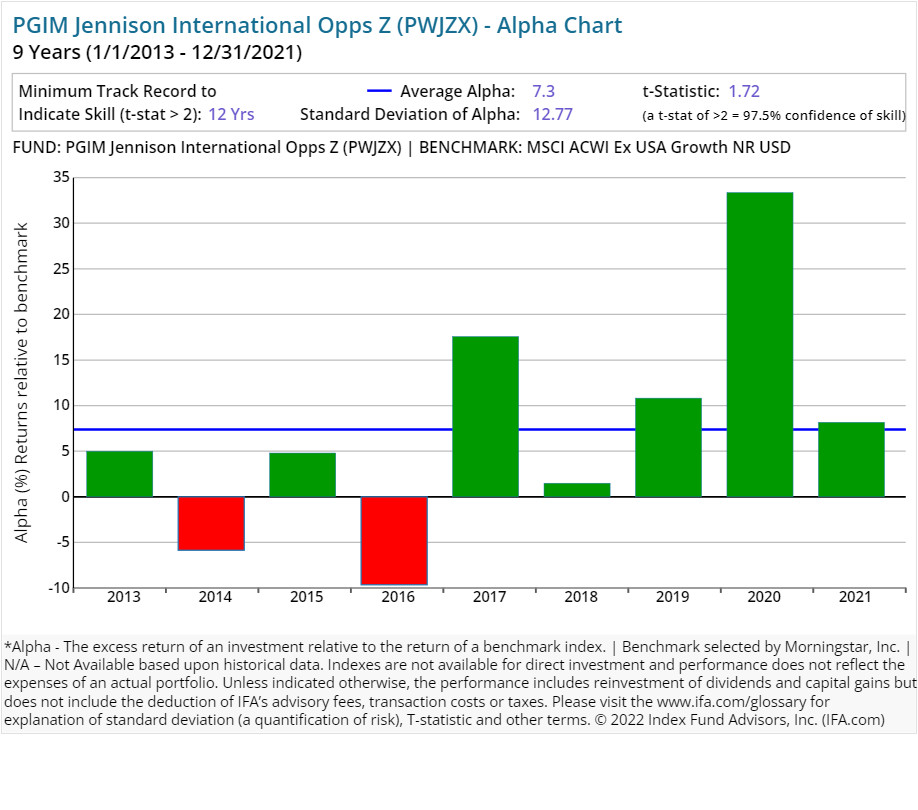
| PGIM Jennison International Opps Z | PWJZX | 44.00 | 0.90 | Equity | Global Equity Large Cap | |||
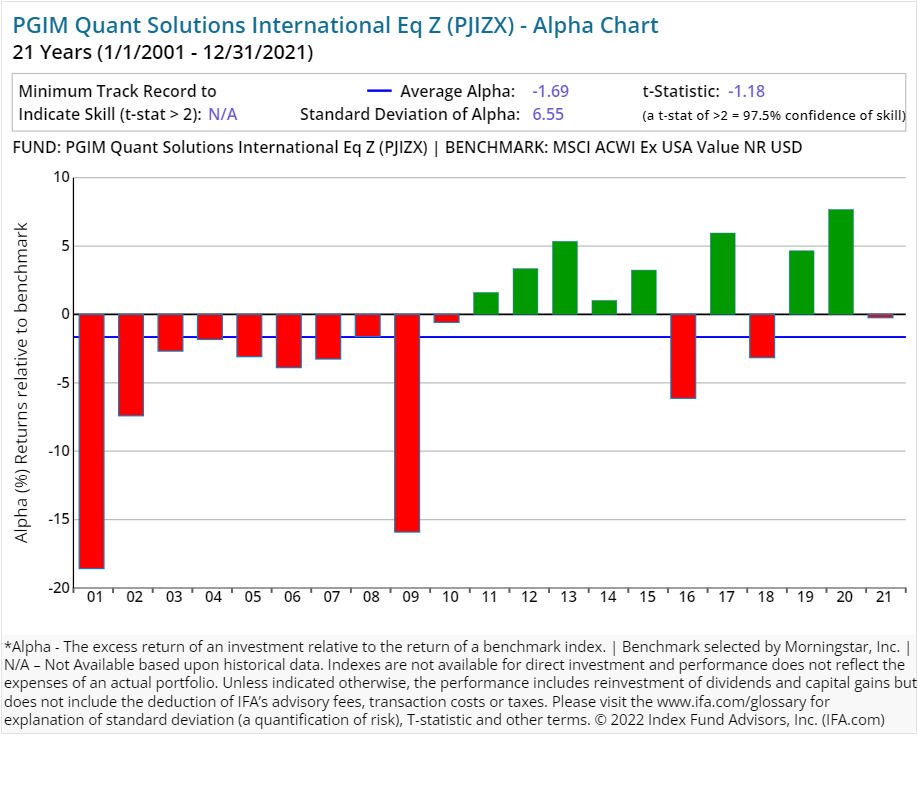
| PGIM Quant Solutions International Eq Z | PJIZX | 111.00 | 1.01 | Equity | Global Equity Large Cap | |||
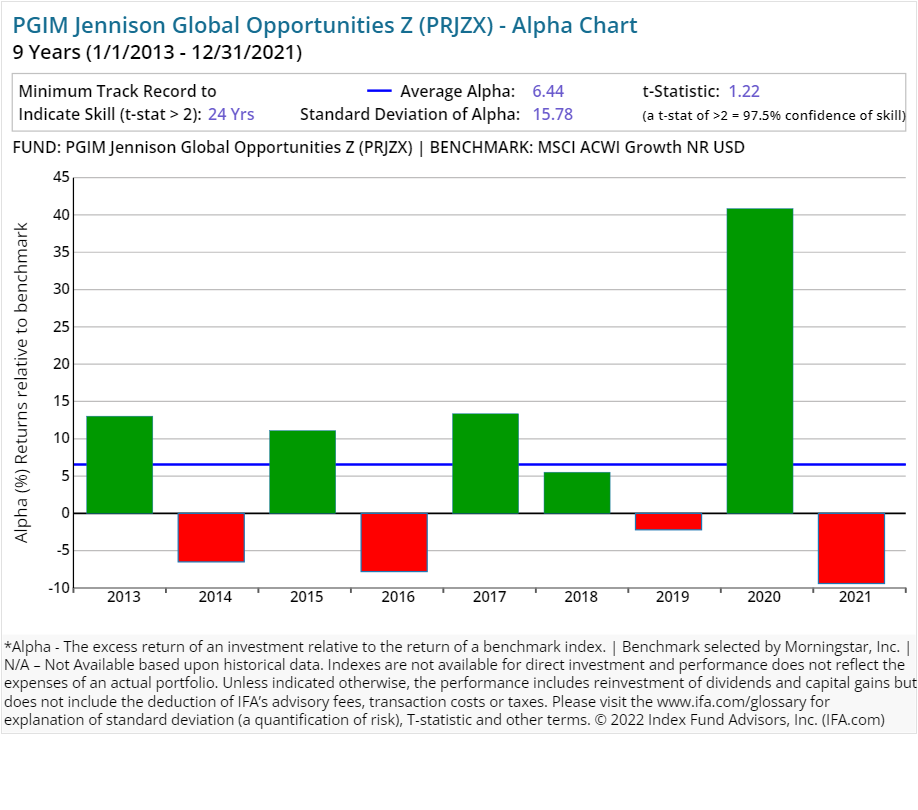
| PGIM Jennison Global Opportunities Z | PRJZX | 66.00 | 0.92 | Equity | Global Equity Large Cap | |||
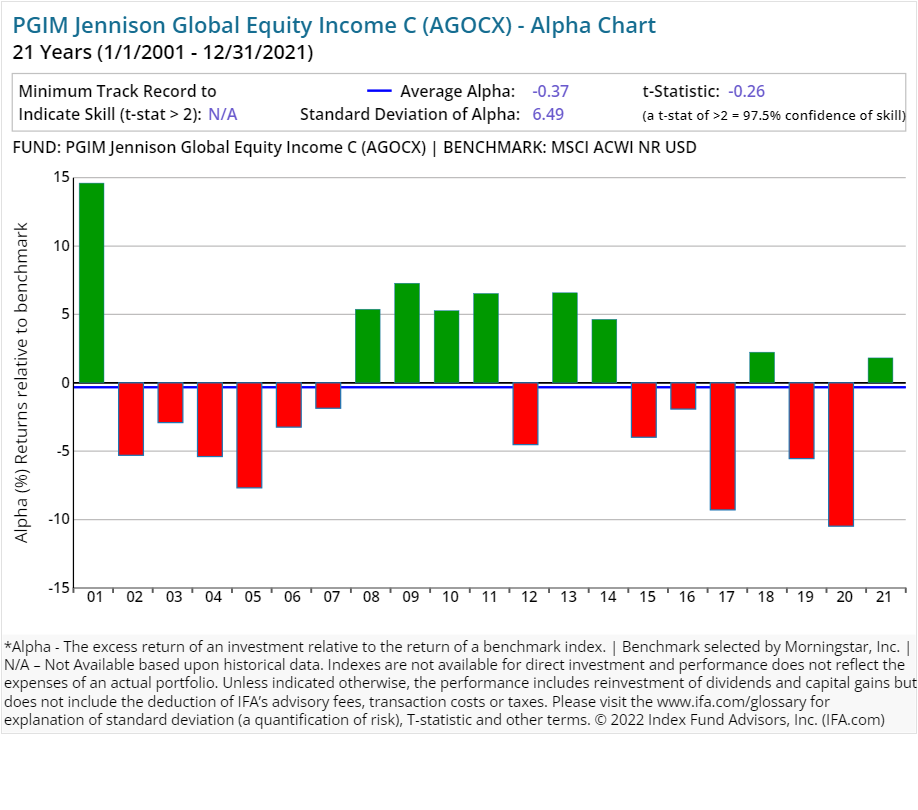
| PGIM Jennison Global Equity Income C | AGOCX | 6.00 | 2.10 | 1.00 | 1.00 | Equity | Global Equity Large Cap | |
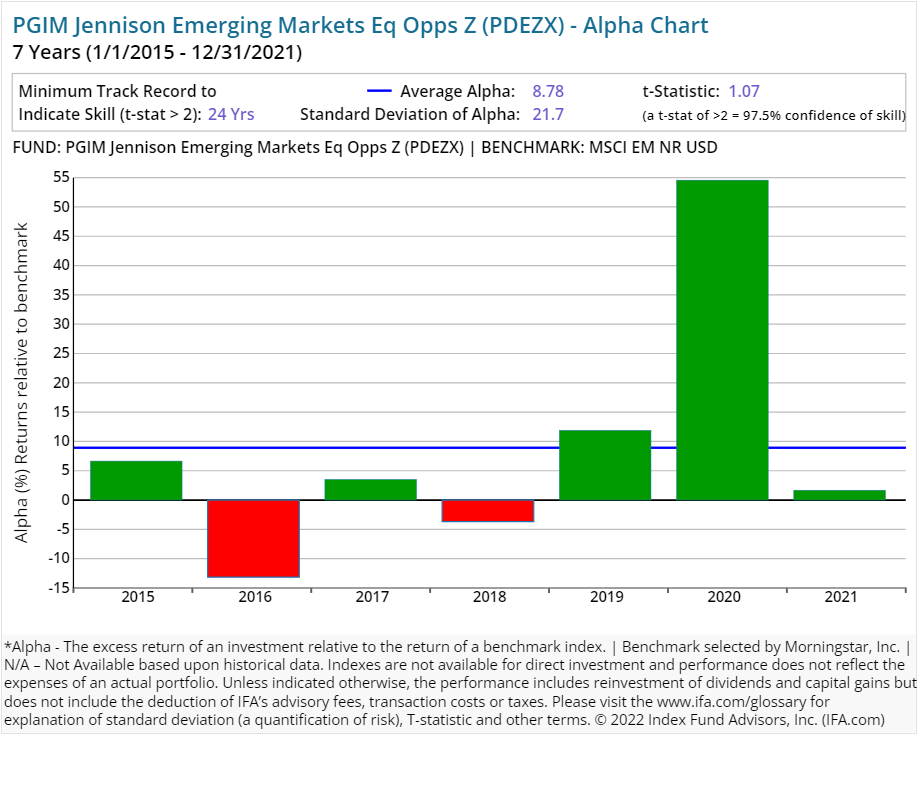
| PGIM Jennison Emerging Markets Eq Opps Z | PDEZX | 70.00 | 1.05 | Equity | Global Emerging Markets Equity | |||
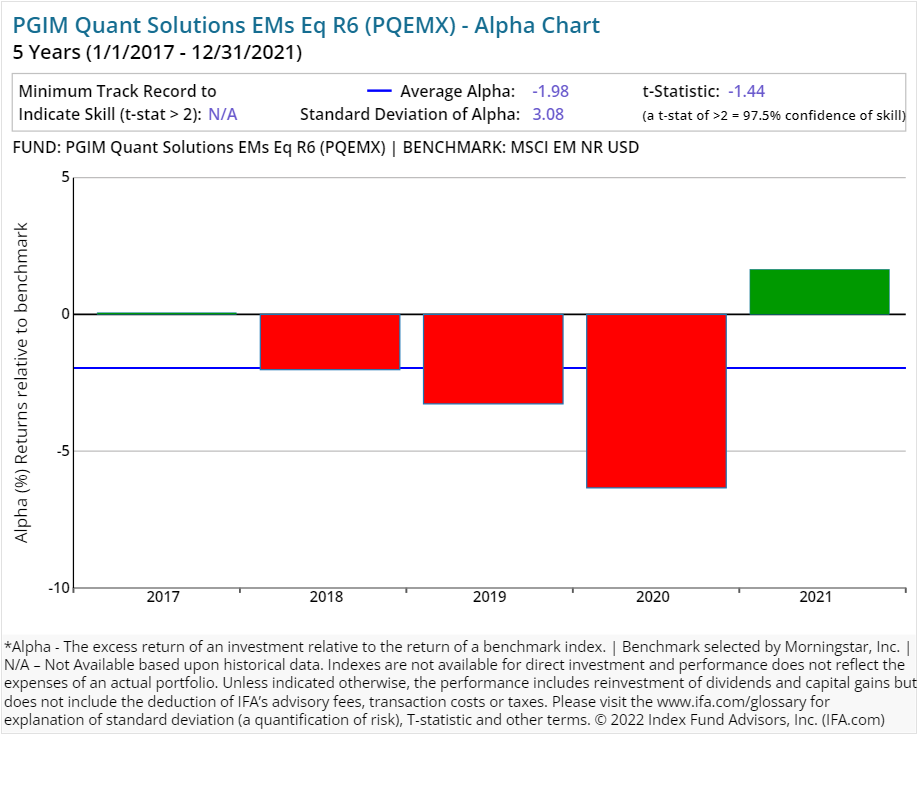
| PGIM Quant Solutions EMs Eq R6 | PQEMX | 96.00 | 1.20 | Equity | Global Emerging Markets Equity | |||
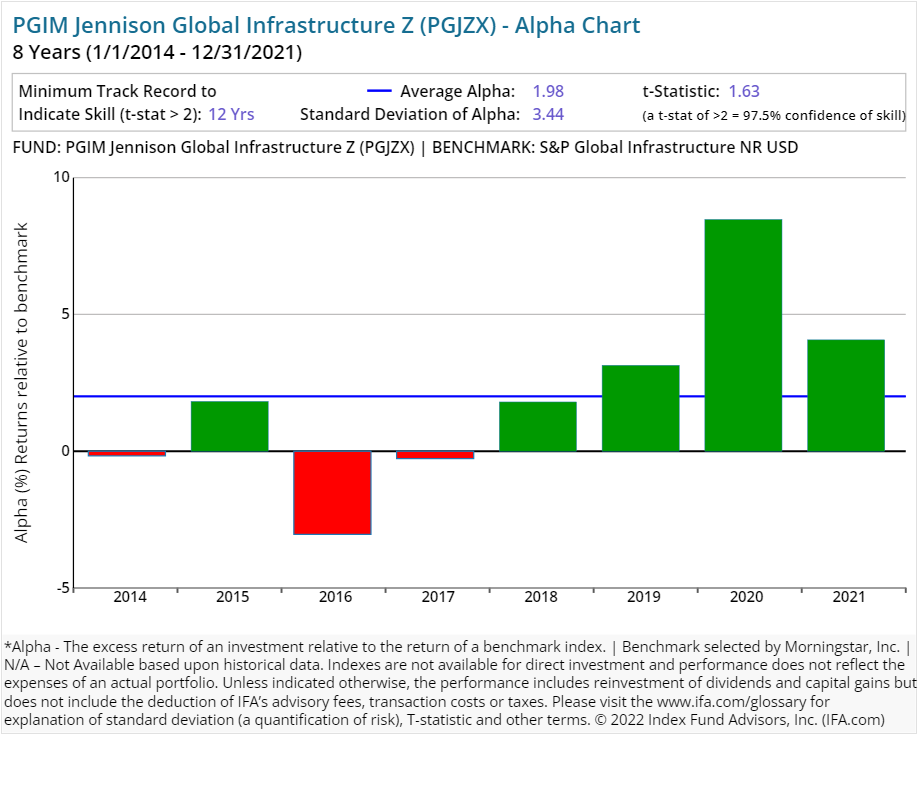
| PGIM Jennison Global Infrastructure Z | PGJZX | 80.00 | 1.17 | Equity | Infrastructure Sector Equity | |||
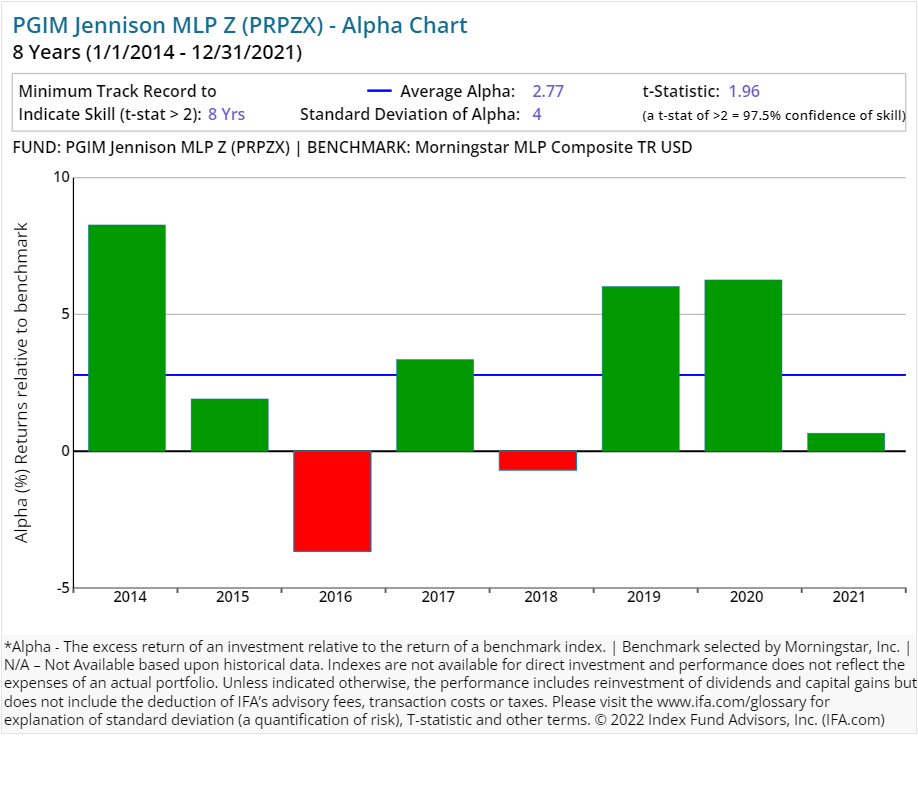
| PGIM Jennison Energy Infrastructure Z | PRPZX | 70.00 | 1.18 | Equity | Energy Sector Equity | |||
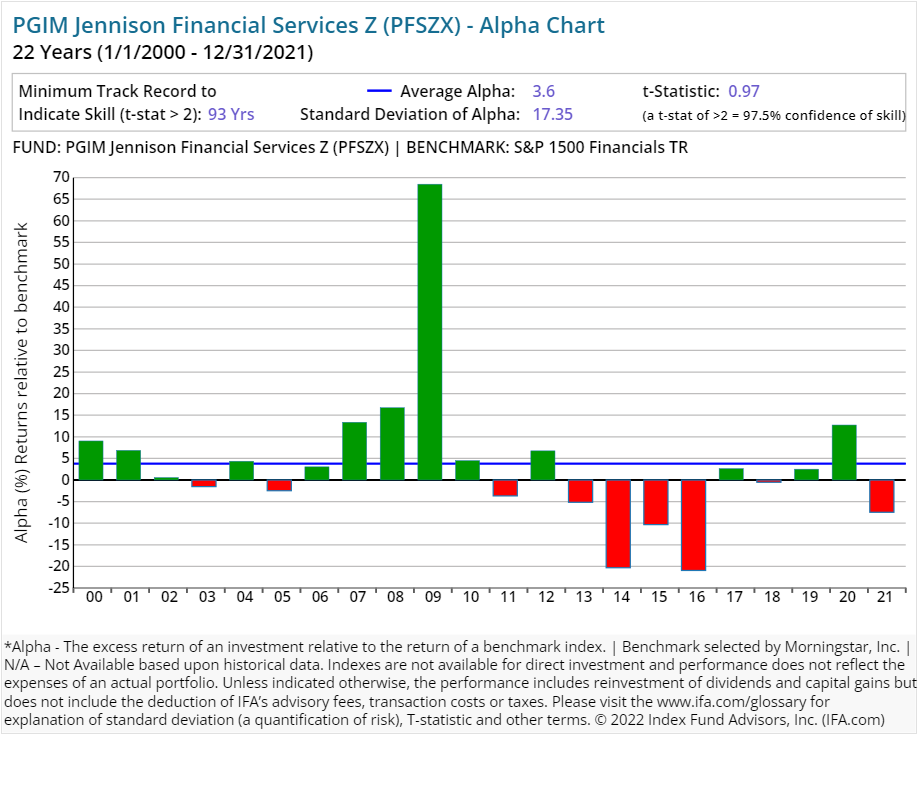
| PGIM Jennison Financial Services Z | PFSZX | 24.00 | 1.05 | Equity | Financials Sector Equity | |||
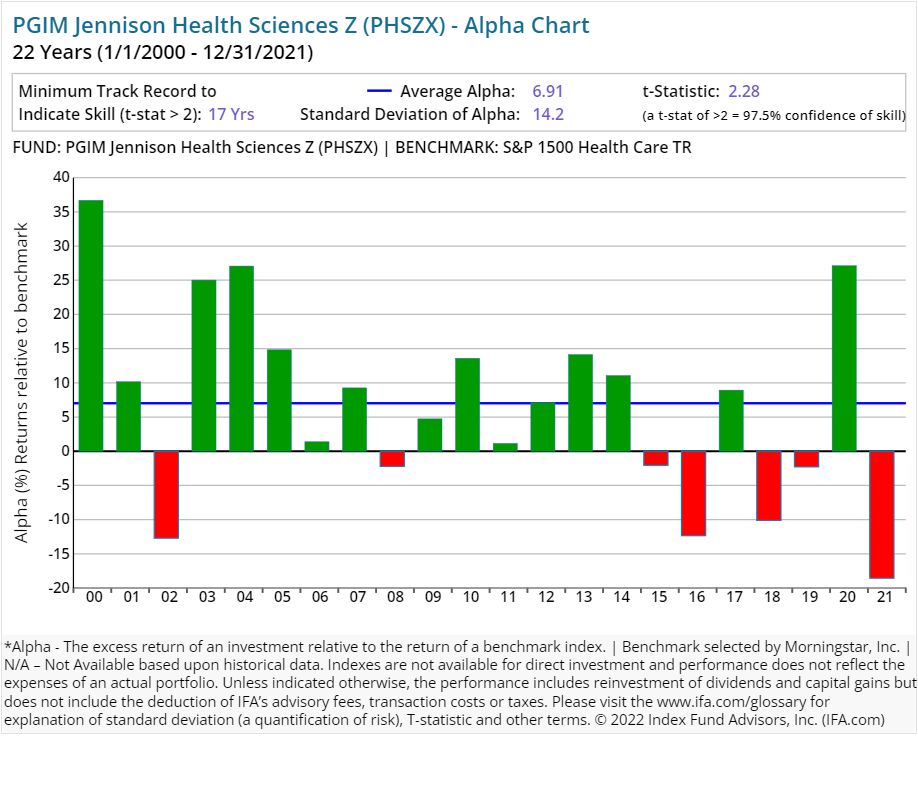
| PGIM Jennison Health Sciences Z | PHSZX | 79.00 | 0.86 | Equity | Healthcare Sector Equity | |||
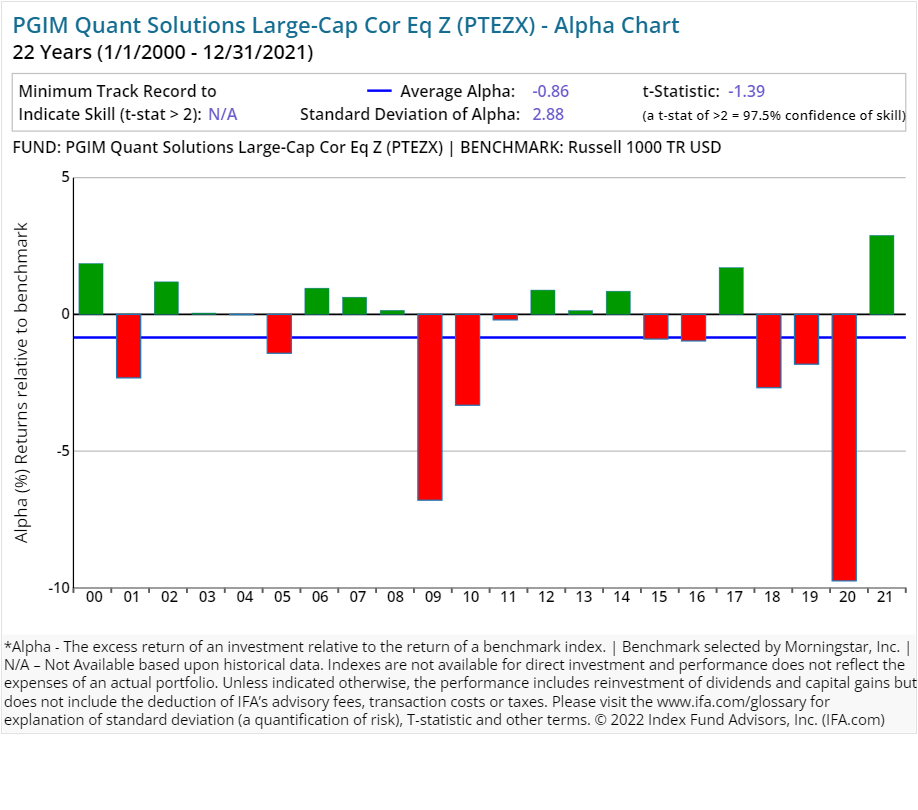
| PGIM Quant Solutions Large-Cap Cor Eq Z | PTEZX | 113.00 | 0.45 | Equity | US Equity Large Cap Blend | |||
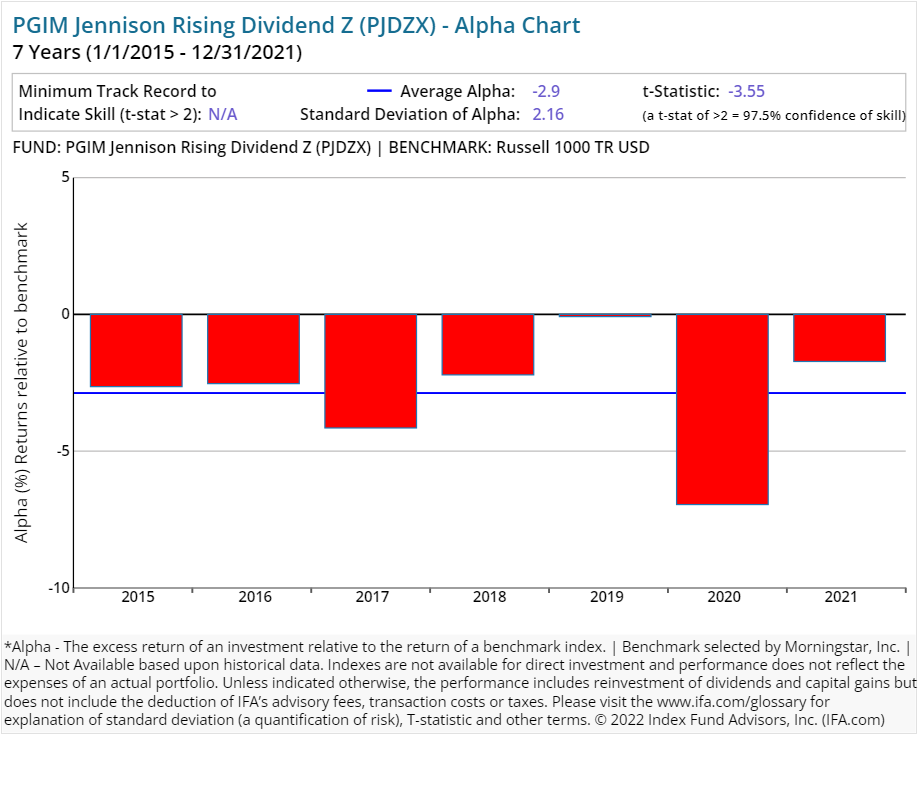
| PGIM Jennison Rising Dividend Z | PJDZX | 50.00 | 1.04 | Equity | US Equity Large Cap Blend | |||
| PGIM Real Estate Income Z | PRKZX | 112.00 | 1.10 | Equity | Real Estate Sector Equity | |||
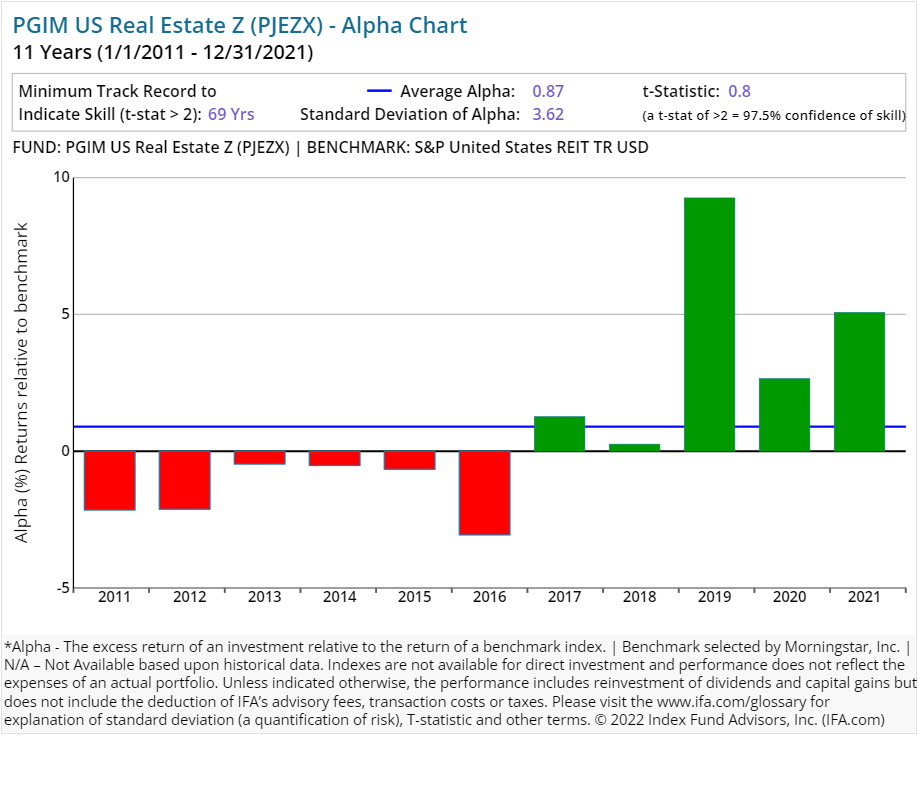
| PGIM US Real Estate Z | PJEZX | 118.00 | 1.00 | Equity | Real Estate Sector Equity | |||
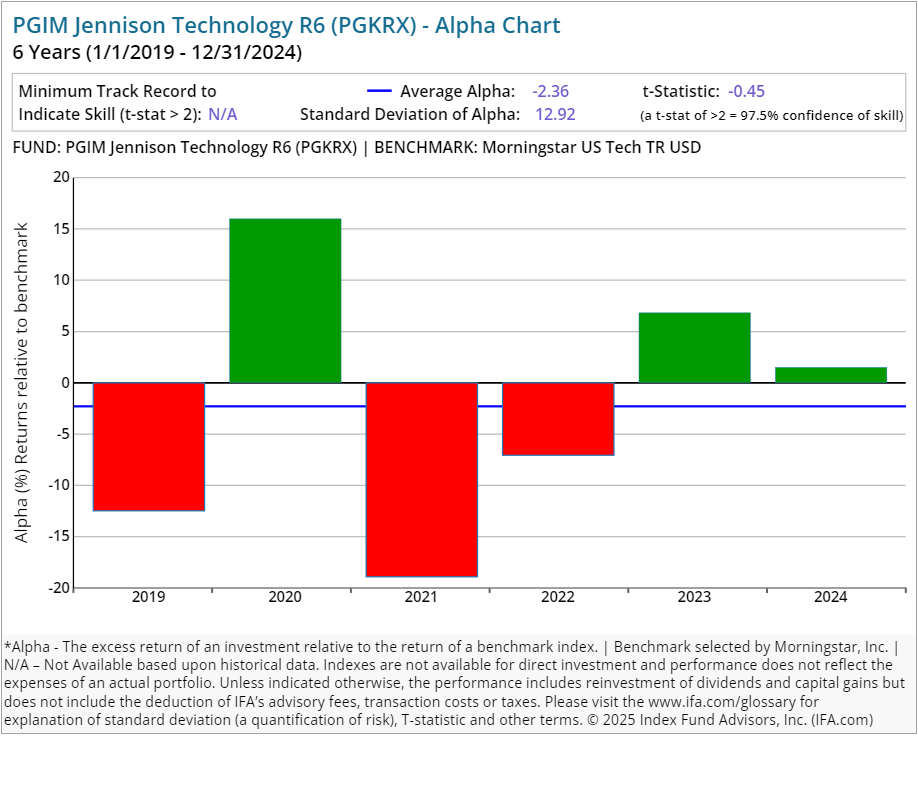
| PGIM Jennison Technology R6 | PGKRX | 55.00 | 0.80 | Equity | Technology Sector Equity | |||
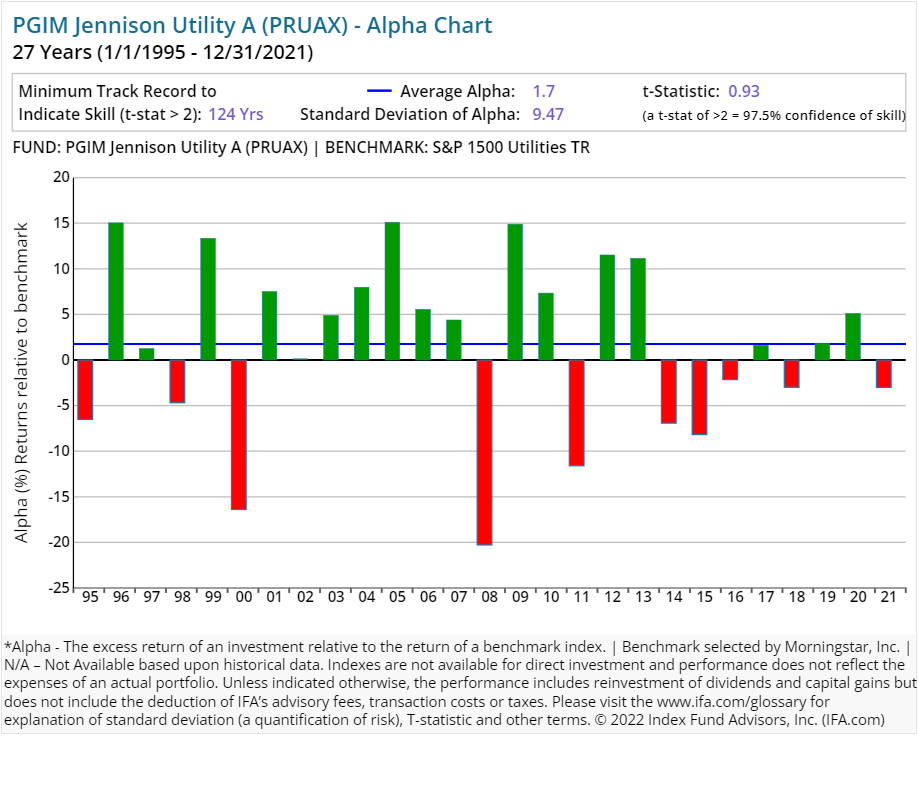
| PGIM Jennison Utility A | PRUAX | 47.00 | 0.82 | 0.30 | 5.50 | Equity | Utilities Sector Equity | |
| PGIM Jennison Growth A | PJFAX | 37.00 | 0.97 | 0.30 | 5.50 | Equity | US Equity Large Cap Growth | |
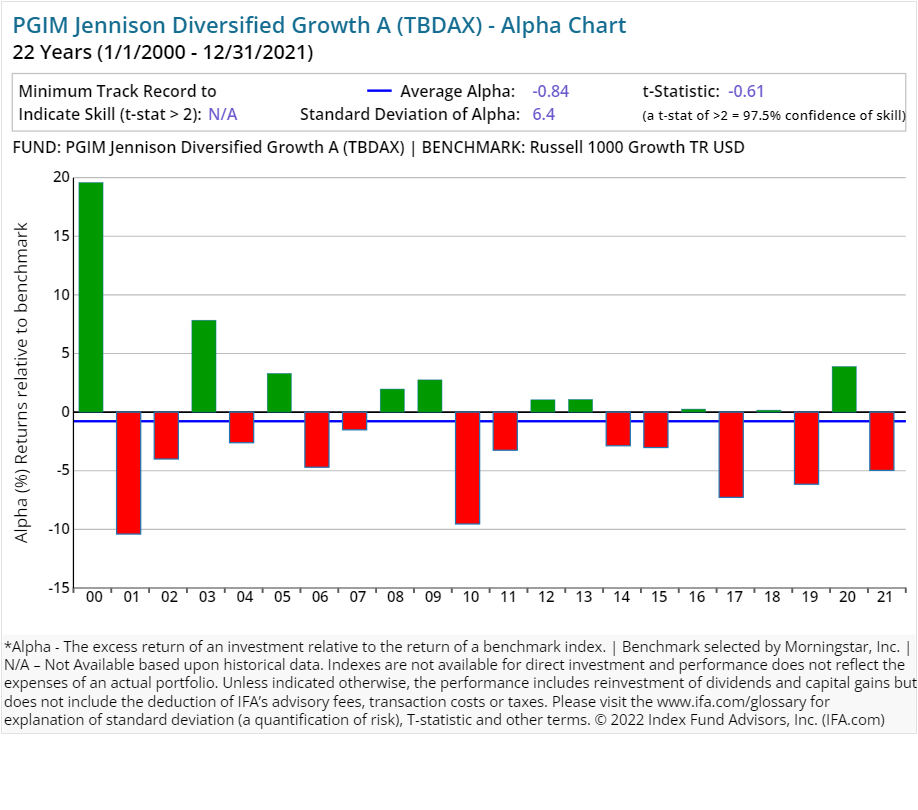
| PGIM Jennison Diversified Growth A | TBDAX | 147.00 | 0.82 | 0.30 | 5.50 | Equity | US Equity Large Cap Growth | |
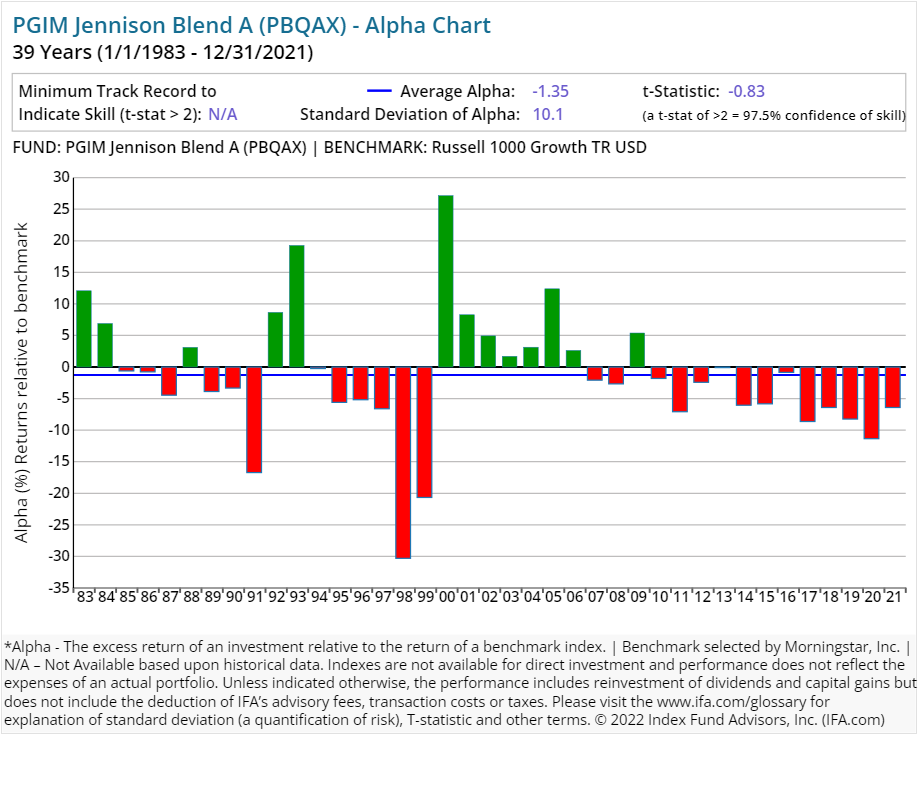
| PGIM Jennison Blend A | PBQAX | 47.00 | 0.93 | 0.30 | 5.50 | Equity | US Equity Large Cap Growth | |
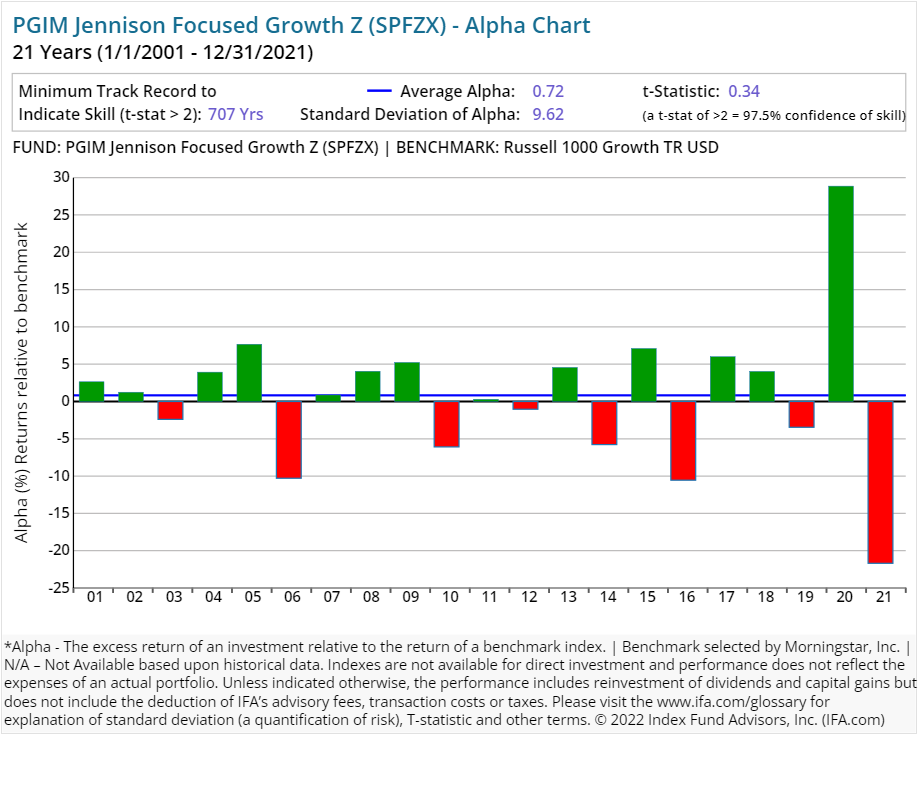
| PGIM Jennison Focused Growth Z | SPFZX | 33.00 | 0.75 | Equity | US Equity Large Cap Growth | |||
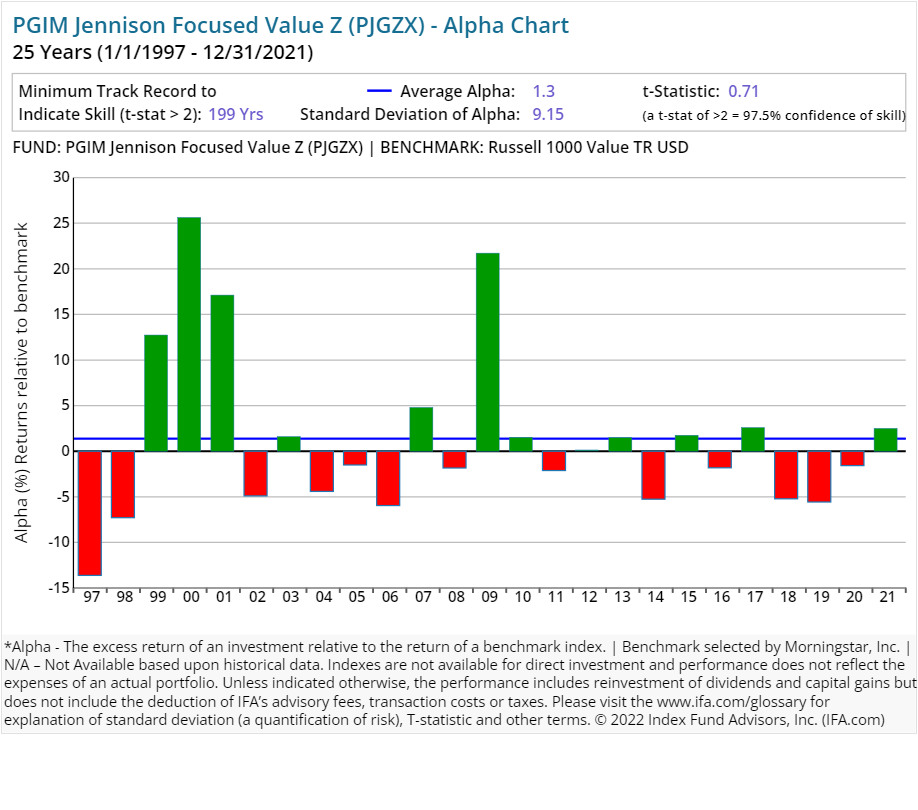
| PGIM Jennison Focused Value Z | PJGZX | 42.00 | 0.75 | Equity | US Equity Large Cap Value | |||
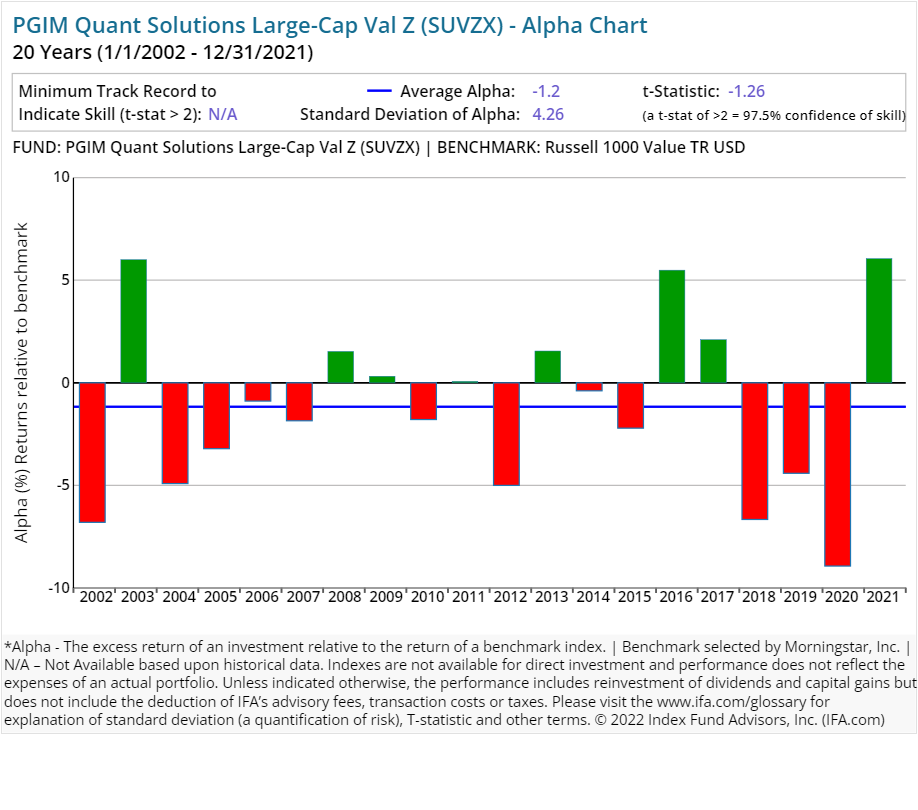
| PGIM Quant Solutions Large-Cap Val Z | SUVZX | 96.00 | 0.79 | Equity | US Equity Large Cap Value | |||
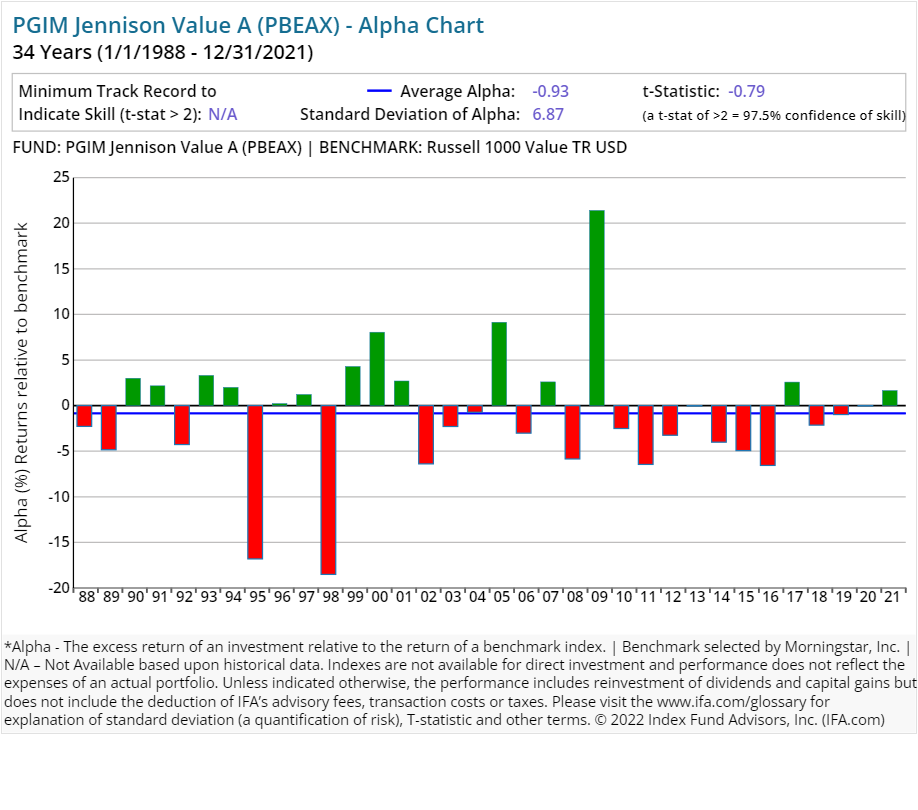
| PGIM Jennison Value A | PBEAX | 29.00 | 0.87 | 0.30 | 5.50 | Equity | US Equity Large Cap Value | |
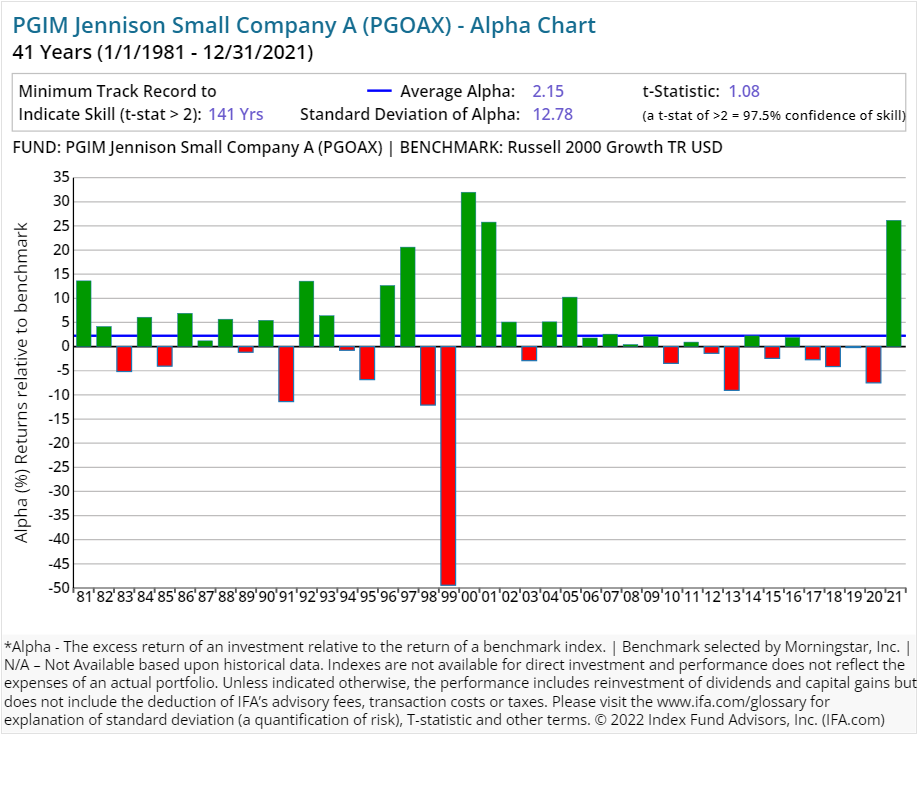
| PGIM Jennison Small Company A | PGOAX | 66.00 | 1.13 | 0.30 | 5.50 | Equity | US Equity Small Cap | |
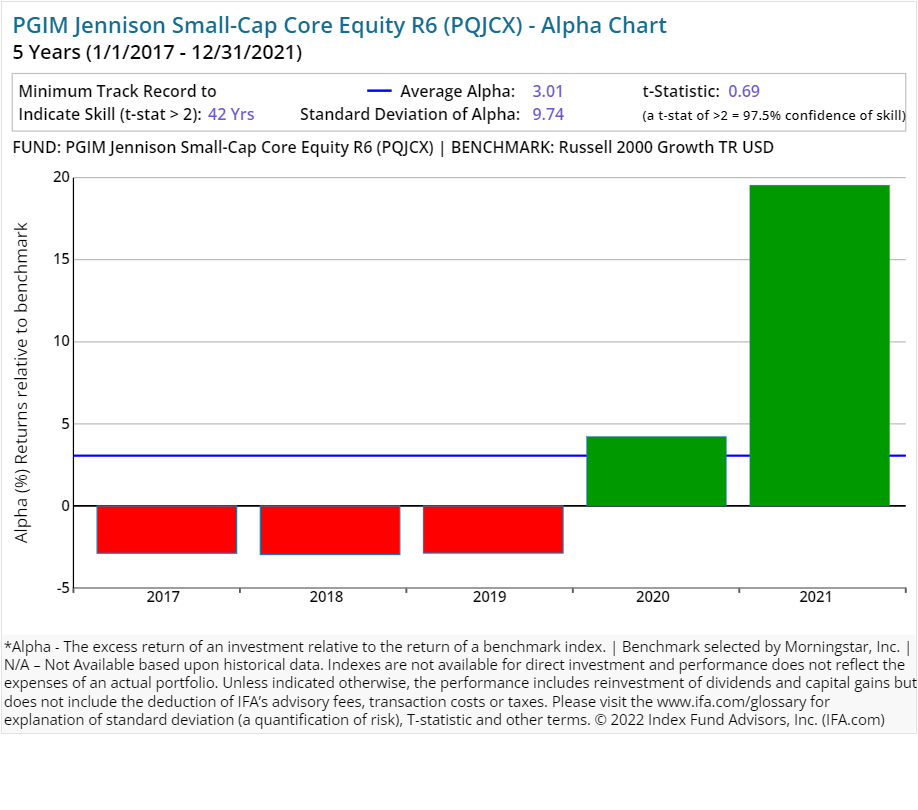
| PGIM Jennison Small-Cap Core Equity R6 | PQJCX | 87.00 | 0.95 | Equity | US Equity Small Cap | |||
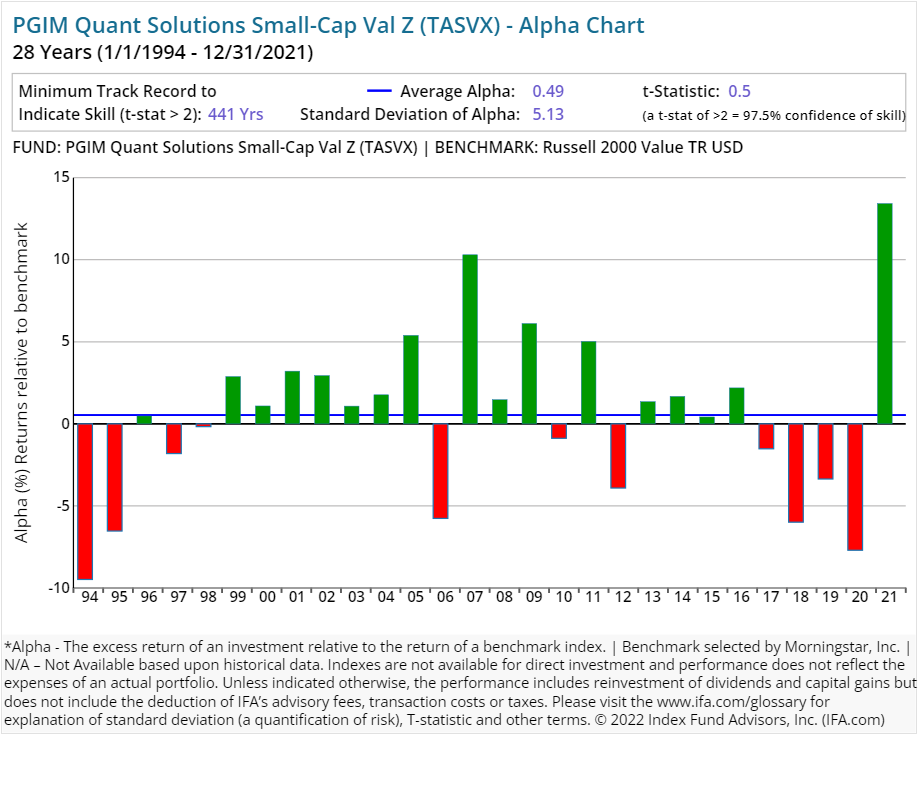
| PGIM Quant Solutions Small-Cap Val Z | TASVX | 78.00 | 0.79 | Equity | US Equity Small Cap | |||
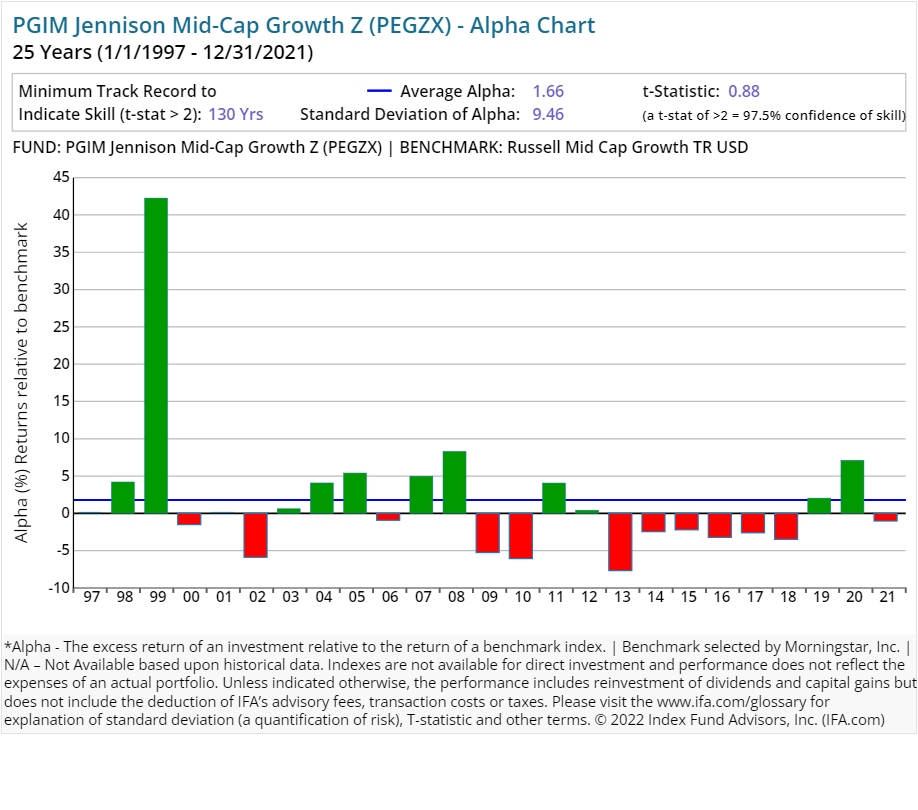
| PGIM Jennison Mid-Cap Growth Z | PEGZX | 61.00 | 0.72 | Equity | US Equity Mid Cap | |||
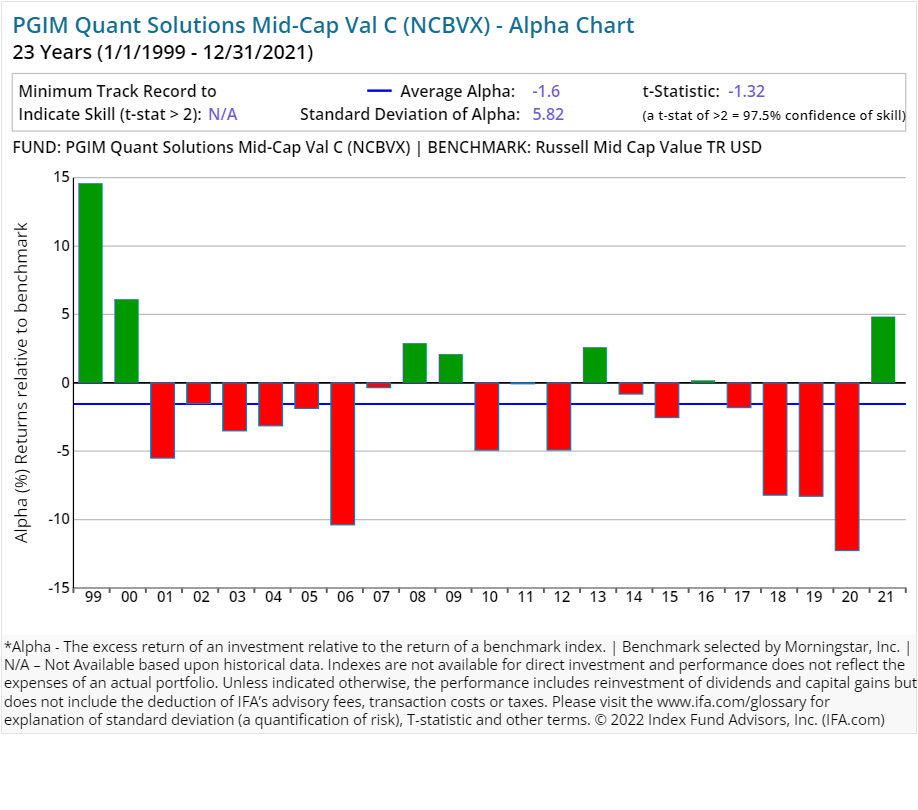
| PGIM Quant Solutions Mid-Cap Val C | NCBVX | 97.00 | 1.95 | 1.00 | 1.00 | Equity | US Equity Mid Cap | |
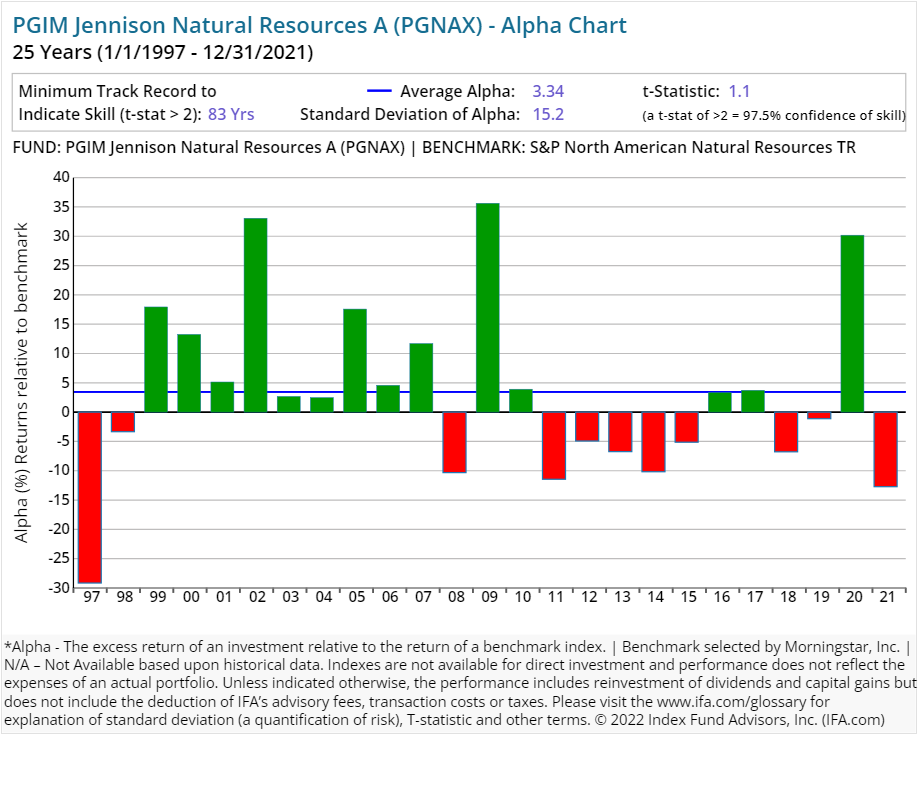
| PGIM Jennison Natural Resources A | PGNAX | 31.00 | 1.26 | 0.30 | 5.50 | Equity | Natural Resources Sector Equity | |
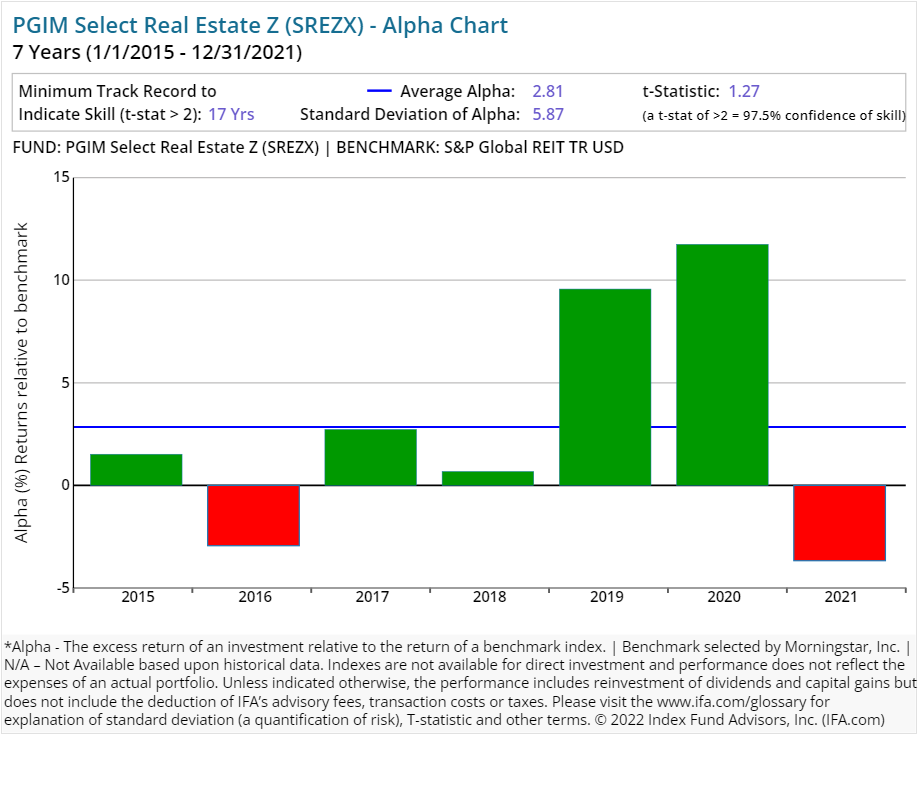
| PGIM Select Real Estate Z | SREZX | 142.00 | 1.06 | Equity | Real Estate Sector Equity | |||
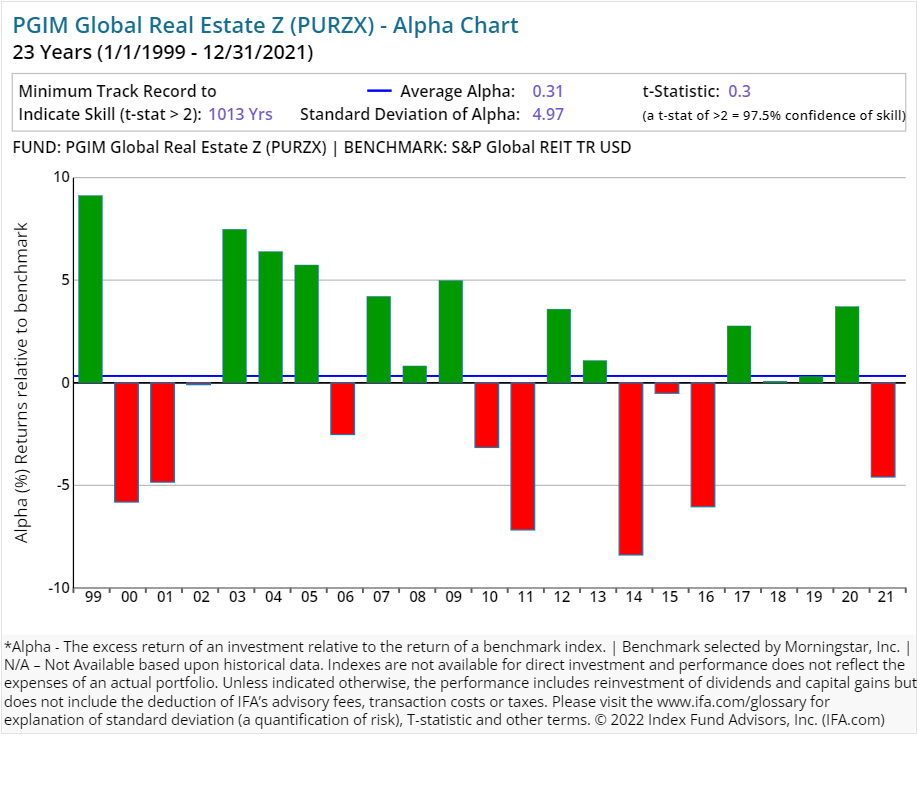
| PGIM Global Real Estate Z | PURZX | 95.00 | 0.97 | Equity | Real Estate Sector Equity | |||
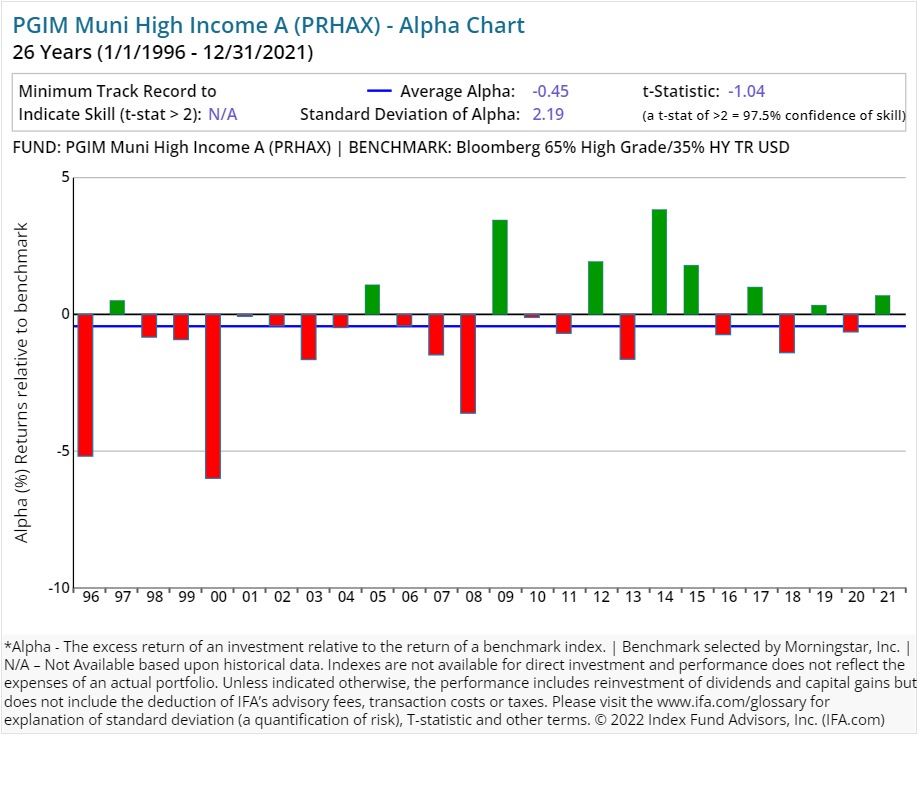
| PGIM Muni High Income A | PRHAX | 68.00 | 0.81 | 0.25 | 3.25 | Fixed Income | US Municipal Fixed Income | |
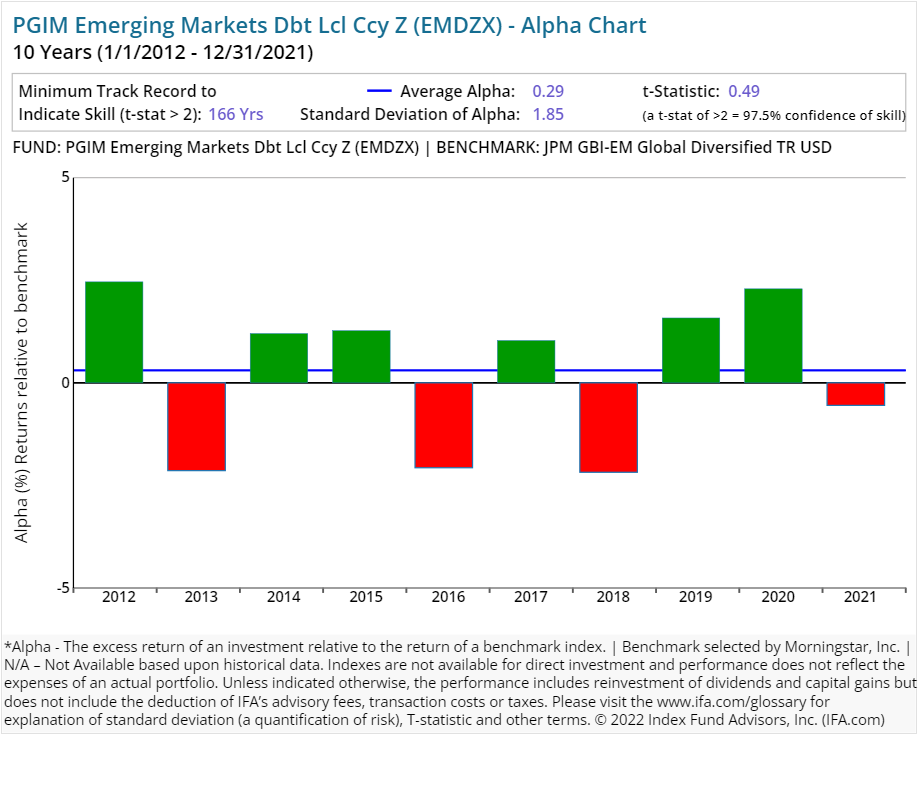
| PGIM Emerging Markets Dbt Lcl Ccy Z | EMDZX | 43.00 | 0.72 | Fixed Income | Emerging Markets Fixed Income | |||
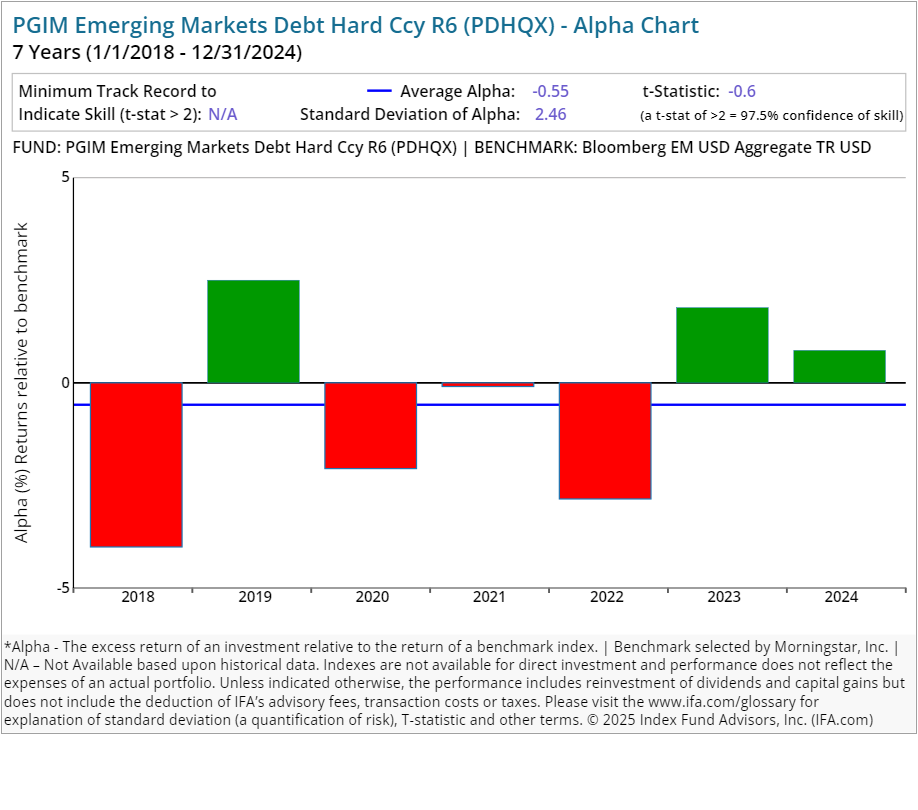
| PGIM Emerging Markets Debt Hard Ccy R6 | PDHQX | 28.00 | 0.65 | Fixed Income | Emerging Markets Fixed Income | |||
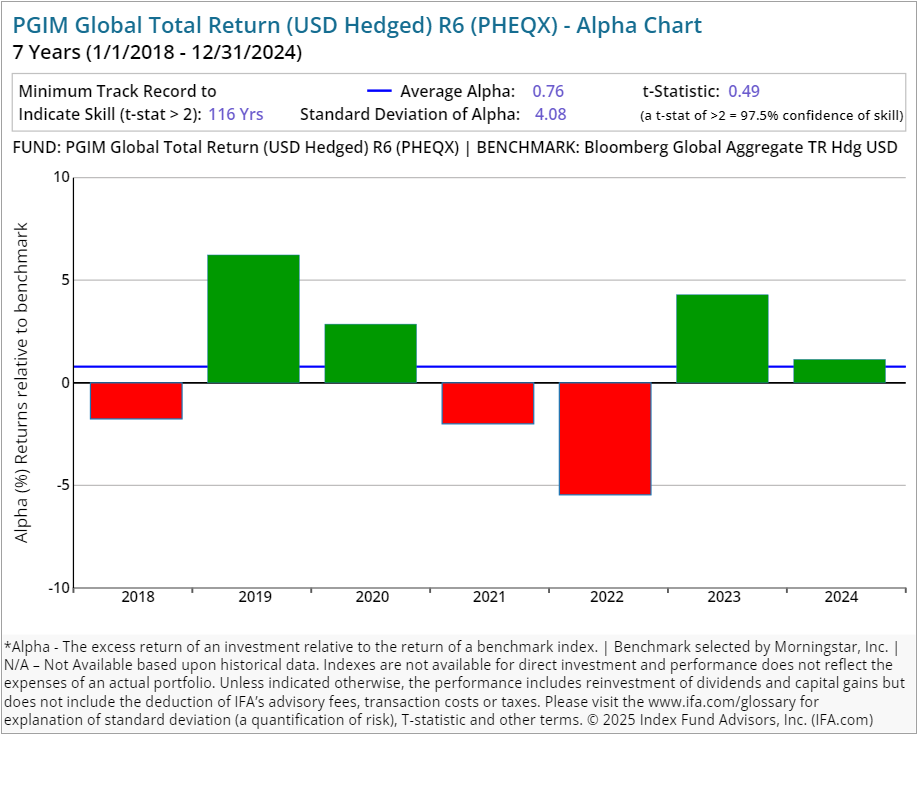
| PGIM Global Total Return (USD Hedged) R6 | PHEQX | 52.00 | 0.60 | Fixed Income | Global Fixed Income | |||
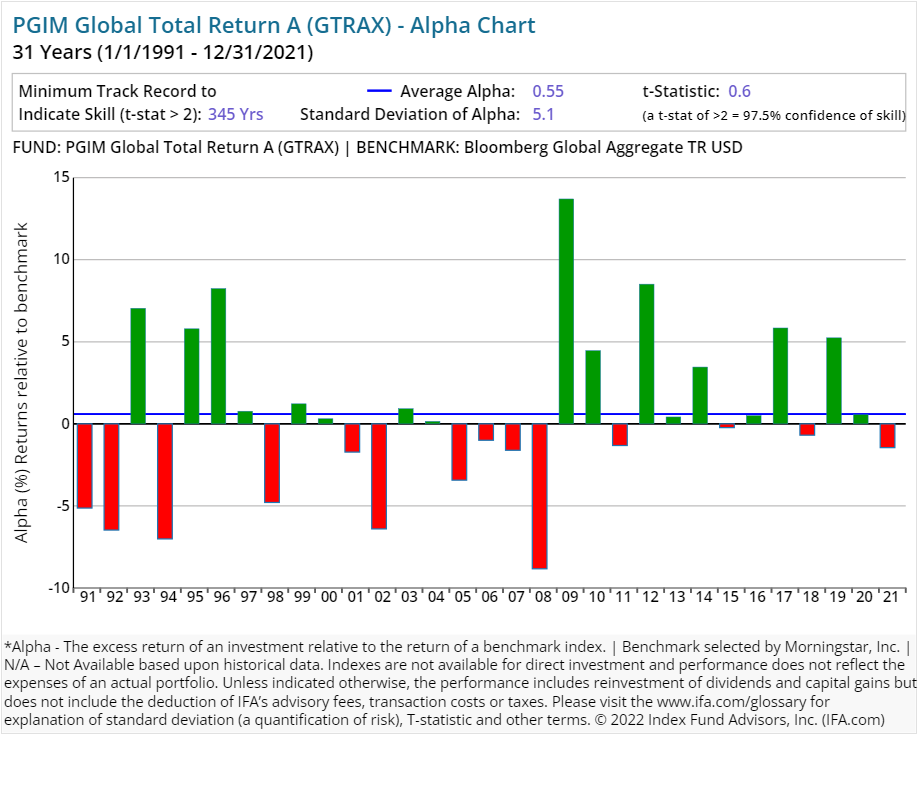
| PGIM Global Total Return A | GTRAX | 35.00 | 0.88 | 0.25 | 3.25 | Fixed Income | Global Fixed Income | |
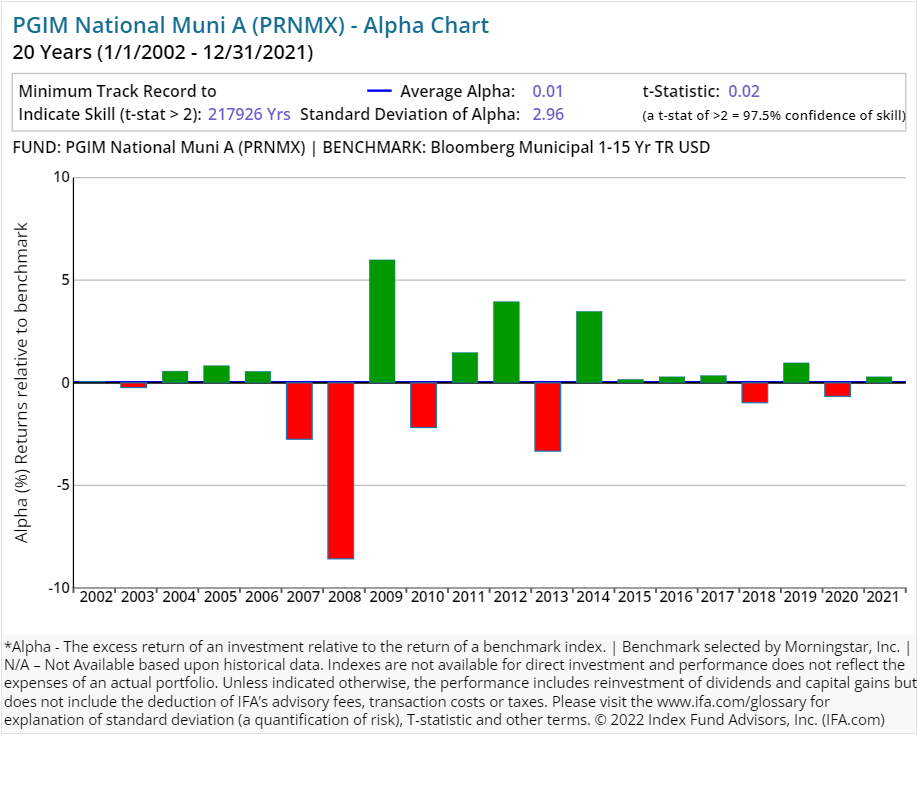
| PGIM National Muni A | PRNMX | 84.00 | 0.61 | 0.25 | 3.25 | Fixed Income | US Municipal Fixed Income | |
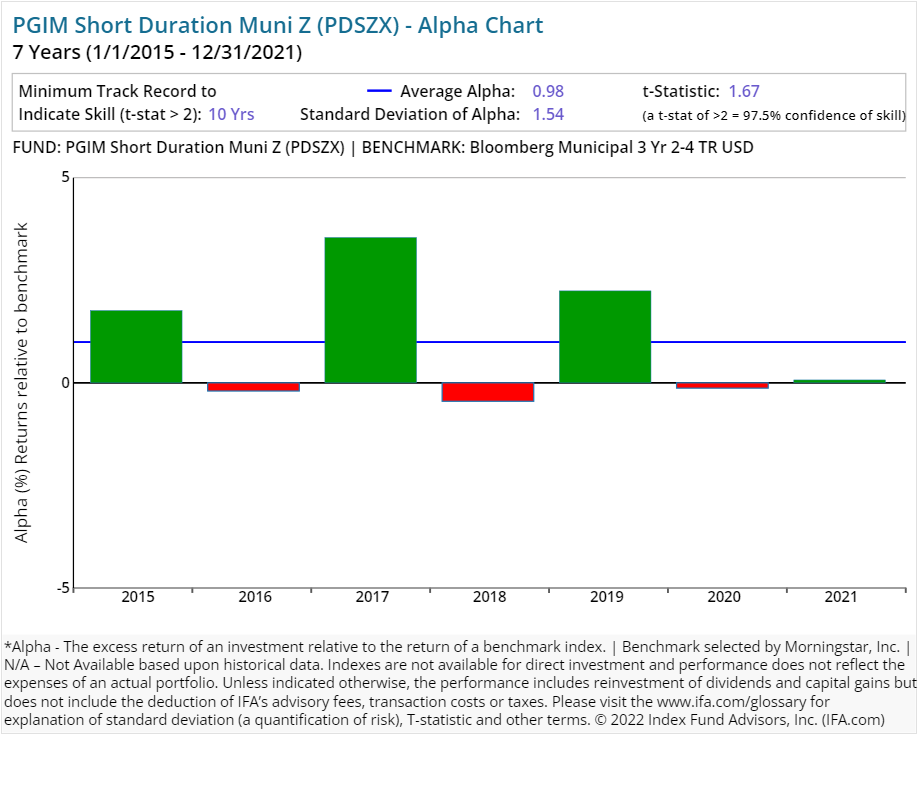
| PGIM Short Duration Muni Z | PDSZX | 79.00 | 0.32 | Fixed Income | US Municipal Fixed Income | |||
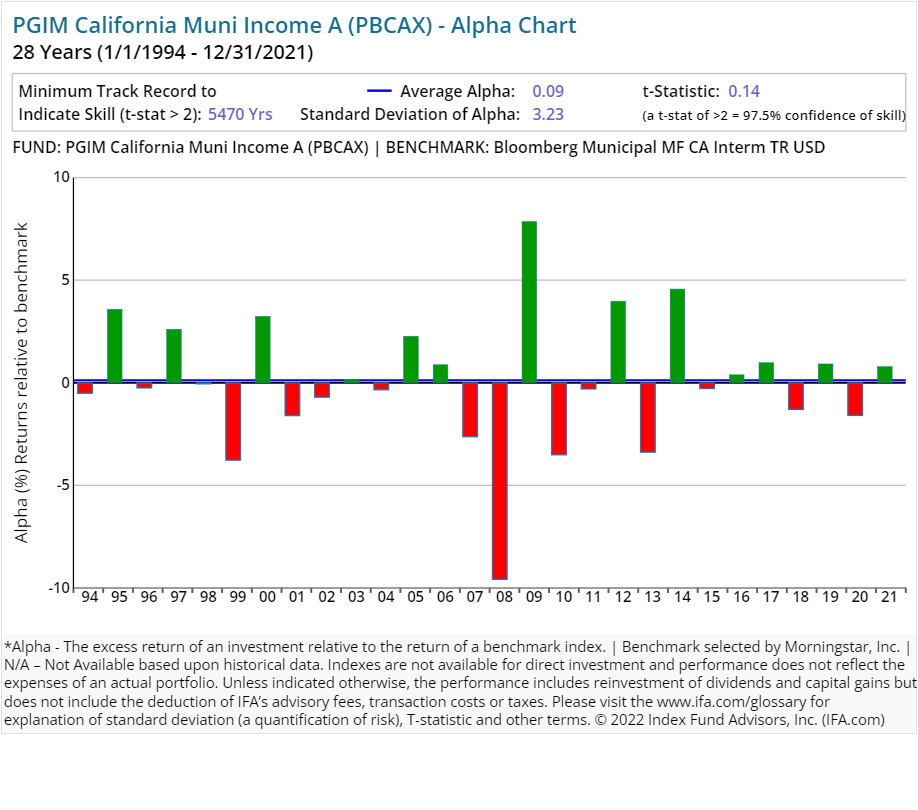
| PGIM California Muni Income A | PBCAX | 75.00 | 0.69 | 0.25 | 3.25 | Fixed Income | US Municipal Fixed Income | |
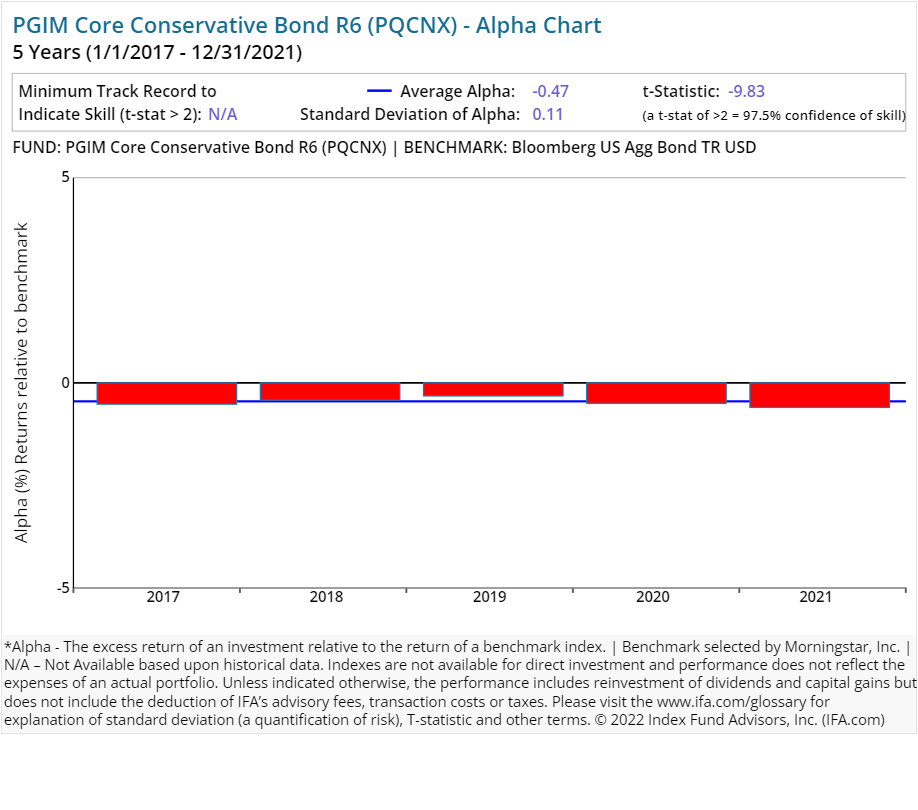
| PGIM Core Conservative Bond R6 | PQCNX | 155.00 | 0.19 | Fixed Income | US Fixed Income | |||
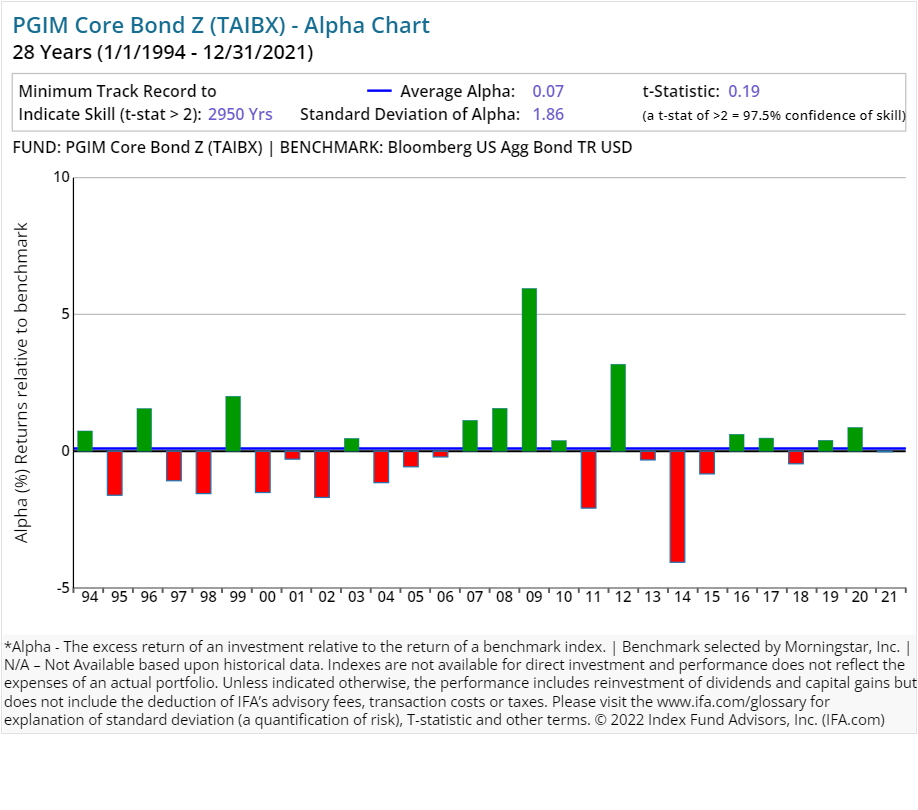
| PGIM Core Bond Z | TAIBX | 125.00 | 0.33 | Fixed Income | US Fixed Income | |||
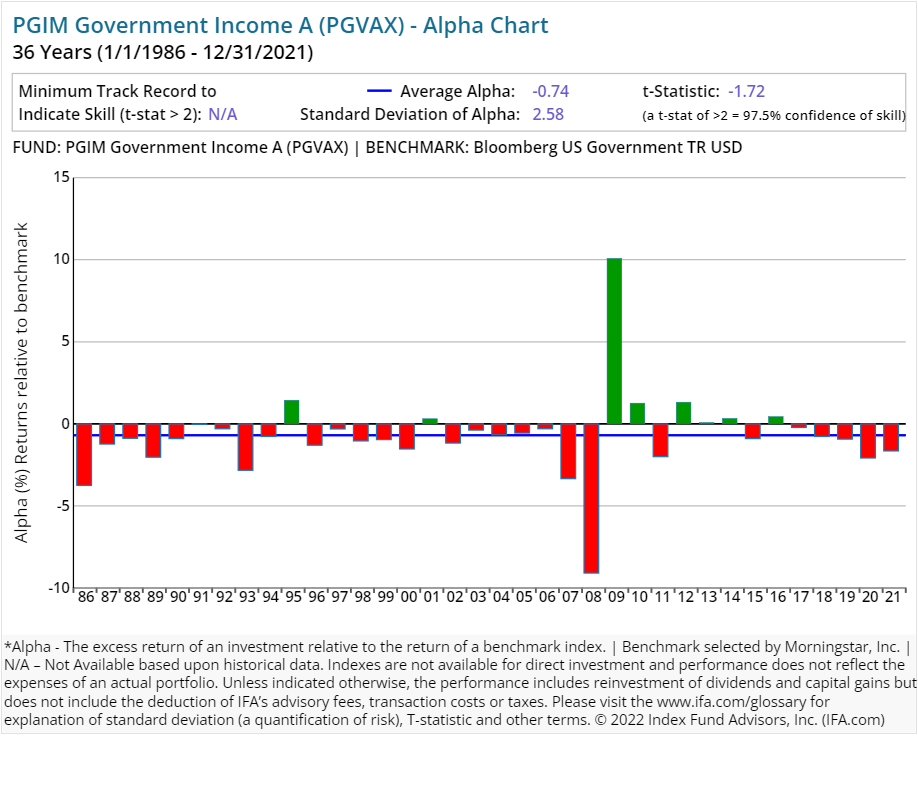
| PGIM Government Income A | PGVAX | 91.00 | 0.87 | 0.25 | 3.25 | Fixed Income | US Fixed Income | |
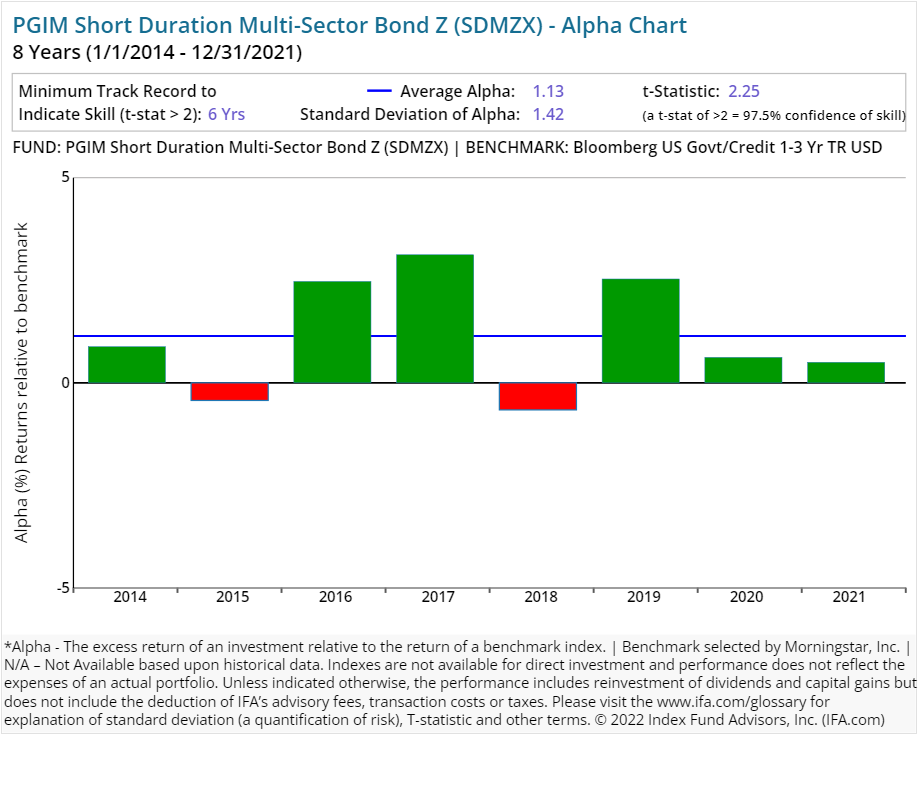
| PGIM Short Duration Multi-Sector Bond Z | SDMZX | 80.00 | 0.39 | Fixed Income | US Fixed Income | |||
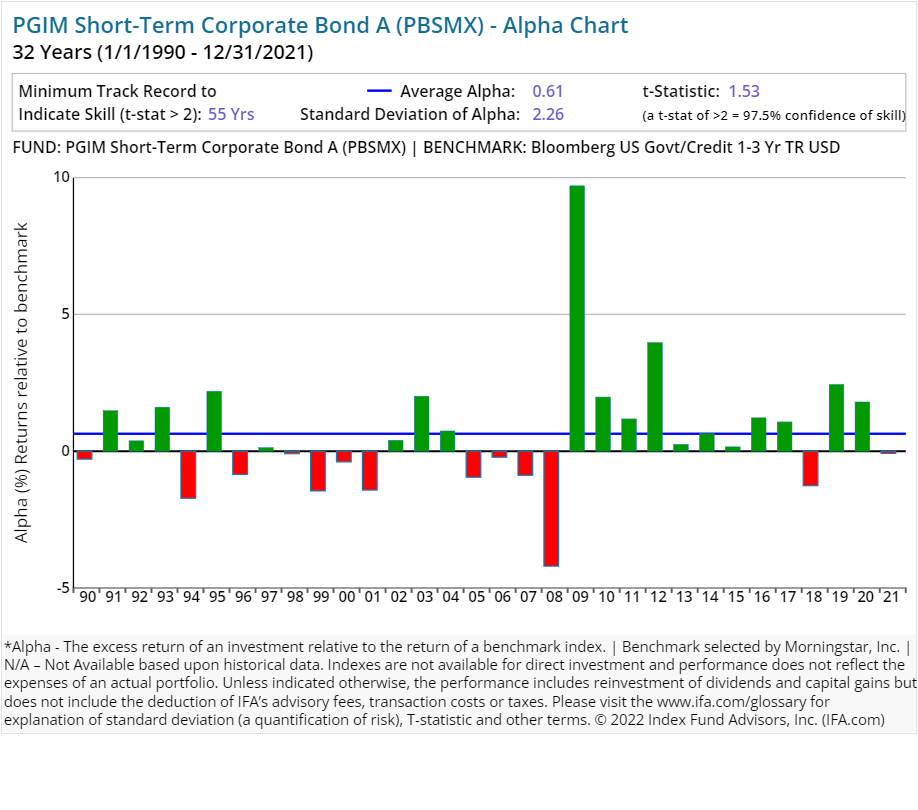
| PGIM Short-Term Corporate Bond A | PBSMX | 46.00 | 0.71 | 0.25 | 2.25 | Fixed Income | US Fixed Income | |
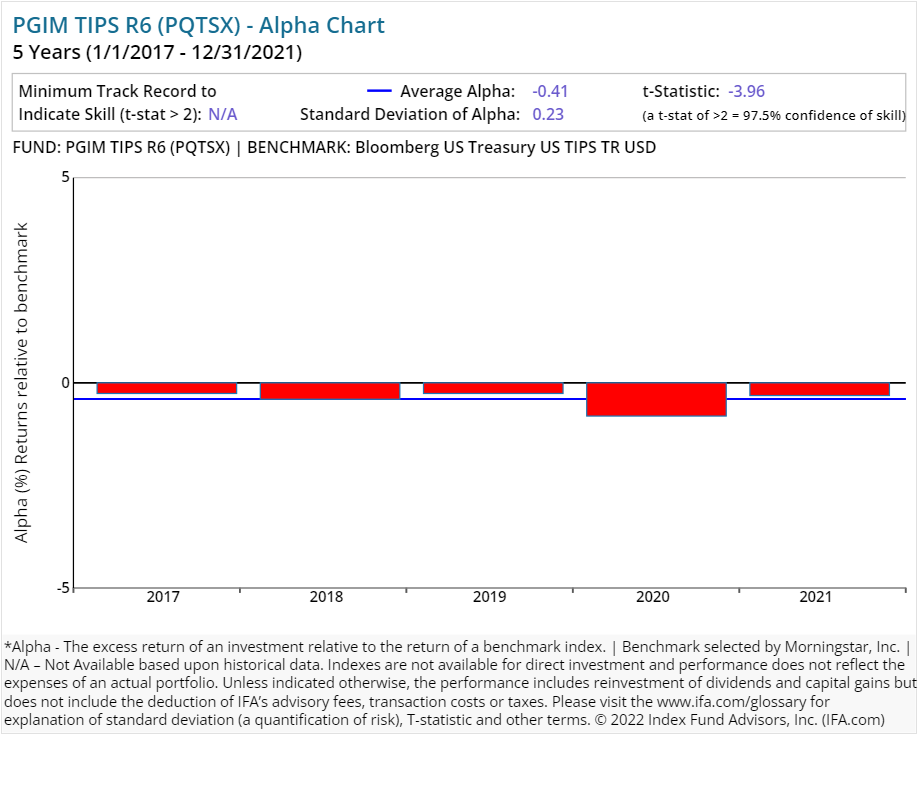
| PGIM TIPS R6 | PQTSX | 66.00 | 0.30 | Fixed Income | US Fixed Income | |||
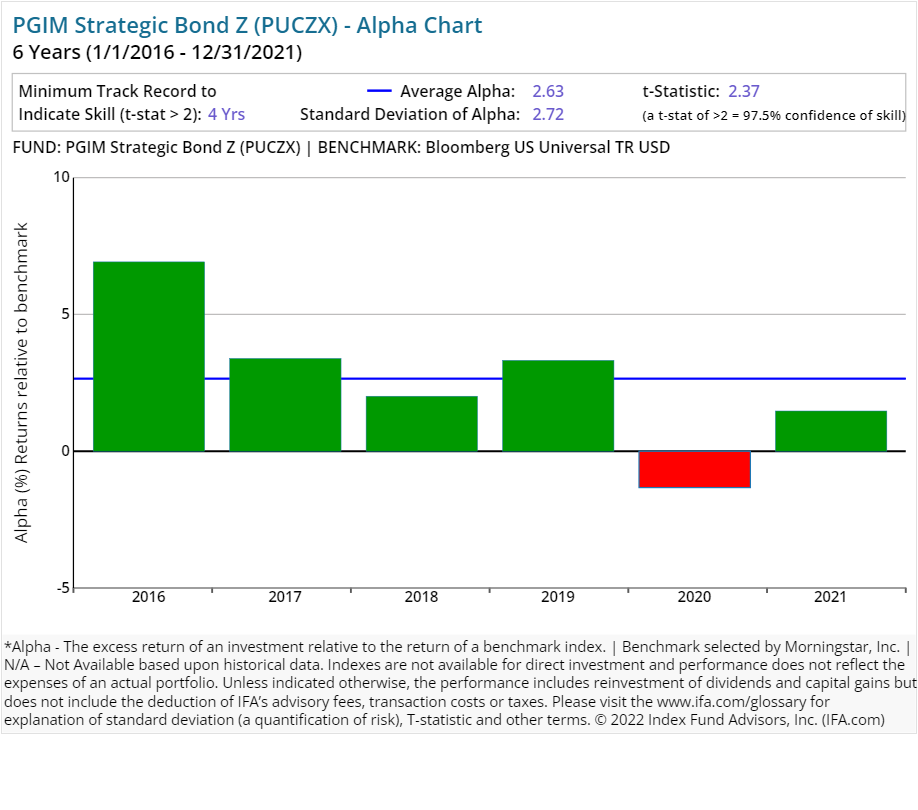
| PGIM Strategic Bond Z | PUCZX | 233.00 | 0.62 | Fixed Income | US Fixed Income | |||
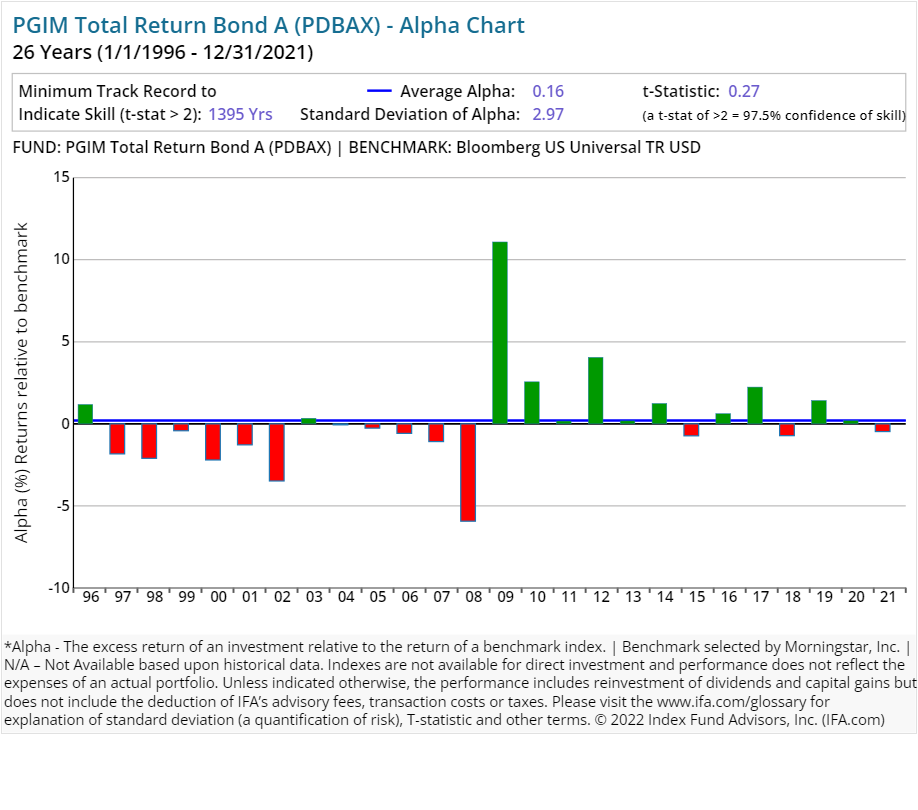
| PGIM Total Return Bond A | PDBAX | 113.00 | 0.76 | 0.25 | 3.25 | Fixed Income | US Fixed Income | |
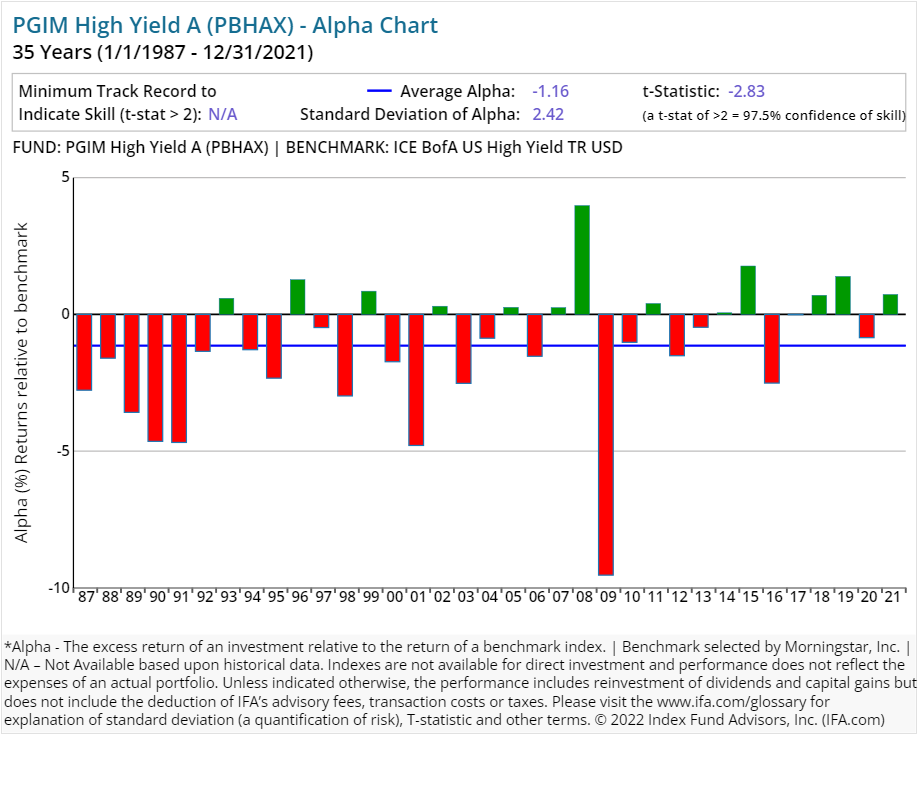
| PGIM High Yield A | PBHAX | 42.00 | 0.74 | 0.25 | 3.25 | Fixed Income | US Fixed Income | |
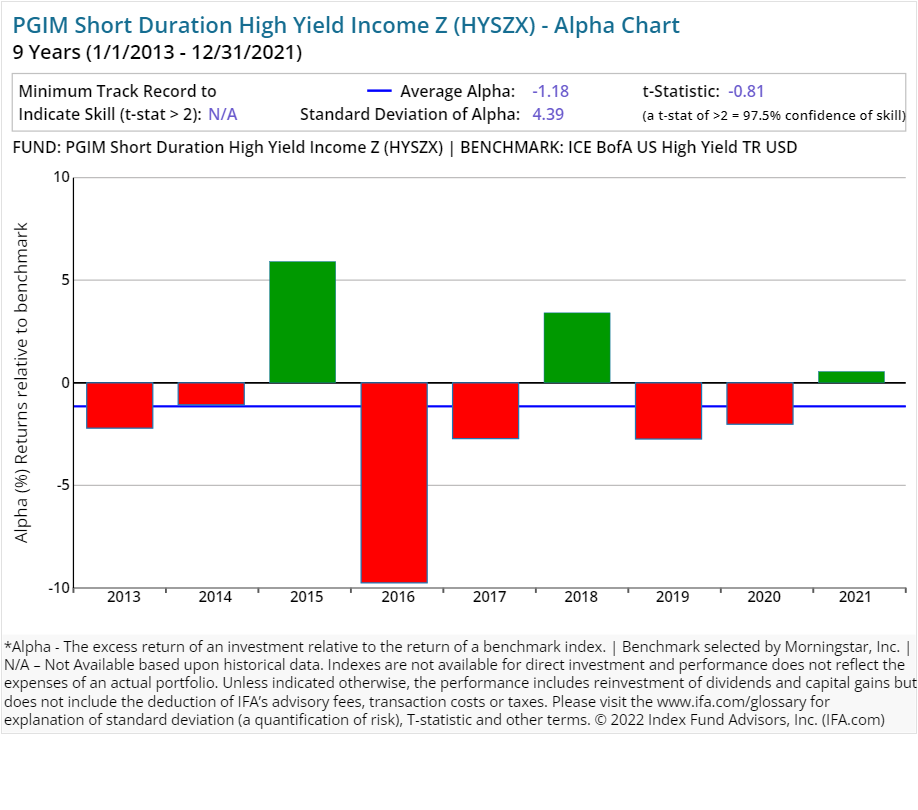
| PGIM Short Duration High Yield Income Z | HYSZX | 61.00 | 0.75 | Fixed Income | US Fixed Income | |||
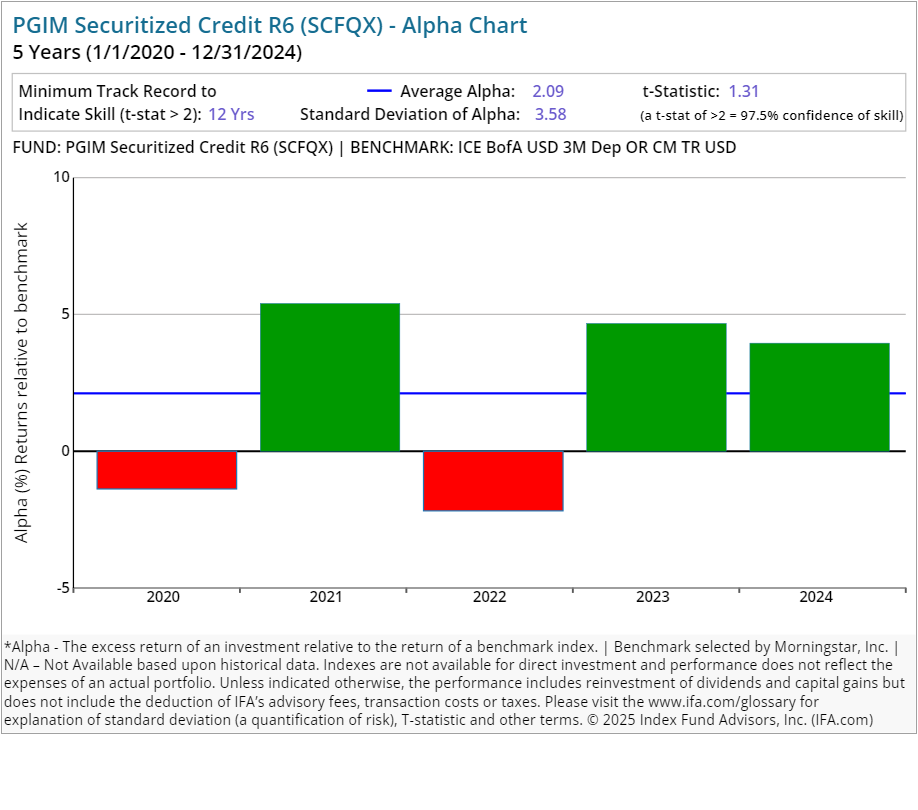
| PGIM Securitized Credit R6 | SCFQX | 46.00 | 0.60 | Fixed Income | Fixed Income Miscellaneous | |||
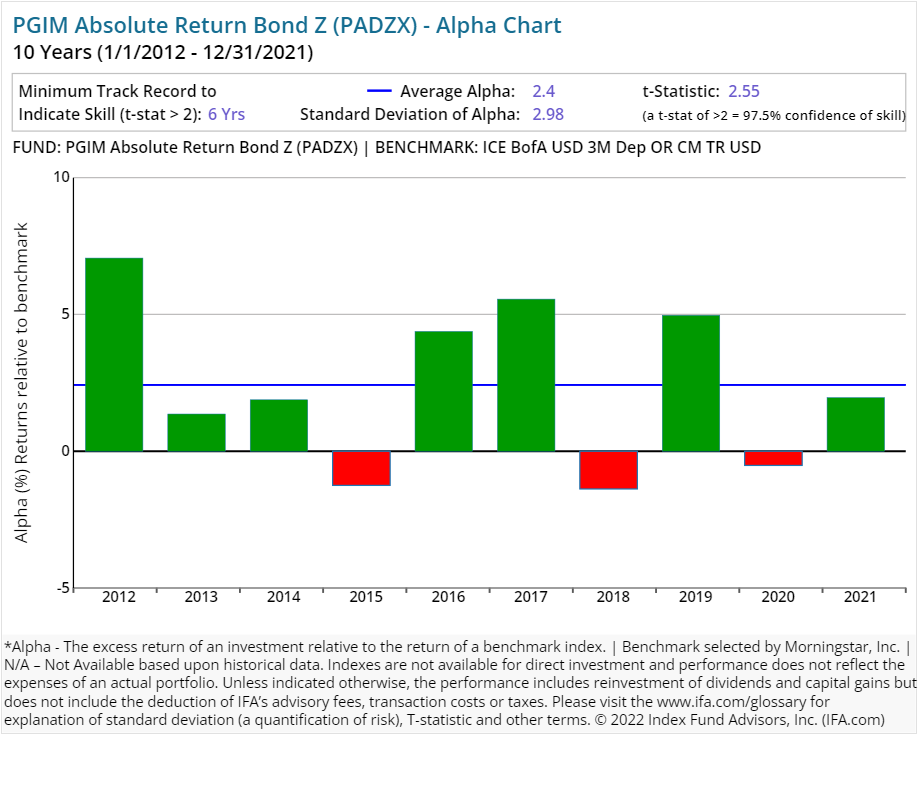
| PGIM Absolute Return Bond Z | PADZX | 77.00 | 0.73 | Fixed Income | Fixed Income Miscellaneous | |||
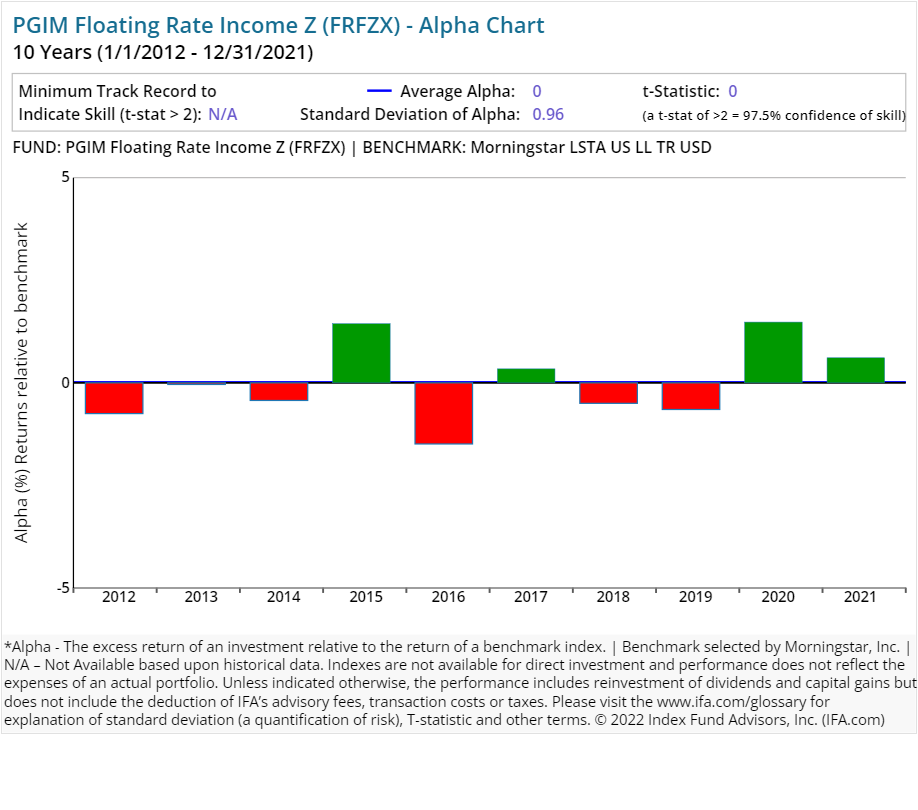
| PGIM Floating Rate Income Z | FRFZX | 86.00 | 0.85 | Fixed Income | US Fixed Income |
Please read the prospectus carefully to review the investment objectives, risks, charges and expenses of the mutual funds before investing. Prudential Financial mutual fund prospectuses are available at pgim.com.
On average, an investor who utilized a surviving active stock mutual fund strategy from Prudential experienced a 1.01% expense ratio. Similarly, an investor who utilized a surviving active bond strategy from the company experienced a 0.62% expense ratio.
These expenses can have a substantial impact on an investor's overall accumulated wealth if they are not backed by superior performance. The average turnover ratios for surviving active stock and bond strategies from Prudential were 71.9% and 80.23%, respectively. This implies an average holding period of 16.69 to 14.96 months.
In contrast, most index funds have very long holding periods — decades, in fact, thus deafening themselves to the random noise that accompanies short-term market movements. Again, turnover is a cost that is not itemized to the investor but is definitely embedded in the overall performance.
Performance Analysis
The next question we address is whether investors can expect superior performance in exchange for the higher costs associated with Prudential's implementation of active management. We compare all of its 92 strategies — including current funds and those no longer in existence — against the respective Morningstar-assigned benchmark to see how well each fund has delivered on its perceived value proposition.
We have included alpha charts for each of Prudential's current strategies at the bottom of this article. Here is what we found:
-
63.04% (58 of 92 funds) have underperformed their respective benchmarks or did not survive the period since inception.
-
36.96% (34 of 92 funds) have outperformed their respective benchmarks since inception, having delivered a POSITIVE alpha.
Here's the real kicker, however:
- 4.35% (4 of 92 funds) wound up outperforming their respective benchmarks consistently enough since inception to provide 97.5% confidence that such outperformance would persist (as opposed to being based on random outcomes).
As a result, this study shows that a majority of funds offered by Prudential have not outperformed their Morningstar-assigned benchmark. The inclusion of the statistical significance of alpha is key to this exercise, as it indicates which outcomes are due to a skill that is likely to repeat and those that are more likely due to a random-chance outcome.
Regression Analysis
How we define or choose a benchmark is extremely important. If we relied solely on commercial indexes assigned by Morningstar, then we might form a false conclusion that Prudential has found the "secret sauce" as active managers.
Since Morningstar is limited in terms of trying to fit the best commercial benchmark with each fund in existence, there is of course going to be some error in terms of matching up proper characteristics such as average market capitalization or average price-to-earnings ratio.
A better way of controlling these possible discrepancies is to run multiple regressions where we account for the known dimensions of expected return in the U.S. — i.e., market risk, size and relative price — as identified by the Fama/French Three-Factor Model.
For example, if we were to look at all of the U.S.-based strategies from Prudential that've been around for the past 10 years, we could run multiple regressions to see what each fund's alpha looks like once we control for the multiple betas that are being systematically priced into the overall market.
The chart below displays the average alpha and standard deviation of that alpha for the past 10 years through 2024. Screening criteria include funds with holdings of 90% or greater in U.S. equities and uses the oldest available share classes.
As shown above, four of the mutual funds had a positive excess return over the Fama/French Three-Factor Model. At the same time, none of the equity funds reviewed produced a statistically significant level of alpha, based on a t-stat of 2.0 or greater. (For a review of how a fund's t-stat is calculated, see the section of this study that follows the individual Prudential alpha charts.)
Why is this important? A t-stat of the alpha which is 2.0 or greater would give an investor confidence that a manager's results would be attributable to skill and repeatable. A t-stat of less than 2.0, would indicate that a manager's performance was attributable more to luck.
Conclusion
Like many of the other largest financial institutions, a deep analysis into the performance of Prudential has yielded a not so surprising result: Active management is likely to fail many investors. We believe this is due to market efficiency, costs and increased competition in the financial services sector.
As we always like to remind investors, a more reliable investment strategy for capturing the returns of global markets is to buy, hold and rebalance a globally diversified portfolio of index funds.
Below are the individual alpha charts for the existing Prudential actively managed mutual funds that have five years or more of a track record.


Footnotes:
1.) Prudential, "Final 3Q2022 Fact Sheet," Nov. 1, 2022.
2.) Morningstar, "Lower Variable Income and Unfavorable Underwriting Mark Prudential's Third-Quarter Resutls," Suryansh Sharma, Nov. 2, 2022.
This is not to be construed as an offer, solicitation, recommendation, or endorsement of any particular security, product or service. There is no guarantee investment strategies will be successful. Investing involves risks, including possible loss of principal. Performance may contain both live and back-tested data. Data is provided for illustrative purposes only, it does not represent actual performance of any client portfolio or account and it should not be interpreted as an indication of such performance. IFA Index Portfolios are recommended based on time horizon and risk tolerance. Take the IFA Risk Capacity Survey (www.ifa.com/survey) to determine which portfolio captures the right mix of stock and bond funds best suited to you. For more information about Index Fund Advisors, Inc, please review our brochure at https://www.adviserinfo.sec.gov/ or visit www.ifa.com.


 X
X