One key reason why predicting the future direction of the market is so difficult lies in the sheer number of possible outcomes. To illustrate this, I'll use the IFA MarketCoin—a conceptual tool with two sides labeled Up (U) and Down (D) to represent two simple market directions relative to a long-term median return. The median represents the midpoint of sorted historical monthly returns in a diversified index portfolio.
For this example, we'll use monthly returns of a diversified IFA Index Portfolio 100, whose 1,173-month median return has been 1.4%. This analysis focuses only on the direction of the market—not the magnitude of returns, which would be far harder to forecast than simply predicting one of two directions. In this article, I confirmed a flip of the IFA MarketCoin would accurately illustrate the randomness and unpredictability of the future direction of index returns compared to the median return.
The normal curve shown below is a smooth, bell-shaped curve which represents graphically the normal distribution. The normal distribution is not an actual distribution of coin flips, monthly market returns, test scores or of other measures. Instead, it is a mathematical model—a theoretical distribution—the area of which is taken to be infinitely large. For Index Portfolio 100 and the MarketCoin, the center line would be 1.4%, with the returns to the left being Down and the returns to the right being Up.
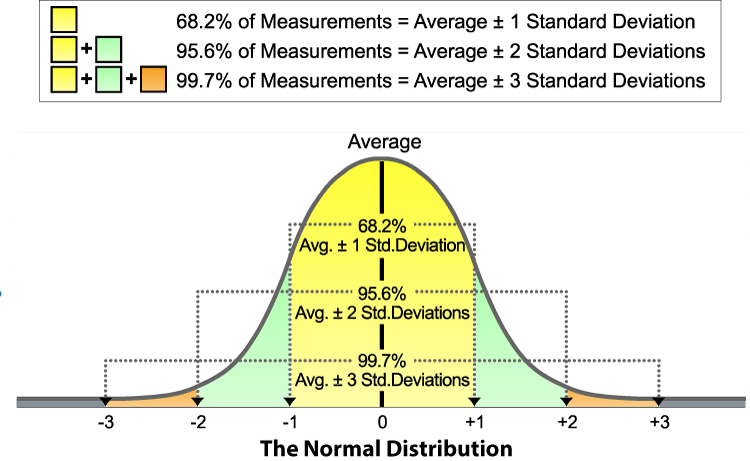
The normal distribution or normal probability curve may be thought of as arising from the impact of a very large number of factors. These factors are assumed to be similar, equal and independent and as likely to be present as absent. How such factors work to produce a normal distribution may be demonstrated in the following way.
Let's model 6 months of index portfolio returns by tossing a MarketCoin 6 times and counting the number of Ups and Downs that appear. Then do that multiple times and record the various combinations of outcomes, in this format: UUDDDU. You may get many different observations, such as four Ups and two Downs, or three Ups and three Downs, or some other combination, such as six Ups and no Downs. I just checked our randomized coin flipper and it came up with UDDDUU.
For the first 6 months of 2025, Index Portfolio 100 had observed outcomes of UDDDUU, which is among the most likely outcomes of 3 Ups and 3 Downs, but not in that order.
How many combinations do you think are possible? _______
How could you calculate the number of possible combinations? _______
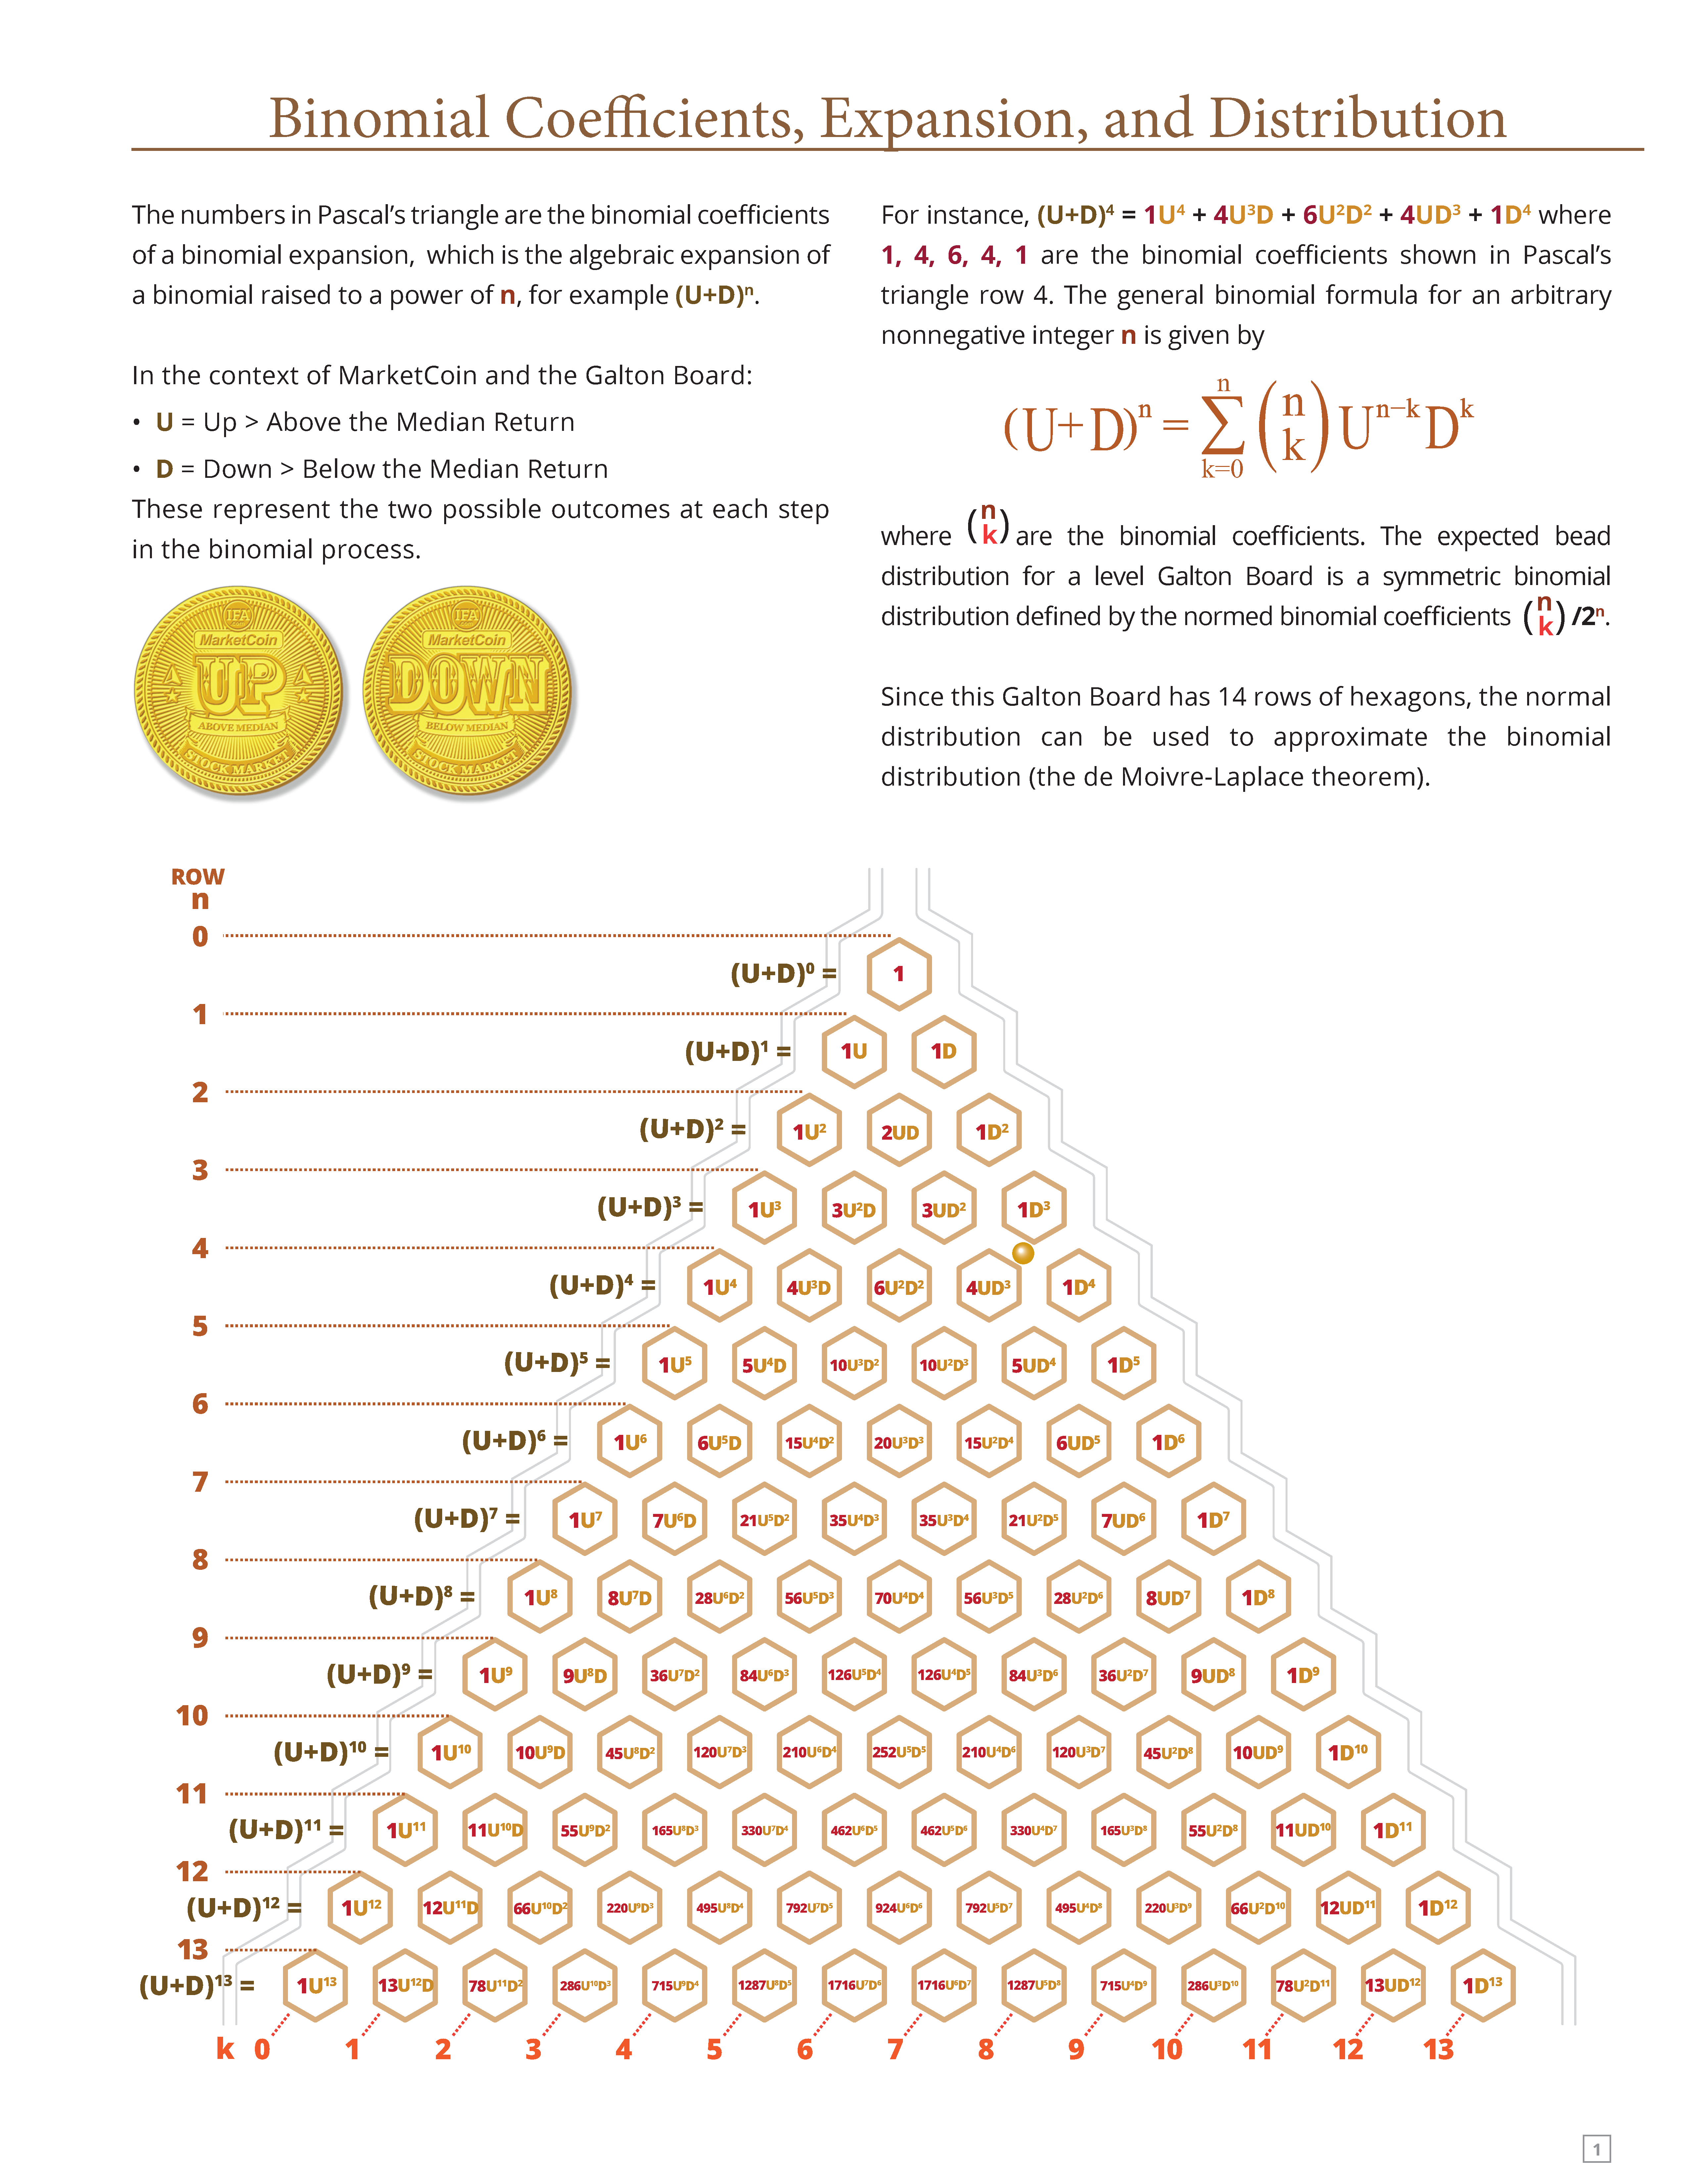
The number of possible outcomes from 6 flips can be calculated as 2 to the power of 6. In algebra, the two possible outcomes tested over multiple times is known as the binomial expansion where (U+D)⁶ will give the expected outcomes of the 64 combinations (2 to the 6th power) of Ups and Downs when the MarketCoin is tossed 6 times in a row. So, in 6 months there are 64 combinations of the sequences of Ups and Downs.
The algebra of the binomial expansion produces the result below, which is also Row 6 of Pascal's Triangle. In Exhibit A, please see the complete expansions of binomials placed on Pascal's Triangle. This expansion helps us understand the likelihood of different sequences of market outcomes over time, reinforcing the unpredictability of short-term movements.

The first of these terms, 1U⁶, gives the frequency of occurrence (namely, 1) of six Ups and no Downs (see Table below); the second term, 6U⁵D, gives the frequency of 6 combinations of five Ups and one Down; the third term, 15U⁴D², gives the frequency of occurrence of any 15 combinations of four Ups and two Downs, and so on down to 1D⁶, which gives the frequency of no Ups and six Downs. The binomial expansion will have more meaning for present purposes when written as a frequency distribution in which the number of Up months is taken as the "score":
Frequency Distribution Written from the Expansion of the Binomial* (U + D)⁶
|
Score (Number of Ups) |
frequency |
Probability of various numbers and orders of Ups |
|
6 |
1 |
Probability of 6 Ups: 1/64 (1.6%) |
|
5 |
6 |
Probability of 5 Ups: 6/64 (9.4%) |
|
4 |
15 |
Probability of 4 Ups: 15/64 (23.4%) |
|
3 |
20 |
Probability of 3 Ups: 20/64 (31.2%) |
|
2 |
15 |
Probability of 2 Ups: 15/64 (23.4%) |
|
1 |
6 |
Probability of 1 Up: 6/64 (9.4%) |
|
0 |
1 |
Probability of 0 Ups: 1/64 (1.6%) |
*Binomial = an expression containing two terms. Rules for expanding a binomial will be found in any elementary algebra description. The first 6 months of 2025 landed at a score of 3, of which there was a 31.2% probability of occurrence (this refers to 3 heads in any sequence).
The probability or expectation of any number of Ups from 6 to 0 may be found by dividing the appropriate frequency by possible number of outcomes (N). Thus, the probability of all six months of MarketCoins flips falling Up is 1 in 64 since there are 64 possible combinations of Ups and Downs but only one in which all coins are Up. The highest probability, namely, 20/64 (31.2%) is for three Ups and three Downs. There are 6 chances in 64 that the coins will fall one Up and five Downs, and only 1 chance in 64 that no Ups will appear—that all coins will show Downs. A histogram describing the frequency distribution in the table is shown below.
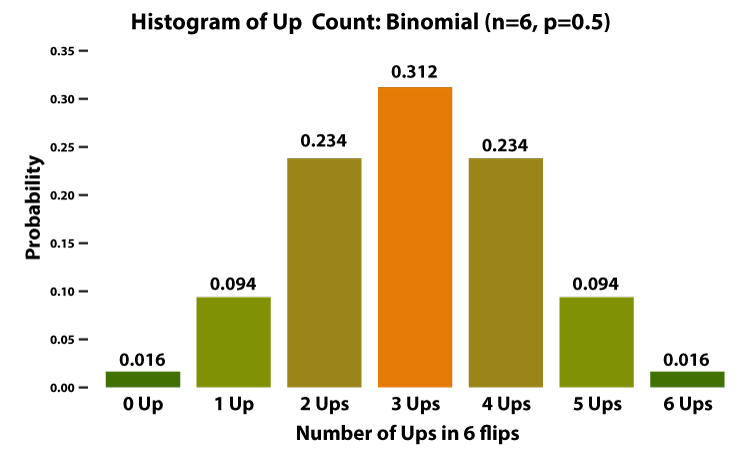
The frequency distribution in the histogram figure gives the theoretical expectation of the occurrence of certain events (combinations of Ups and Downs) when a MarketCoin is flipped six times to simulate six consecutive months. If you want to represent 12 months by flipping a coin 12 times, there would be 4,096 possible combinations of outcomes and at 10 years (2 to the 120th power), there would be more than 1 followed 36 zeros combinations! If each combination represented 1 mile, the total distance would be 1.3×1036 miles. That's 1.3 undecillion miles. For comparison:
- The observable universe is about 5.88 Trillion miles across
- This hypothetical distance of 1.3×1036 miles is over 2 × 10²³ times larger than the observable universe!
This illustrates just how vast the number of possible market paths is—and why market timing is statistically implausible.
The table below shows all 64 sequences that are possible in a 6-month period, each with an equal probability. Please remember that the compounded return of each sequence will vary widely and that variance from high to low of the total return (growth of a dollar) grows with time. At the same time, the variance of annualized returns becomes narrower.
Here's the complete 4-column × 16-row grid of all 64 sequences, sorted by number of Ups (0 → 6). The highlighted yellow and red combination was the first 6 months Ups and Downs of 2025 for Index Portfolio 100. What do you think the next 6 months will be?
|
DDDDDD |
DDDDDU |
DDDDUD |
DDDUDD |
|
DDUDDD |
DUDDDD |
UDDDDD |
DDDDUU |
|
DDDUDU |
DDDUUD |
DDUDDU |
DDUDUD |
|
DDUUDD |
DUDDDU |
DUDDUD |
DUDUDD |
|
DUUDDD |
UDDDDU |
UDDDUD |
UDDUDD |
|
UDUDDD |
UUDDDD |
DDDUUU |
DDUDUU |
|
DDUUDU |
DDUUUD |
DUDDUU |
DUDUDU |
|
DUDUUD |
DUUDDU |
DUUDUD |
DUUUDD |
|
UDDDUU |
UDDUDU |
UDDUUD |
UDUDDU |
|
UDUDUD |
UDUUDD |
UUDDDU |
UUDDUD |
|
UUDUDD |
UUUDDD |
DDUUUU |
DUDUUU |
|
DUUDUU |
DUUUDU |
DUUUUD |
UDDUUU |
|
UDUDUU |
UDUUDU |
UDUUUD |
UUDDUU |
|
UUDUDU |
UUDUUD |
UUUDDU |
UUUDUD |
|
UUUUDD |
DUUUUU |
UDUUUU |
UUDUUU |
|
UUUDUU |
UUUUDU |
UUUUUD |
UUUUUU |
When the number of influencing factors is very large, such as the constant flow of new information and forecasts, the smooth normal probability curve shown in Figure 1 begins to appear. The appearance on a coin of an Up or a Down is determined by a large number of small chance influences as likely to work one way as another. The twist given the coin, its weight, the height of the flip, the kind of surface it falls upon, and other circumstances—all these may be important. The widespread use of the normal distribution is justified by the fact that it often fits the facts better—provides a better model—than other mathematical distributions.
This exercise demonstrates that even with just six months of data, the number of possible market paths is vast. As time increases, the complexity grows exponentially making market timing not just difficult, but statistically implausible.
Exhibit A
 (Click the image to enlarge)
Disclosure:
This article is for educational purposes only and does not constitute investment advice or a recommendation to engage in any investment strategy. The MarketCoin model and statistical illustrations presented are hypothetical and do not reflect actual investment results. Past performance is not indicative of future results. Index Portfolio 100 is a diversified portfolio used for illustrative purposes and may not reflect the performance of any actual client account. Investors are encouraged to consult with a qualified advisor to assess personal financial goals and risk capacity. Additional information is available by reviewing IFA's ADV Brochure at https://www.adviserinfo.sec.gov/ or visiting www.ifa.com.


 X
X