
 Risk Capacity
 Wealth Management
 Outsourced CIO
 Retirement Plans
 Institutional
 Financial
  Open an Account
 IFA App

 Articles
 Charts
 Investor Education ▾
 Fund
Fund
 Store
Store

 Taxes
Taxes Back-testing Disclosures
 Glossary
 Form CRS
In January 2026, gold crossed $5,000 an ounce for the first time as investors rushed into the world's oldest form of portfolio protection. That same month, a study of 222 years of market history landed in the Financial Analysts Journal with an uncomfortable conclusion: the defenses investors instinctively reach for have not always been reliable.
The timing was almost too neat. The week gold broke through $5,000, with spot climbing past $5,100 by January 27 according to CNBC, safe-haven demand was running at record levels, and the industry was busy manufacturing new ways to sell peace of mind. Meanwhile, Baltussen, Martens, and van der Linden (2026) published the deepest test of defensive strategies ever run: every major form of protection, measured across global markets from 1800 to 2021. Their peer-reviewed findings suggested that gold and put options were amont the least drawodn and cost-effective defenses available.
Most portfolio protection, it turns out, is an insurance policy the buyer never reads. The premiums are real. The payout terms are written for a disaster that rarely arrives in the expected shape. The rest of this article walks through what failed, why it failed, what worked, with heavy caveats, and what the evidence says a long-term investor should actually do.
Eight Great Drawdowns in 222 Years of Market History
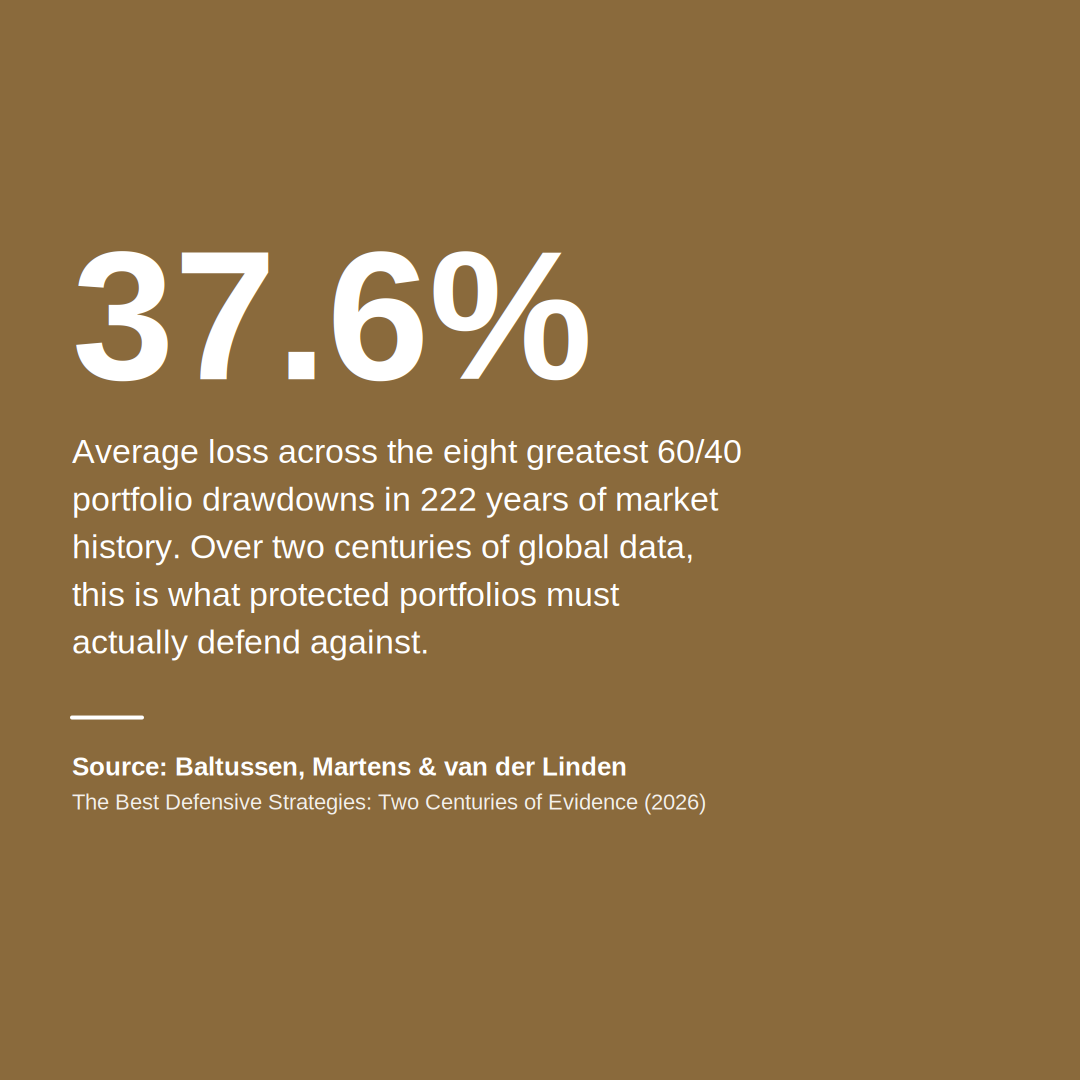
The historical record contains far more portfolio disasters than modern datasets acknowledge. Between 1800 and 2021, a global 60/40 portfolio of stocks and bonds suffered eight drawdowns worse than 20 percent. The average loss across those episodes was 37.6 percent. The worst, running from October 1918 to November 1926, reached 71.2 percent. The second worst began in October 1929 and had taken 45.0 percent by June 1933.
Compare that with the period most investment research actually covers. Since 1985, there have been just two such episodes. Any conclusion about what protects a portfolio, drawn from recent decades alone, rests on two data points. That is the study's reason for existing: 222 years of global data turn a hunch into a testable record.
The stakes compound. A portfolio that loses 50 percent needs a 100 percent gain just to get back to even.
And yet, on the historical record, the risk has been complensed for over the long term. Across the full sample, the global 60/40 returned roughly 7.0 percent per annum. That long-run reward is why the disasters are worth managing rather than fleeing. The question is whether the products sold for the job have actually done it. Past results, as ever, are a record and not a promise.
The Insurance Policy That Rarely Pays Out
Systematic put options, the most literal form of portfolio insurance, generally lost money in almost every environment the study examined, because their payout trigger is calibrated to a disaster shape most real crashes don't take.
The headline number first. A systematic put overlay, measured from July 1986 to December 2021 using the CBOE S&P 500 put-protection index and scaled to a common volatility for comparison, returned −2.5 percent per annum. In months when equities rose, the overlay lost an average of 0.54 percent — a premium quietly collected from the portfolio month after month.
Here is the paradox. In drawdowns worse than 20 percent, puts ranked first among all the strategies tested, with a cumulative return of 13.7 percent. In drawdowns worse than two percent — the ordinary bad times, where investors spend most of their time — they ranked fifth. The insurance pays out in catastrophes and bleeds in corrections.
The mechanism deserves a close look, because it is the most important idea in the paper. Consider the authors' own scenario. A market that falls four percent every month builds a severe cumulative loss. Yet a put option struck five percent below the market pays nothing at all, because no single month breaches the threshold before the contract expires and rolls into a new one. The insurance is keyed to sudden falls; a grinding decline never triggers it.
This is flood insurance with a clause the buyer never read: it pays only if the water rises five feet within a single month. A flood that rises one foot a month for a year destroys the house just as completely — and the policy pays nothing, while premiums were collected the whole time.
COVID was the one flash flood. In February and March 2020, the global 60/40 lost 12.4 percent in two months (the rare cliff-shaped crash puts are designed for), and they worked perfectly.
Two caveats worth stating. This verdict covers systematic put programs, monthly-rolled index puts struck five percent below the market, not every conceivable use of options. And the put data begin in July 1986, so the sample spans 36 years and only four major drawdowns.
The Mattress Full of Cash: Gold's Two-Century Record

Surely the oldest defense fares better. On the evidence, it hasn't. Across 222 years, gold has not consistently protected portfolios when protection was needed most.
Start with the structural problem. Gold's correlation with the global 60/40 portfolio is 0.17 — mildly positive. It was never mechanically wired to zig when portfolios zag. Across the eight great drawdowns, it returned an average of −2.4 percent. In the worst 10 percent of months for a 60/40 investor, it averaged −0.4 percent. Over the full sample, on the study's comparability scaling, it returned −0.7 percent per annum in excess of cash.
Gold, in short, is the mattress stuffed with cash. It feels like protection because it is tangible and ancient. But it was never actually connected to the risk the investor is afraid of.
To be fair, gold has delivered in specific episodes: it protected portfolios through the IT bubble and the Global Financial Crisis, and its 2024–2026 rally is real. But one spectacular regime is exactly the small-sample trap a 222-year study was built to escape. On the full record, gold has been unreliable as a hedge, which is not the same as useless. And none of this is a forecast of gold prices. The claim is about reliability as protection, nothing more.
The Levee That Wasn't Built for Every Storm
Even government bonds, the ballast in nearly every balanced portfolio, have not conistently acted as a reliable crisis hedge. Across the 12 largest equity drawdowns since 1800, hedged global developed-market treasuries returned an average of −3.5 percent relative to cash. Treasuries, the paper notes, make most of their returns in months when equities rise.
That will surprise anyone whose investing memory begins in the 1990s. In the four large equity drawdowns since the late 1980s, treasuries did average positive returns, which is exactly why the flight-to-safety assumption feels so solid. But the negative stock/bond correlation that modern investors treat as a law of nature is a regime, not a law. Following earlier work by Harvey and colleagues (2019), the authors attribute treasuries' unreliability to the variability of the equity–bond correlation over time. Sometimes bonds zag when stocks fall. Sometimes they fall with everything else.
None of this means bonds don't belong in a portfolio. It means their job description needs rewriting. Bonds reduce portfolio risk by being lower-risk assets: they dampen the ride because they move less, not because they reliably move in the opposite direction. The levee protects the town in most storms because it sits on higher ground, not because it was engineered for the exact storm you fear. What the evidence removes is the assumption of rescue, the belief that bonds will rally to the portfolio's defense in every equity crisis. That is a humbler job, and a truer one.
What Historically Worked — and the Asterisks That Follow
Two strategies genuinely protected across two centuries of data. The fine print between backtest and real portfolio, though, is long, and the authors' own disclosures belong in it.
The findings first, reported straight. Trend-following — systematically buying assets that have been rising and selling those that have been falling, across dozens of markets — returned an average of 19.3 percent across the eight great drawdowns, though with a wide range: −5.1 percent in one episode, 35.2 percent in another. The second winner is a factor-based overlay the authors call DAR4020, their own design, which averaged 16.6 percent (range 4.0 percent to 36.9 percent) and, unlike gold, carried a negative correlation with the 60/40 portfolio: −0.28. The two are complementary. DAR4020 protects immediately — in the COVID crash it gained 5.0 percent while trend-following lost 1.1 percent — whereas trend-following excels in prolonged declines. A 50/50 blend of the two, added to a 60/40 portfolio, would have cut the average loss in drawdowns worse than 20 percent from 37.6 percent to 15.1 percent in the studies modeled results.
Now the asterisks.
First, these are not returns anyone could have earned. Every strategy in the study is retrospectively scaled to a common 5 percent volatility so the comparisons are fair; the authors state plainly that the reported figures are normalized metrics, not achievable portfolio returns. Transaction costs are excluded entirely — and both winners are frequent traders.
Second, the disclosed conflict. The authors work for Northern Trust Asset Management and Robeco, firms that offer related investment products, and DAR4020 is the authors' own design. The disclosure appears in the paper itself. Disclosed conflicts are how honest research works; they are also exactly what a skeptical reader should weigh.
Third, the gap between published backtest and live results. McLean and Pontiff (2016) examined 97 published return predictors and found portfolio returns 58 percent lower after publication. Novy-Marx and Velikov (2016) found that high-turnover strategies rarely retain significant returns once real trading costs are paid. Both strategies here are high-turnover by design.
Fourth, the behavioral tax. DAR4020 loses money, on average, in months when the 60/40 rises, which means years of watching your protection bleed while everything else compounds. The authors concede that this experience "will test the patience of the investor using it as a protective strategy."
Finally, the pre-1926 data are reconstructions, whose limits the paper discusses directly, and the study is new enough that no independent replication yet exists.
The Protection You Already Control
ONe of the most consistent forms of portfolio protection in the evidence was never for sale. It is built into the portfolio itself, through an allocation matched to your actual capacity for risk.
The direct comparison that seals the argument comes from Roni Israelov (2019), who tested put protection against the simplest possible alternative (owning less equity), using the same CBOE put-protection index the two-century study draws on. His finding: buying put protection typically led to worse drawdowns than simply reducing equity exposure to match. If equities are the dominant source of portfolio damage, owning the right amount of them addresses the risk at its source — without premiums, rolling contracts, or manager selection.
The wider evidence points the same way. Vanguard research across five markets found that strategic asset allocation explained between 80 and 91 percent of the variation in balanced funds' returns over time. Real downside protection also includes the unglamorous levers — the risk-capacity decision, tax sequencing, longevity planning — that shape terminal wealth as surely as any drawdown.
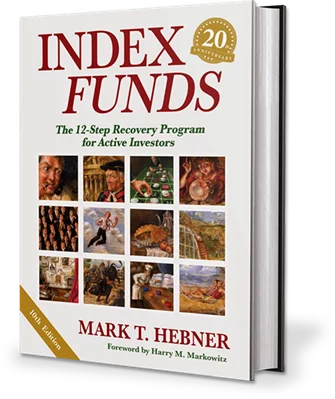
As Mark Hebner writes in Step 8 of Index Funds: The 12-Step Recovery Program for Active Investors, investors "are still looking for that perfect investment with small risk and big returns. People are also still looking for a weight loss pill that will allow them to continue eating country-fried steak, massive cinnamon buns, and ice cream on a regular basis. Neither exists."
Risk cannot be eliminated, only sized correctly. Avoid it entirely and you avoid returns along with it. The aim is to take as much risk as an investor needs to, can afford to, and is comfortable with. But no more.

Building on Higher Ground
Two centuries of evidence reframe the question. Protection was never scarce; it is available everywhere, at a price. The issue is whether the protection on offer pays out in the disasters that actually happen. Mostly, it hasn't.
Which brings us back to the gold buyer of January 2026. The instinct to protect what you've built is rational. The products sold to serve that instinct have mostly been built for disasters that rarely arrive.
The best flood protection was never the policy with the clever trigger clause, or the cash in the mattress, or the levee assumed to hold in every storm. It was deciding, before the rain, how close to the river to build. That is the allocation decision, and in our view it is the one form of portfolio protection most fully within an investor's control.
So before buying any protection, ask two questions. In what shape of disaster does this actually pay out? And what does it cost in all the years that disaster doesn't arrive?
Resources
Baltussen, G., Martens, M., & van der Linden, L. (2026). The best defensive strategies: Two centuries of evidence. Financial Analysts Journal, 82(1), 6–34.
Harvey, C. R., Hoyle, E., Rattray, S., Sargaison, M., Taylor, D., & Van Hemert, O. (2019). The best of strategies for the worst of times: Can portfolios be crisis proofed? Journal of Portfolio Management, 45(5), 7–28.
Israelov, R. (2019). Pathetic protection: The elusive benefits of protective puts. Journal of Alternative Investments, 21(3), 6–33.
McLean, R. D., & Pontiff, J. (2016). Does academic research destroy stock return predictability? Journal of Finance, 71(1), 5–32.
Novy-Marx, R., & Velikov, M. (2016). A taxonomy of anomalies and their trading costs. Review of Financial Studies, 29(1), 104–147.
Hebner, M. T. (2023). Index Funds: The 12-Step Recovery Program for Active Investors (10th anniversary edition). IFA Publishing.
ROBIN POWELL is the Creative Director at Index Fund Advisors (IFA). He is also a financial journalist and the Editor of The Evidence-Based Investor. This article reflects IFA's investment philosophy and is intended for informational purposes only.
DISCLOSURES:
The information discussed is general in nature and may not be suitable for all investors. Examples and studies cited reflect specific time periods and may not be representative of all market conditions or investor experiences. Individual circumstances vary, and readers should consult a qualified professional regarding their personal situation. Index Fund Advisors, Inc. (IFA) believes the information to be accurate but does not guarantee its completeness or accuracy. This article was sourced and prepared with the assistance of artificial intelligence (AI) technology.For more information about Index Fund Advisors, Inc, please review our brochure at https://www.adviserinfo.sec.gov/ or visit www.ifa.com.
















 Home
Home 888-643-3133
 Contact Us
 Newsletter Subscribe
 eMoney
 IFA Apps
 Index Funds Book on Kindle
 Index Funds Audiobook
 Careers
 Facebook
 X
X LinkedIn
 Instagram
 Youtube
 Terms
Terms Index Descriptions