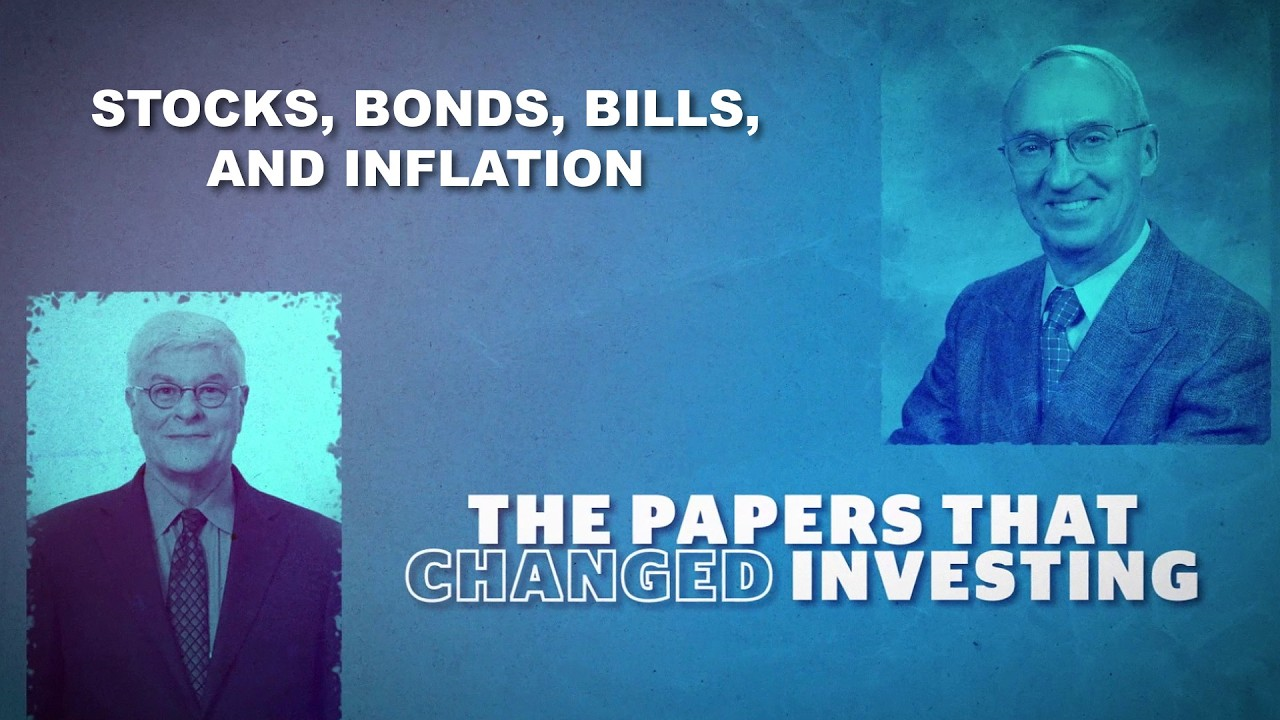
The Papers that Changed Investing: Stocks, Bonds, Bills, and Inflation

It's 1976. An investor asks a simple question: how have stocks actually performed compared to bonds over the long term?
Nobody knew. Not precisely. Not comprehensively. The investment industry was flying blind.
Decisions affecting many investors' retirements were based on anecdote, folklore, and whatever brokers remembered from last decade.
Two researchers changed that. Roger Ibbotson and Rex Sinquefield built the instrument panel.
This is the paper that gave investors the data to help make informed decisions.
Welcome to The Papers That Changed Investing.
Before this paper, long-term historical data on market returns were scarce and fragmented.
Harry Markowitz had shown how to build diversified portfolios. But his elegant mathematics needed something crucial: actual data on how different assets behaved over time.
Advisors couldn't tell you with precision what stocks, bonds, or cash had actually returned over decades. They couldn't quantify the trade-off between risk and reward.
Investment advice was based on intuition and selective memory, not evidence.
Ibbotson and Sinquefield's insight was straightforward but transformative. They would create a comprehensive scoreboard.
Using data from the Center for Research in Security Prices, they compiled year-by-year returns from 1926 onwards for five asset classes: stocks, government bonds, corporate bonds, Treasury bills, and inflation.
Investors could see how each asset class had performed. Not just returns, but volatility too.
They didn't just report numbers. They calculated total returns, assuming reinvestment of dividends and interest. The complete picture.
Ibbotson and Sinquefield didn't just look backward. They built a framework for thinking about the future.
They analyzed patterns in nearly 50 years of data and ran simulations forecasting returns through the year 2000.
One prediction stood out. They suggested the Dow Jones could reach 10,000 by 2000.
At the time, that seemed audacious. The Dow was around 1,000. But as Ibbotson later noted: "We said the stock market would outperform the bond market and hit 10,000 by 2000, and it did."
So what did the data show?
First: over the long term, stocks had historically delivered substantially higher returns than bonds, bills, or inflation. But they came with considerably more volatility. Year-to-year swings were dramatic.
Second: Treasury bills barely kept pace with inflation. Playing it safe had a hidden cost. Purchasing power went nowhere.
Third: the data quantified what researchers call the equity risk premium. That's the extra return investors historically received for accepting stock market volatility. It wasn't free money. It was compensation for enduring uncertainty.
Later updates added small-company stocks, which showed even higher historical returns, and even greater volatility. The pattern held: risk and return moved together.
Why does this matter for investors today?
Ibbotson and Sinquefield gave Markowitz's portfolio theory the empirical foundation it needed. Advisors could now build diversified portfolios based on evidence, not guesswork.
The study also revealed an uncomfortable consideration: Holding only "safe" assets like cash may feel secure, but historically it has often meant watching inflation erode your wealth.
Their work became the widely referenced in the industry. The SBBI Yearbook is still published annually, now by Morningstar, and remains the go-to reference for historical market data.
Of course, past performance doesn't guarantee future results. Markets change. Economic conditions shift. But understanding history helps investors set realistic expectations and avoid costly mistakes driven by fear or greed.
Ibbotson and Sinquefield didn't tell investors what to do. They gave them the facts to decide for themselves.
To learn more about historical data, visit IFA.com.
Source
Ibbotson, R. G. & Sinquefield, R. A. (1976). Stocks, Bonds, Bills, and Inflation: Year-by-Year Historical Returns (1926-1974). The Journal of Business, 49(1), 11-47.
Available at ifa.com/academic-papers
DISCLOSURES:
This material is intended for informational purposes only and is not a solicitation, offer, or recommendation to buy or sell any securities or investment programs. Past performance is not indicative of future results. All investing involves risk, including the possible loss of principal. References to academic studies are provided for educational purposes and may not reflect current market conditions. Assumptions include trading costs, taxes, and other frictions materially impact net returns. Individual circumstances vary, and readers should consult a qualified financial professional before making investment decisions. This video may include content generated or enhanced using artificial intelligence (AI). For more information about Index Fund Advisors, Inc, please review our brochure at https://www.adviserinfo.sec.gov/ or visit www.ifa.com.


 X
X