
 Risk Capacity
 Wealth Management
 Outsourced CIO
 Retirement Plans
 Institutional
 Financial
  Open an Account
 IFA App

 Articles
 Charts
 Investor Education ▾
 Fund
Fund
 Store
Store

 Taxes
Taxes Back-testing Disclosures
 Glossary
 Form CRS
Pioneers of Probability: Abraham De Moivre
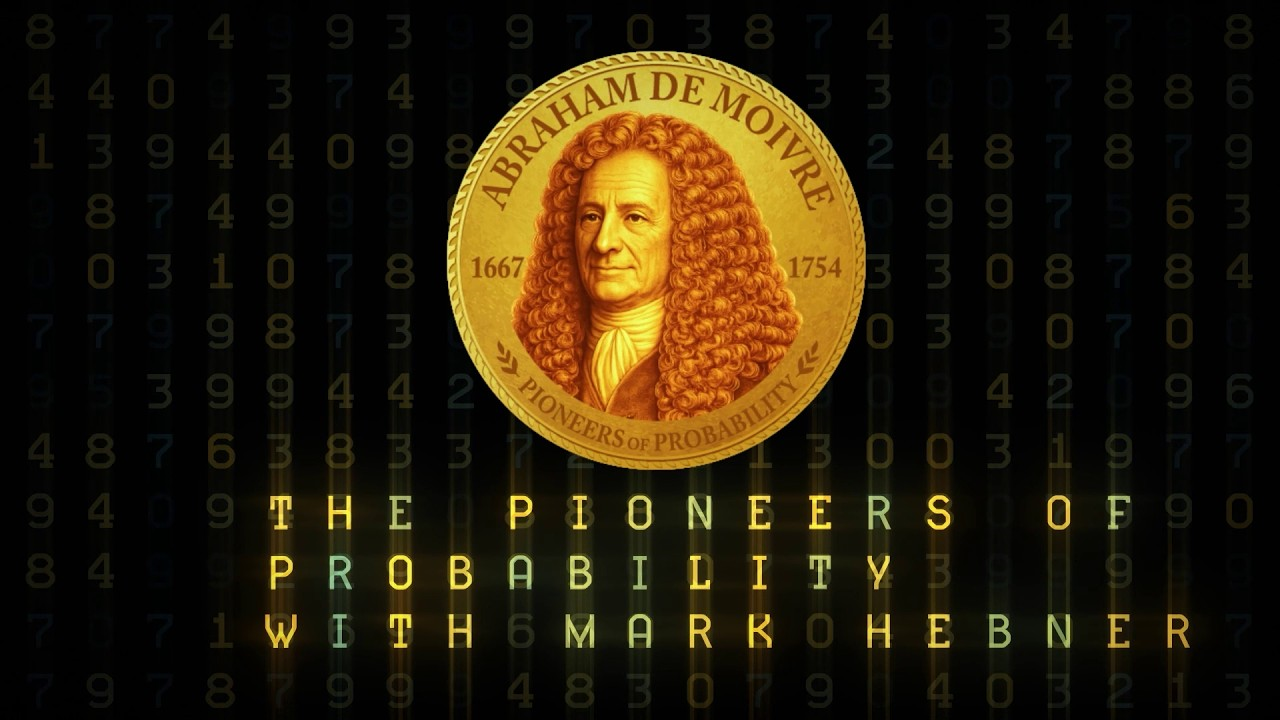

It's London, 1733. Picture one of the greatest mathematicians of his generation — a personal friend of Isaac Newton, a fellow of the Royal Society, a man Newton himself would redirect questioners to, saying: go to Mr. de Moivre, he knows these things better than I do
"Sir Isaac, I don't understand how your calculus calculates a planet's speed at this point in its orbit. Could you show me the proof?"
"Go to Mr De Moivre, he knows things better than I do these days"
Now picture that man spending his days in a London coffee house, solving gambling problems for strangers in exchange for shillings.
That was Abraham de Moivre. A French refugee who fled religious persecution in 1688, spent sixty years in England,
"How can I help you?"
and never once obtained a university position — not because he lacked ability, but because he was foreign and Protestant in a world that rewarded neither.
He also discovered one of the most influential curves in the history of science.
Welcome to the Pioneers of Probability with me Mark Hebner
In the last episode, Yakob Bernoulli proved the Law of Large Numbers. Repeat a trial enough times, and the observed frequency converges toward the true probability. Repetition reveals truth.
But Bernoulli's theorem left a question unanswered — one that any intellectually intelligent person would immediately want to ask.
All right. The average converges. But how? How quickly? And while it's converging — while we're still accumulating trials, still gathering data — how are the results distributed around that center? How often do we end up close to the true value? How often far away? What shape does uncertainty take?
De Moivre spent years on this question... And what he stumbled upon was a mathematical curve.
"It's the curve, the curve!"
A shape so powerful... that a century later, French Scientist Pierre-Simon Laplace would realize it was ubiquitous in nature and human affairs. The shape that appears wherever chance accumulates.
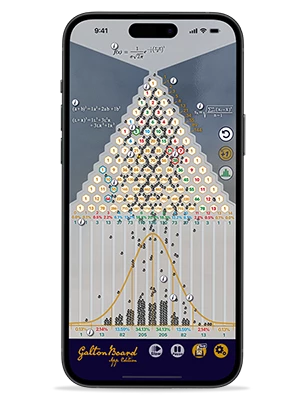
Start with Bernoulli's building block: a trial with two outcomes, success or failure, probability p and 1 minus p. Run it n times. Count the successes. That count follows the binomial distribution — a discrete staircase of probabilities, one bar for each possible outcome.
De Moivre asked: as "n gets large, what happens to the shape of that staircase?"
The answer — which he published in a privately circulated Latin pamphlet in 1733, later incorporated into his masterwork The Doctrine of Chances — was that the staircase smooths into a continuous curve. Specifically: as n grows, the binomial distribution approaches the normal distribution. The histogram shown on our coin becomes the bell curve on the coin. The formula says it precisely: the binomial approximates a normal distribution centered at np, with variance np times 1 minus p.
This is the De Moivre-Laplace theorem. It is a special case of what would later be called the Central Limit Theorem in 1920 — widely regarded as one of the most important results in all of statistics. And here is the big idea it contains: this is the reason averages behave predictably — even when the underlying data does not.
Here is why that matters so much.
The normal distribution is symmetric, bell-shaped, and completely described by just two numbers: the mean, which tells you where the center is, and the standard deviation, which tells you how spread out the results are. Once you know those two numbers, you know everything about the distribution. You can calculate the probability of any outcome. You can say with precision how likely it is to end up within one standard deviation of the center, two standard deviations, three and so on.
And here is the astonishing thing. The normal curve doesn't just describe coin flips. In 1810 Pierre Laplace discovered it appears wherever many small independent influences add together to produce an outcome — under remarkably broad conditions: the heights of people in a population, the measurement errors of astronomers, the scores of students on an exam. The same curve. Appearing across many different contexts. Drawn from completely different processes, by completely different forces — converging on the same shape.
"Both leaves grew on the same branch"
"42 inches for this soldier"
De Moivre lived to eighty-seven — remarkable for any era, extraordinary for the seventeenth century. Near the end of his life, according to a story that may be apocryphal but is too good to omit, he noticed that he was sleeping fifteen minutes more each night than the night before. He calculated the date on which his required sleep would reach twenty-four hours. He predicted he would die on that day.
He did.
A man who spent his career measuring the probability of outcomes, making one final calculation — about himself.
It's easy to look back at the 1700s as a world away from our own. But with a single discovery, de Moivre bridged the centuries.
For investors, the normal distribution is the foundation of modern risk measurement — and also the source of one of its most important limitations.
The standard deviation of returns — the number that every fund fact sheet reports as a measure of volatility — is a concept that only fully makes sense within the framework de Moivre built. A portfolio with a standard deviation of 15 percent is, in normal distribution terms, one where roughly two thirds of annual returns fall within 15 percentage points of the average, and roughly 95 percent fall within 30 points.
That framework has enabled many major advances in quantitative finance since Nobel laureate Harry Markowitz pioneered modern portfolio theory in 1952. Portfolio construction, options pricing, risk management — all of it rests on the bell curve de Moivre described in a London coffee house in 1733.
"Thank you. Great coffee!"
There's a caveat that is real and worth stating. Many models of financial returns assume normality — but real markets have fatter tails than the bell curve predicts. Extreme events happen more often than the model suggests. Every serious risk manager knows this. But you cannot understand where the model breaks down until you first understand the model. And the model begins here.
"Right your move"
We are nine episodes into an 800-year story. Nine more to go. We are at the halfway point — and the curve is about to steepen. The next figures in this series will take de Moivre's normal curve and extend it into territories he never imagined: the mathematics of belief, the geometry of error, the statistics of populations, and ultimately the science of markets.
https://www.ifa.com/coins#pioneers
Connect with an Advisor now!
Sources
Leibniz, G. W. (1989). Philosophical papers and letters (L. Loemker, Ed. & Trans.). Kluwer. (Original works 1665–1716) Hacking, I. (1975). The emergence of probability. Cambridge University Press. Franklin, J. (2001). The science of conjecture: Evidence and probability before Pascal. Johns Hopkins University Press.
Disclosure:
This video is for informational and educational purposes only and does not constitute a solicitation or recommendation to buy or sell any security. The historical and mathematical concepts discussed are intended to illustrate the development of probability theory and its relevance to investing. Past performance is not indicative of future results. All investing involves risk, including the possible loss of principal. Content is AI-assisted. Index Fund Advisors, Inc. is a registered investment adviser. For additional information, please visit adviserinfo.sec.gov or www.ifa.com.















 Home
Home 888-643-3133
 Contact Us
 Newsletter Subscribe
 eMoney
 IFA Apps
 Index Funds Book on Kindle
 Index Funds Audiobook
 Careers
 Facebook
 X
X LinkedIn
 Instagram
 Youtube
 Terms
Terms Index Descriptions