
 Risk Capacity
 FinPlan
 Wealth Management
 Retirement Plans
 Institutional
 Financial
  Open an Account
 IFA App

 Articles
 Charts
 Investor Education ▾
 Fund
Fund
 Store
Store

 Taxes
Taxes Back-testing Disclosures
 Glossary
 Form CRS
Pioneers of Probability: Adriene-Marie Legendre

Disclosure:
Disclosure: This video is for informational and educational purposes only and does not constitute a solicitation or recommendation to buy or sell any security. The historical and mathematical concepts discussed are intended to illustrate the development of probability theory and its relevance to investing. Past performance is not indicative of future results. All investing involves risk, including the possible loss of principal. This video contains AI-generated content. Index Fund Advisors, Inc. is a registered investment adviser. For additional information, please visit adviserinfo.sec.gov or www.ifa.com.
It is 1801. In Palermo, Sicily. The astronomer Giuseppe Piazzi has spotted something new — a faint point of light moving against the stars. He tracks it night after night, but before he can pin down its orbit, it vanishes into the sun's glare. All he leaves behind for other astronomers is a handful of imperfect observations — each one slightly different from what any simple orbital model predicts.
The measurements are real. So are the errors. Given imperfect, inconsistent data, what's the best estimate of the true orbit? This isn't a gambling problem. It's the central practical problem of quantitative science: "We have data, we have a model, and the data never fits perfectly. How do we find the curve that comes closest to the truth?"
For centuries, scientists answered differently — averaging measurements, trusting the most reliable observation, or simply picking the result that fits their preferred theory. There was no agreed method, no proof that any approach was optimal. Until a French mathematician published a four-page appendix to a book about cometary orbits. Welcome to Pioneers of Probability with me Mark Hebner.
Adrien-Marie Legendre was one of the great mathematicians of the late eighteenth and early nineteenth centuries — and one of the least celebrated.
He made fundamental contributions to number theory, elliptic integrals, and geodesy, and helped standardize the metric system.
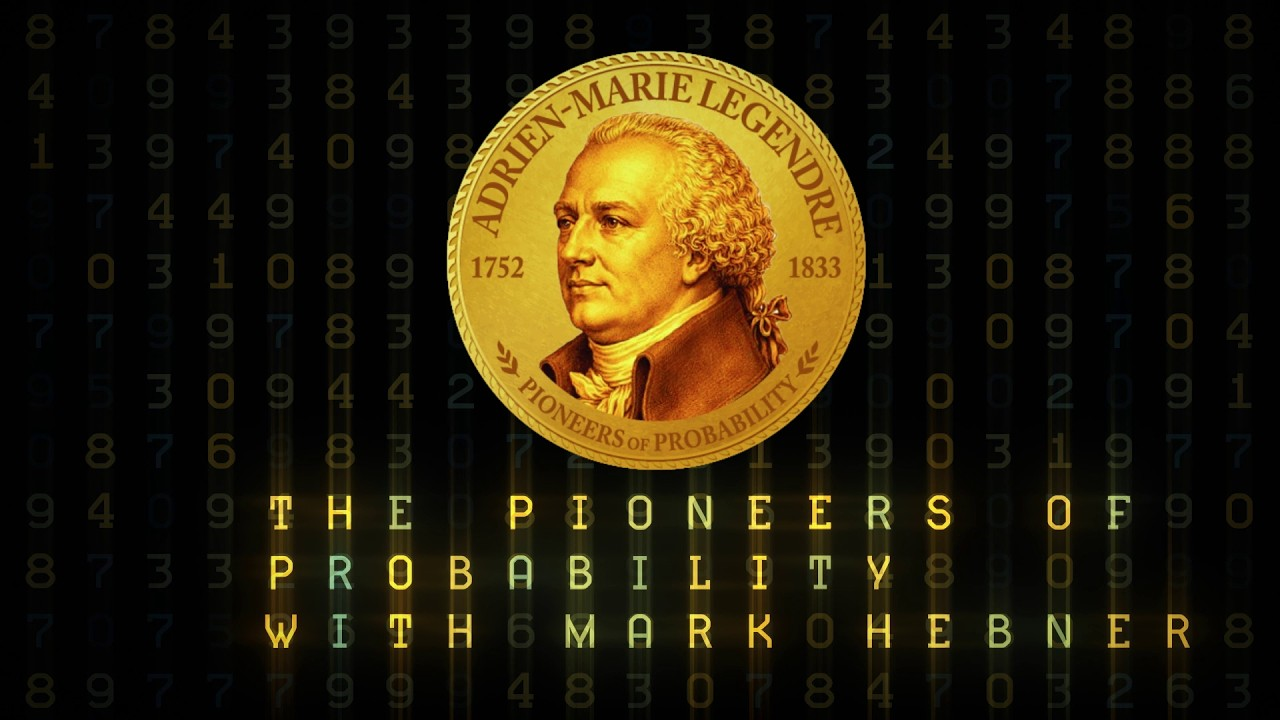
He was, by all accounts, modest and private — so private that almost no portraits of him survive; the image on our coin is based on one of the only likenesses that exists.
In 1805, Legendre published Nouvelles Méthodes pour la Détermination des Orbites des Comètes — New Methods for the Determination of Comet Orbits.
The book was about astronomy, but tucked into an appendix was something more consequential than anything in the main text: the method of least squares. His introduction was characteristically direct:
"Of all the principles that can be proposed for this purpose, I think there is none more general, more exact, or easier to apply than the one we have used in this work, which consists of making the sum of the squares of the errors a minimum."
Simple. Clear. Transformative.
In the last episode, Pierre-Simon Laplace imagined a demon who knew the position of every particle in the universe and needed no statistics. The rest of us have imperfect instruments and noisy data. Least squares is the tool we use instead.
The formula on our coin states it precisely: the sum of (yi minus f(xi)) squared equals minimum. In plain language: for each data point, take the difference between the observed
value and what your model predicts. Square each difference —
this keeps positive and negative errors from canceling out, and penalizes large errors more than small ones. Sum the squared differences, then find the function that makes that sum as small as possible.
That function is your best fit — not perfect, but optimal in the precise sense that no other function in that class produces a smaller total squared error.Squaring the differences (rather than using absolute values) makes the minimization mathematically tractable: when noise is roughly random, the result is a smooth surface with a well-defined minimum. Legendre had found not just a method but a method with a proof — a principled way to extract signal from noise.
The scatter plot on the coin shows it in practice: data points around a line, positioned so the sum of squared vertical distances from each point to the line is as small as possible.
That's the least squares regression line — the best linear description of the relationship between two variables, given the data you have.
Six years later, German mathematician Carl Friedrich Gauss would announce he'd developed the same method in 1795 — a decade earlier than Legendre — but never published it.
Gauss added a deeper justification: "If measurement errors follow a normal distribution, least squares is the maximum likelihood estimate — the function most likely to have generated the observed data."
"Wenn die Beobachtungsfehler einem bestimmten Wahrscheinlichkeitsgesetz folgen, so liefert die Methode der kleinsten Quadrate diejenige Größe, welche am wahrscheinlichsten aus den vorliegenden Beobachtungen hervorgegangen ist."
The priority dispute embittered Legendre for the rest of his life. We'll meet Gauss fully in the next episode, and his justification of least squares is one of the great results in mathematical statistics — but the method itself, the tool that spread through science, was Legendre's.
Within a generation, least squares had transformed astronomy, geodesy, and physics, giving scientists a reproducible method for fitting models to data.
In the twentieth century it became the foundation of regression analysis — and regression analysis became the foundation of empirical economics, psychology, medicine, and finance.
Every time a researcher fits a line to data or estimates the effect of one variable on another, they're using logic Legendre published in that four-page appendix in 1805.
For investors, least squares is the mathematical engine beneath some of the most important empirical results in finance.
In 1964, William Sharpe's capital asset pricing model, which relates expected return to systematic risk, was built using regression analysis.
In 1993, Eugene Fama and Ken French's three-factor model, identifying market, size, and value as drivers of returns, was estimated the same way.
In the modern day, performance attribution, risk decomposition, and factor exposure analysis — the tools investors use to understand where returns come from — all rest on the method Legendre introduced.
When a portfolio manager cites a fund's beta of 0.8, or a value tilt of 0.3, those numbers come from least squares regression: the line fitted through years of return data, minimizing the sum of squared errors, to estimate the relationship between the fund and the factors driving it.
For the index investor, factor research built on least squares has repeatedly suggested that
systematic risk factors — market, size, value, profitability, and investment — explain a meaningful portion of the variation in portfolio returns.
Those findings are grounded in empirical analysis. The evidence points toward a consistent theme: broad, low-cost exposure to these factors, as examined in the academic literature.
The best fit line through the data points toward the conclusions discussed throughout this series.
We are thirteen steps into an 800-year story. Five more to go.
Sources: Legendre, A.-M. (1805). Nouvelles méthodes pour la détermination des orbites des comètes [New methods for the determination of comet orbits]. Courcier. Stigler, S. M. (1986). The history of statistics: The measurement of uncertainty before 1900. Harvard University Press.











 Home
Home 888-643-3133
 Contact Us
 Newsletter Subscribe
 eMoney
 IFA Apps
 Index Funds Book on Kindle
 Index Funds Audiobook
 Careers
 Facebook
 X
X LinkedIn
 Instagram
 Youtube
 Terms
Terms Index Descriptions