Market Declines and Volatility

Hi, I'm Mark Hebner, Founder and CEO of Index Fund Advisors and welcome to ifa.com where we're going to discuss market declines and volatility. It's one of our investors' favorite topics. The first thing you have to understand is all prices reflect all available information all the time. Here's a nice little graphic originally put together by the good folks over at Dimensional. It shows you on the left that all available information is visible and available to market investors around the globe. We estimate maybe 10 million traders in any one day. They take all this information and combine it into a company's prospects for the future. This is a process called price discovery, and that price is a reflection of all of this information and the aggregate expectations about risk and return for these particular securities around the world.
If we were to go back and look at the Market's response to different crises going back to 1987, you might ask yourself, "How long did it take to recover after this decline?" In October 1987 what we show in this chart is what happened in one year, three years, and five years after the crisis occurred. These are total returns over those periods. In October 1987, one year later, the market was up 19 percent. Three years later, it was up 33 percent. And finally, five years later, it was up 76 percent.
How about the U.S. Savings and loan crisis back in August of 1989. A year later it was still down about 2 percent, but then three years later, it was up 23 percent, and by five years, it was up 61 percent.
We had the Asian Contagion with the Russian Crisis, and the Long-term Capital Management collapse in September of 1998. One year later it was up 16 percent. Three years later, it was up 25 percent, and five years later, it was up 52 percent.
In March 2000, we had the dot-com bubble burst. I remember this one very well because we started Index Fund Advisors in March of 1999, but we didn't really trade in client accounts until November. So it wasn't long after we started trading that the dot-com crash came along. A year after the dot-com crash, the market was only up two percent. Even three years later it was only up two percent. But five years later it had a pretty good come back, and it was up 51 percent.
In September 2001 we had the horrific terrorist attack on the United States. You can see a year later the market was still negative at minus one percent. But at three years, the market was up 40 percent. And at five years, it was up 81 percent. Now the other thing to keep in mind is that within a five year period, there is a lot of other small or large news stories that can be moving the market.
In September 2008, we had the well-known global financial crisis. A year later the market had only recovered by four percent. At three years, the market was up 12 percent. And at five years the market is up 47 percent. So, if you look at all these five-year returns, they're all quite substantial and something you should be keeping in mind.
Over the years I've been doing this, clients aren't just worried after a market decline. They're also worried after a market high that it's going to crash at some point in time. So, we're going to have two charts here that deal with this concept of trying to time the market. They are both based on what has happened in the past. This addresses this idea about what you're going to hear on CNBC and Bloomberg. They like to say the markets are going down or going up. There is no going. There's only gone. The reason the word "going" is eliminated is because of the fair price that's reached in markets during the price discovery process we talked about earlier.
If we're always starting at a fair price, there's an equal chance that the next price will be above or below the fair price to generate the fair return. The buyers of securities are taking on this risk, and therefore, they have a positive expected return that's based on the risk of the investment. So, when we say that markets have an equal chance to go up or down that's based on historical observations and relative to the fair return.
So let's take a look at this chart. This is after we reached a monthly high in markets that hasn't been obtained in the past, and here we can see that a year later after reaching those highs, the annualized return was 13.7 percent. Three years later after reaching that high, it averaged 10.6 percent annualized return. And at five years, 10.2 percent.
What about the reaction to market declines? As you can see, the reaction of the market is similar as it pertains to market lows and market highs. 11.7 after one year, 10.3 after three, and 9.6 percent at the five-year mark.
Trying to pick the fastest lane when you're driving is a very stressful activity in traffic. It's kind of the same thing in investing. The lane's going this way. We'd better go over here. It's going faster. When it comes to the idea of markets going up or going down, people think we should move around. All that's doing is adding anxiety, and you actually have to get lucky several times actually decide when to get out when to get in. If you want to continue to play that game, historical evidence suggests it is only a matter of luck as to whether you'll do better than just a buy and hold type investment.
So, a couple reminders here is that nobody can reliably forecast the market's direction or predict which stock or investment manager will outperform. That's a pretty bold statement given the fact there's an entire industry who charges clients to do just that. There are a number of studies we have in my book and on our website that document this. You might be thinking, "Well, wait a minute. What about this person who actually did it in the past?" What the academics have concluded in looking at these past winners is that it was just a chance outcome, a lucky bet if you will, at a particular point in time that worked out for them. But there is a lack of consistency of this performance, or what's often called by the academics, a lack of persistence of performance. So, an I-F-A financial advisor can help you stay disciplined in your investments by creating an investment plan that focuses on actions intended to improve your investment experience and help you to avoid making these volatility mistakes that we often see in investors.
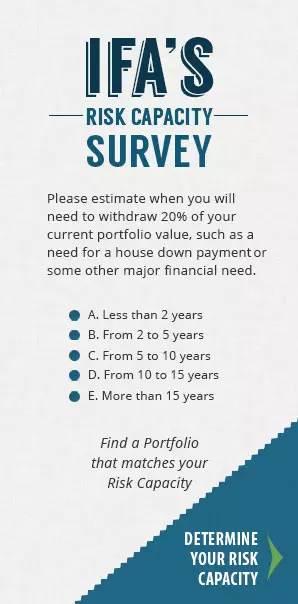
So what are the things that we can actually control in our investments that help us be better investors? First of all, we can diversify. We can spread out these risks so we are subjected to less volatility and less concentrated bets. The other thing we can do is make sure you're in a risk appropriate investment allocation by having stocks and bonds in a mix so that the volatility is something that you're actually comfortable and capable of holding. We can also focus on a good investment strategy going forward which would include buying, holding and rebalancing while slowly reducing your risk over time through a glide path. Also, when opportunities present themselves, engage in a tax loss harvesting investment strategy. You also want to keep your costs low, and you can do that through a passive investing strategy. And lastly, you want to stick to your risk capacity and spend your risk budget wisely. Your risk budget is basically how much risk you can afford to hold based on your score on our Risk Capacity Survey.
I hope this video helps you be a better investor, and calmed you nerves a bit when it comes to market volatility. See you next time.
DISCLOSURES:
Please pause the video to read all important disclosures related to performance data, the assumptions used, and other inherent risks. This video was produced using AI technology.
This video is provided for informational purposes only and should not be construed as a solicitation, recommendation, or endorsement of any particular security, product, or service, nor should they be considered investment or tax advice. Investing involves risks, including potential loss of principal, and there is no guarantee that any investment strategy will be successful. Past performance is not indicative of future results, and no investment decisions should be based solely on the content of this video.
All examples and historical data are provided for illustrative purposes and do not guarantee future outcomes.
Index Fund Advisors, Inc. is a registered investment adviser. For more information, please review our Form ADV at https://www.adviserinfo.sec.gov.


 X
X