IFA Index Portfolio 100 S2B2S2B2100IFA Index Portfolio 95 S2B2S2B295IFA Index Portfolio 90 S2B2S2B290IFA Index Portfolio 85 S2B2S2B285IFA Index Portfolio 80 S2B2S2B280IFA Index Portfolio 75 S2B2S2B275IFA Index Portfolio 70 S2B2S2B270IFA Index Portfolio 65 S2B2S2B265IFA Index Portfolio 60 S2B2S2B260IFA Index Portfolio 55 S2B2S2B255IFA Index Portfolio 50 S2B2S2B250IFA Index Portfolio 45 S2B2S2B245IFA Index Portfolio 40 S2B2S2B240IFA Index Portfolio 35 S2B2S2B235IFA Index Portfolio 30 S2B2S2B230IFA Index Portfolio 25 S2B2S2B225IFA Index Portfolio 20 S2B2S2B220IFA Index Portfolio 15 S2B2S2B215IFA Index Portfolio 10 S2B2S2B210IFA Index Portfolio 5 S2B2S2B25IFA Index Portfolio 0 S2B2S2B20
Market Coin icon

Market Coin

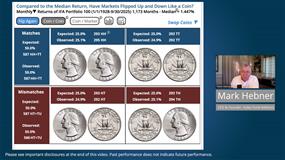
A coin flip serves as a good theoretical framework to demonstrate the principles of randomness in the direction of the returns of an index. The two sides of the MarketCoin are labelled Above and Below the Median Return of an index. The flip of the coin can be compared to the Index Portfolio data below and demonstrate the randomness and unpredictability of returns as described by the Random Walk and Efficient Market Hypotheses.

SPIEs
SPIEs
Coins and Market
Coins and Market
The Hebner Model: News, Price, Risk & Returns
Daily 30 Day Returns
Monthly Returns in Motion
Histograms of SPIEs
Histograms of SPIEs
Bell Curves of Index Portfolios
Bell Curve Comparisons
Histogram of US Market Returns
Risk Premium Distributions
Standard Deviation Ranges