Despite a turbulent start due to global tariff announcements and geopolitical tensions, the second quarter ended strongly for global markets. The S&P 500 rose 10.9%, while global equities performed even better, with the MSCI All Country World ex USA IMI Index up 12.7%. International and emerging markets outpaced U.S. stocks. IT stocks led gains, especially Microsoft and Nvidia, while energy stocks lagged due to falling oil prices. Large-cap and growth stocks outperformed small-cap and value stocks, with profitability premiums mostly negative outside the U.S.1 Central banks responded differently to economic uncertainty—while the U.S. Federal Reserve held interest rates steady, the European Central Bank and Bank of England cut theirs.
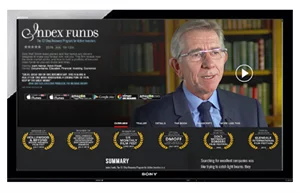
(For a more thorough breakdown, see IFA Founder and CEO Mark Hebner's video below.)
Domestic Equities
What a difference a quarter can make. All six of IFA's domestic equity indexes posted positive returns for the quarter. Large Growth continued to perform well having the best performance in the second quarter with a 18.36% return. Coming in with the second highest return for the quarter was the U.S. Large Company Index with a 11.22% return followed by U.S. Small Growth with a return of 10.14%. Year to date as of 6/30/25 all U.S. Large Indexes are positive while U.S. Small Indexes are slightly negative.
International Equities
International Indexes continued their outperformance as all finished the quarter in positive territory. The IFA International Value Index which ended Q1 positive posted another double digit return of 10.93% for Q2. Coming in with the highest return for the quarter was the IFA International Small Company Index returning 17.35% followed by the IFA International Small Cap Value Index at 15.11%. Year-to-date as of 6/30/25 all International Indexes have returned more than 20% leading the way as the best performing asset class. This is why we constantly adhere to the principle of diversification as we do not know which asset class will perform the best quarter-to-quarter or year-to-year. For more on what a diversified portfolio should look like click here.
Emerging Markets Equities
Stocks issued by companies based in developing countries had positive results for the quarter with all of IFA's Emerging Market Indexes posting positive returns for Q2. The IFA Emerging Markets Small Cap Index led the way coming in with a 15.24% return followed by the IFA Emerging Markets Index returning 12.87%. The IFA Emerging Markets Value Index came in third returning 12.04% for the quarter. Year-to-date as of 6/30/25 all Emerging Market Indexes are up double digits.
Real Estate Equities
For the quarter REITs returned a positive result. IFA's Global REIT Index ended the quarter up posting a positive return of 2.98%. Year-to-date as of 6/30/25 IFA's Global REIT Index is up 5.88%.
Fixed-Income
For Q2, IFA's fixed-income benchmarks all produced returns topping 1%. The IFA Short Term Government Index finished the quarter with a postive 1.00% return. The IFA Five-Year Global Fixed Income Index came in with a return of 1.07%. Whereas the IFA One-Year Fixed Income Index and the IFA Two-Year Global Fixed Income Index finished up 1.01% and 1.07% respectively. Year-to-date as of 6/30/25 IFA's Fixed Income Benchmarks are all up over 2%.
IFA Index Portfolios
With both stocks and bonds posting positive returns, IFA Index Portfolios finished the second quarter up for the midway point of the year. Portfolios with heavier weightings to stocks experienced greater returns in Q2 while those titled more towards bonds were positive towards the lower end. For the quarter, our all equity Portfolio 100 returned 8.38% while our portfolio 10 made up of 90% bonds and 10% equity posted a postive 1.55% return.
Below is an overview of how several IFA Index Portfolios performed in Q2 as well as during the previous quarter. All of these returns are shown net of IFA's maximum annual 0.90% advisory fee through June 30, 2025.
Each quarter, we monitor our recommended funds for clients. As part of that process, we've developed a rating system. For a summary of those results, please feel free to check IFA's latest Performance Monitoring Report (PMR).
IFA encourages both novice and experienced investors to discuss their financial situation and investment goals with an IFA wealth advisor, tailoring strategies to their personal risk capacity and long-term objectives. Besides offering an online Risk Capacity Survey, we provide to each client a complimentary and holistic financial plan.
The wealth of IFA's educational materials are available for Apple iOS and Android devices via the IFA App. This free App is available to download from both the Apple App Store and the Google Play Store for Android.
Footnotes
- Dimensional, Q2 Market in Review, July, 2025
Performance results for actual clients that invested in accordance with the IFA Index Portfolio Models will vary from the backtested performance due to the use of funds for implementation that differ from those in the index data, market conditions, investments cash flows, mutual fund allocations, changing index allocations over time, frequency and precision of rebalancing, not following IFA's advice, retention of previously held securities, tax loss harvesting and glide path strategies, cash balances, lower advisory fees, varying custodian fees, and/or the timing of fee deductions.
This is not to be construed as an offer, solicitation, recommendation, or endorsement of any particular security, product or service. There is no guarantee investment strategies will be successful. Investing involves risks, including possible loss of principal. Performance may contain both live and back-tested data. Data is provided for illustrative purposes only, it does not represent actual performance of any client portfolio or account and it should not be interpreted as an indication of such performance. IFA Index Portfolios are recommended based on time horizon and risk tolerance. Take the IFA Risk Capacity Survey (www.ifa.com/survey) to determine which portfolio captures the right mix of stock and bond funds best suited to you. For more information about Index Fund Advisors, Inc, please review our brochure at https://www.adviserinfo.sec.gov/ or visit www.ifa.com.
Hypothetical performance is constructed using historical data and assumptions, including periodic rebalancing and fixed market conditions that are unlikely to fully reflect future outcomes. Such performance is provided solely for illustrative and informational purposes and does not represent actual client portfolio performance or guarantee future results.
Hypothetical scenarios assume adherence to specific models or allocation strategies without considering real-world constraints, such as behavioral tendencies, cash flows, transaction costs, or tax implications, which may significantly impact results. References to diversification, portfolio construction, or market trends are intended to educate and provide historical context but should not be construed as prescriptive or guaranteed strategies for success.
Information provided is based on data and methodologies believed to be accurate but is subject to change as market conditions evolve. Readers are encouraged to further discuss their unique financial situations and specific investment strategies with a qualified advisor before making investment decisions.


