Investing, like a roller coaster, has its ups and downs. One minute you're climbing higher and the next a sudden decline makes your stomach drop. A few reminders can help investors to relax amid the turbulence.
1. Keep Your Eye on the Horizon
When you invest, you can expect that both ups and downs will be part of the ride. Decades of stock market returns demonstrate how often declines can happen. For evidence, look at the largest intrayear declines for the US stock market in every year from 1979 to 2023. Those declines average to -14%. However, 37 of the past 45 calendar years have ended with positive returns for the US stock market (see Exhibit 1). So instead of getting anxious over a near-term drop, keeping an eye on the horizon can help investors keep the queasiness at bay.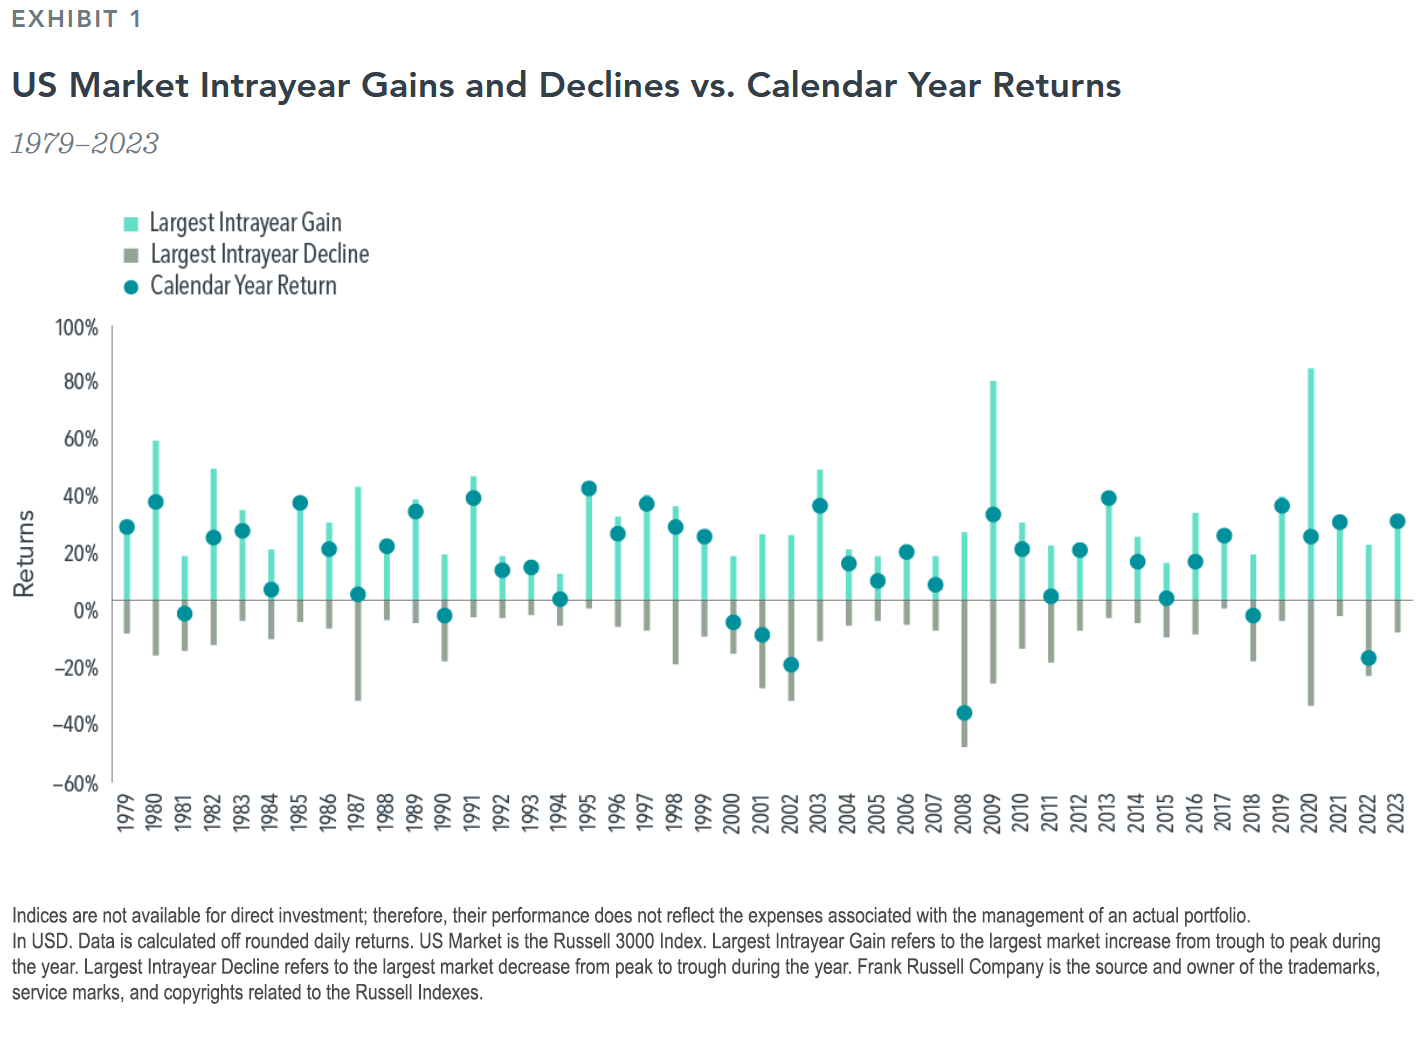
2. Stay in Your Seat
When the stock market drops precipitously, or headlines speculate it might, it can be tempting to jump out of the market to try to avoid (further) losses. But just as roller-coaster riders are warned to keep their seat belts fastened and stay seated, investors may be well advised to do the same.
Attempting to time the market to avoid the worst days could cause an investor to miss out on some of the best days (see Exhibit 2). Consider that $1,000 invested in the S&P 500 Index back in 1990 would have grown to $27,221 by the end of 2023 if left untouched. However, if an investor had pulled their money out and missed the single best day over the more than 30-year period, their ending wealth would be reduced by nearly $3,000. Worse, if an investor had missed the five best single days, their ending wealth would be reduced by more than $10,000. Over the course of decades, even a few days can make a big difference.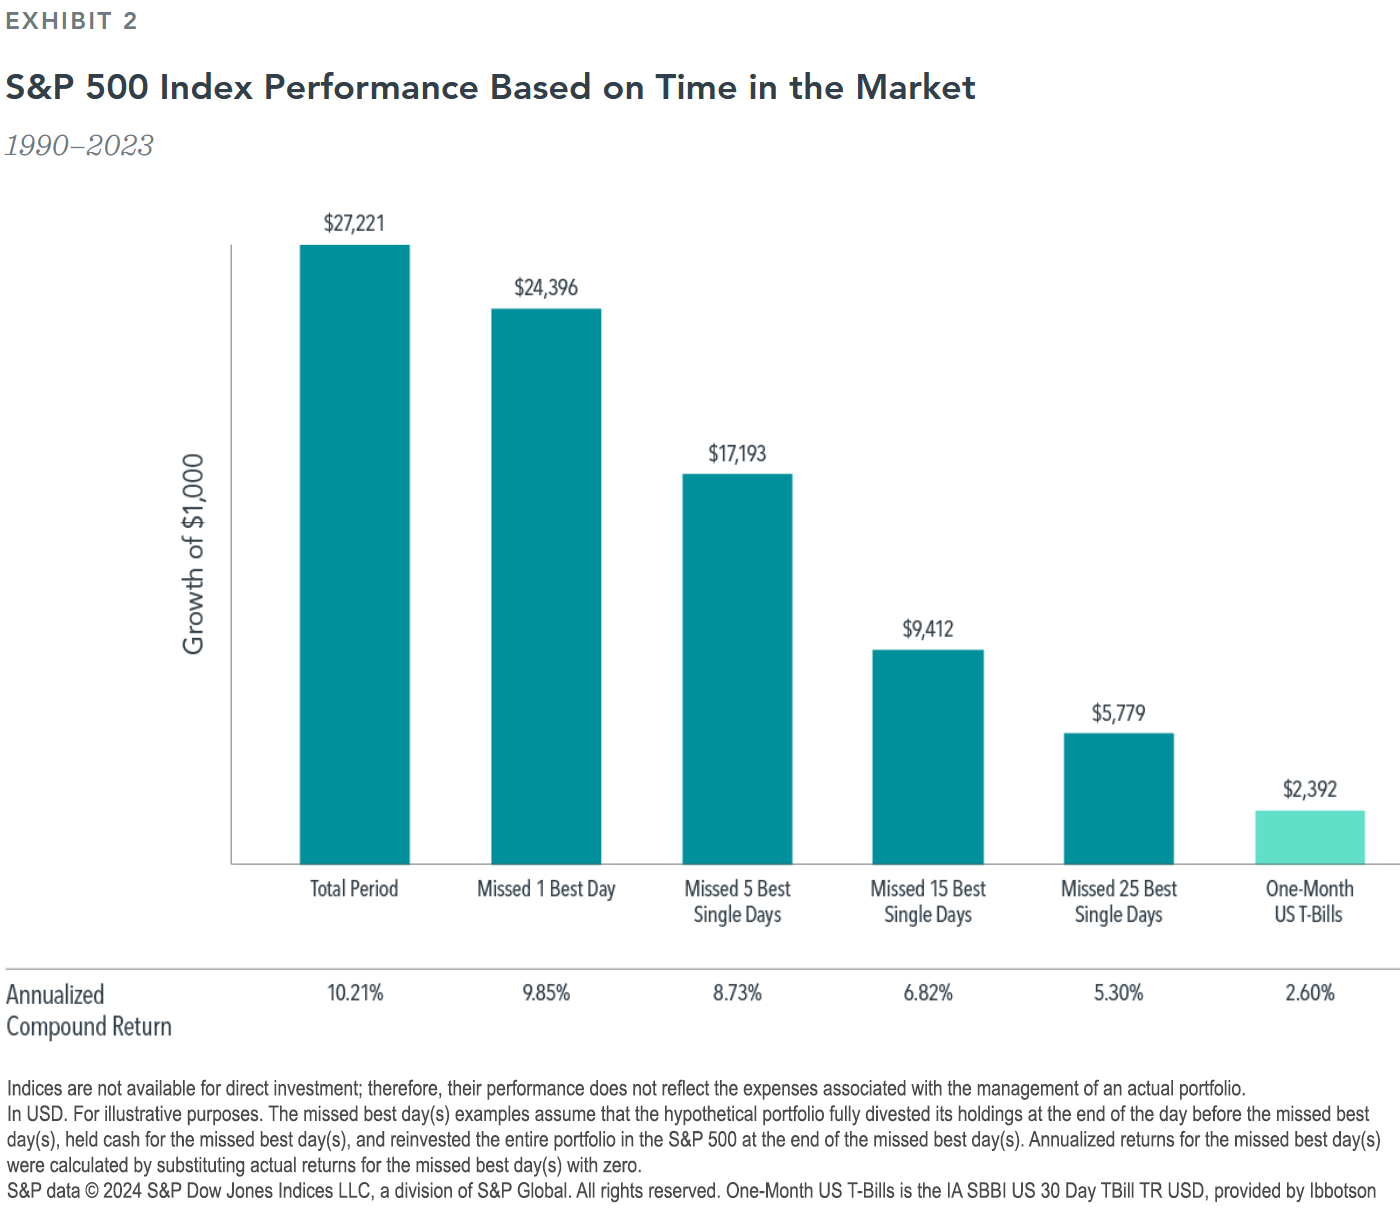
Taking a step back from the current moment may provide investors helpful perspective and put fears at ease. Markets have marched upward through the decades, even amid concerning world events, and rewarded disciplined investors over time (see Exhibit 3). This reminds investors that, despite the extreme headlines and bumps experienced in the short term, you may have a better ride by staying in your seat.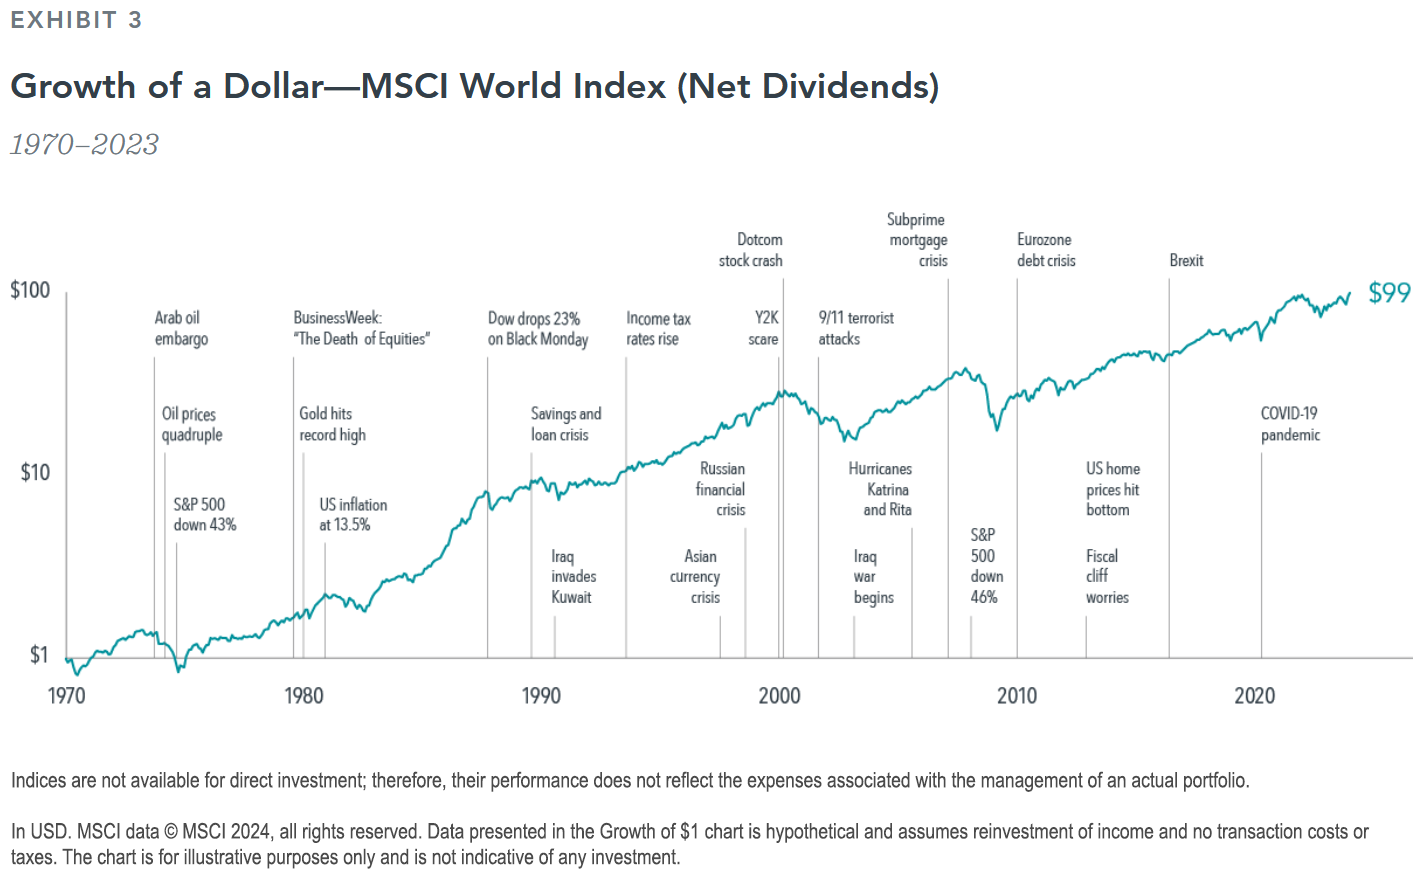
3. Know Your Thrill Tolerance
The same way theme-park goers can choose rides that align with their thrill tolerance, investors can choose an asset allocation that aligns with their risk tolerance. Financial advisors can play a key role in helping you do just that—by exploring your investment objectives and time horizons, and helping you build a diversified portfolio with the appropriate level of resilience (see Exhibit 4).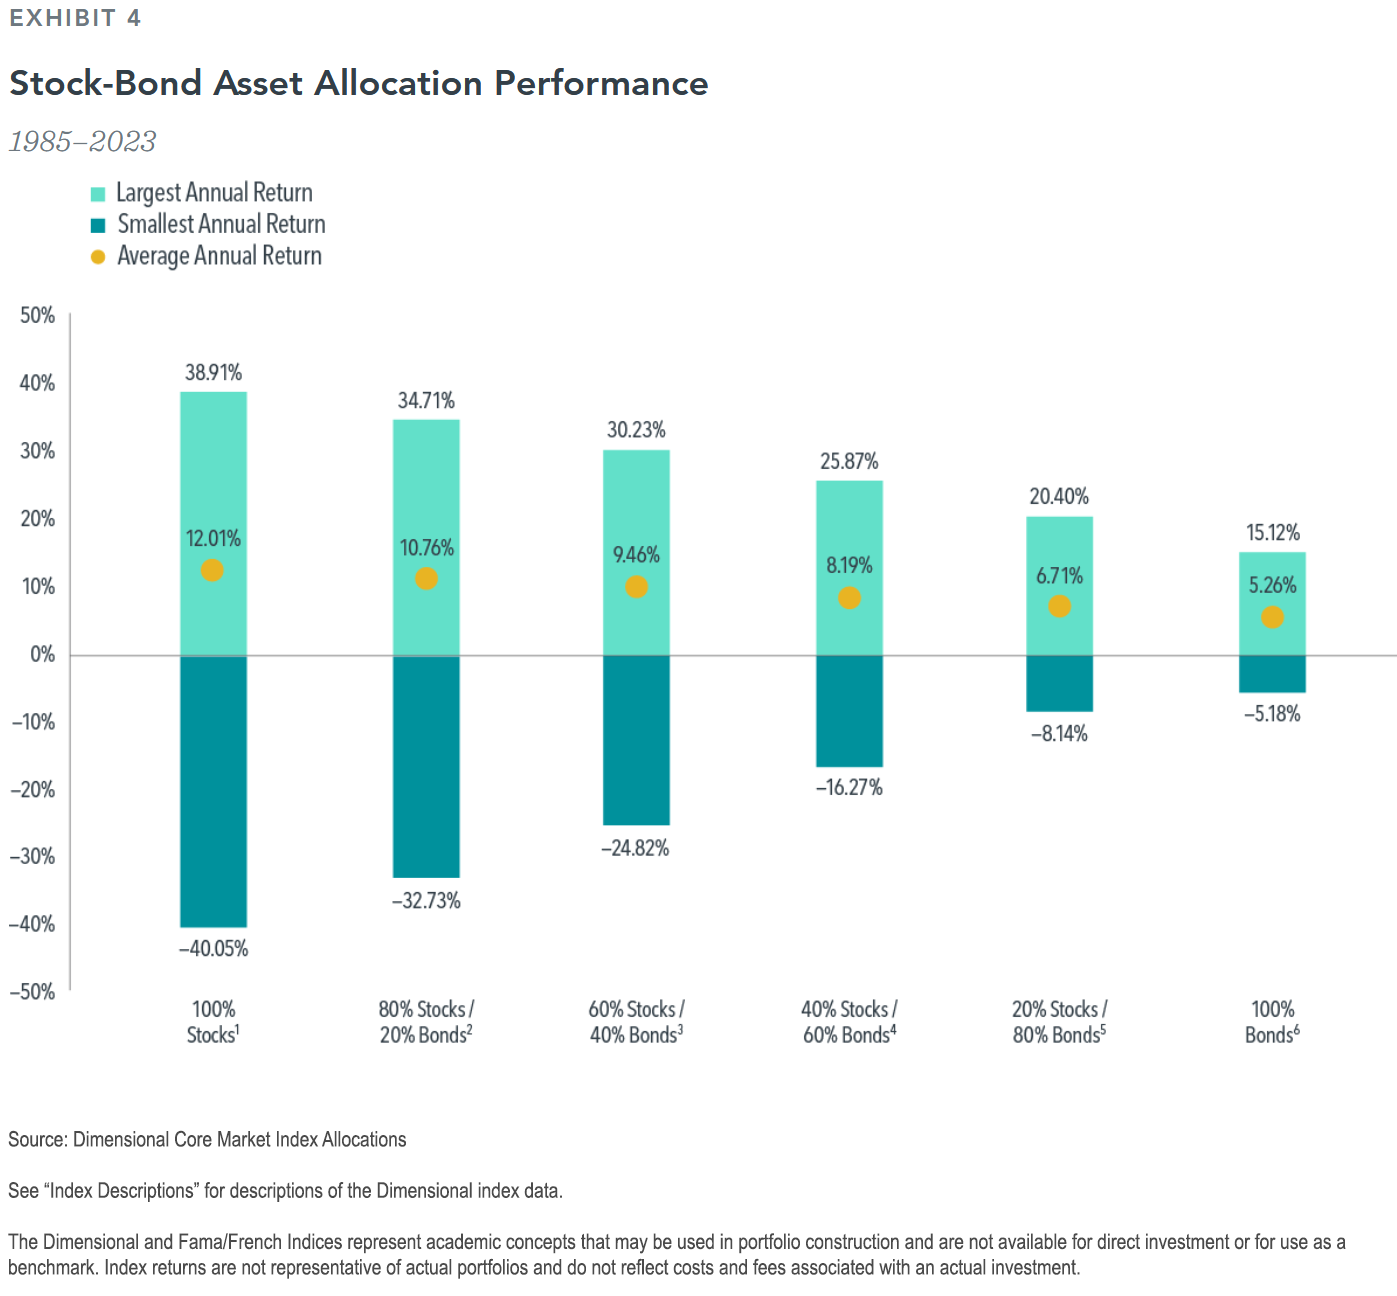
Investing doesn't have to be a harrowing, white-knuckle experience. A few simple reminders and the help of an investment professional can give you the confidence to ride out the rough patches.
Footnotes
1. The Dimensional Core Market 100/0 Index Allocation combines the following indices: Dimensional US Core Equity Market Index, Dimensional International Core Equity Market Index, Dimensional Emerging Markets Core Equity Market Index, and the S&P Global REIT Index (gross dividends).
2. 80% of the weight is allocated to the Dimensional Core Market 100/0 Index Allocation, and 20% of the weight is allocated to the following indices: Dimensional Short-Term Extended Quality Index (10%) and Dimensional US Core Fixed Income Index (10%).
3. 60% of the weight is allocated to the Dimensional Core Market 100/0 Index Allocation, and 40% of the weight is allocated to the following fixed income indices: Dimensional Short-Term Extended Quality Index (25%) and Dimensional US Core Fixed Income Index (15%).
4. 40% of the weight is allocated to the Dimensional Core Market 100/0 Index Allocation, and 60% of the weight is allocated to the following indices: Dimensional Short-Term Extended Quality Index (40%) and Dimensional US Core Fixed Income Index (20%).
5. 20% of the weight is allocated to the Dimensional Core Market 100/0 Index Allocation, and 80% of the weight is allocated to the following indices: Bloomberg US TIPS Index (10%), Dimensional US Ultra-Short Fixed Income Index (10%), Dimensional Short-Term Extended Quality Index (50%), and Dimensional US Core Fixed Income Index (10%).
6. The Dimensional Core Market 0/100 Index Allocation combines the following indices: Bloomberg US TIPS Index (20%), Dimensional US Ultra Short Fixed Income Index (20%), and Dimensional Short-Term Extended Quality Index (60%).
This article originally appeared March 4, 2025, in DFA's Reserach series article. (https://www.dimensional.com/us-en/insights/reality-check-capital-market-assumptions-vs-actual-returns). It is republished here with permission of Dimensional Fund Advisors LP. No further republication or redistribution is permitted without the consent of Dimensional Fund Advisors LP.
Index Descriptions
The Dimensional Indices have been retrospectively calculated by Dimensional Fund Advisors LP and did not exist prior to their index inception dates. Accordingly, results shown during the periods prior to each index's index inception date do not represent actual returns of the index. Other periods selected may have different results, including losses. Backtested index performance is hypothetical and is provided for informational purposes only to indicate historical performance had the index been calculated over the relevant time periods. Backtested performance results assume the reinvestment of dividends and capital gains.
Dimensional Core Market 100/0 Index Allocation: Dimensional Index Allocation data compiled by Dimensional. The Dimensional Core Market 100/0 Index Allocation combines the following indices: Dimensional US Core Equity Market Index, Dimensional International Core Equity Market Index, Dimensional Emerging Markets Core Equity Market Index, and the S&P Global REIT Index (gross dividends). The weight of the REIT index is based on the market capitalization weight of equity REITs within the global universe of eligible stocks and equity REITs, rounded to the nearest 1%. Within the remaining non-REIT allocation, the US equities are overweight relative to their market capitalization weight. The weights of the US, Developed ex US, and Emerging Markets equities are then rescaled to sum to the total non-REIT weight of the Index Allocation and are all rounded to the nearest 1%. Regional weights are determined at each quarter end and held constant for next three months. The Index Allocation returns are calculated monthly as a weighted average of the returns of the underlying indices. The Index Allocation has been retrospectively calculated by Dimensional and did not exist prior to March 2020.
Dimensional Core Market 80/20 Index Allocation: Dimensional Index Allocation data compiled by Dimensional. 80% of the weight is allocated to the Dimensional Core Market 100/0 Index Allocation and 20% of the weight is allocated to the following fixed income indices: Dimensional Short-Term Extended Quality Index (10%) and Dimensional US Core Fixed Income Index (10%). The Index Allocation returns are calculated monthly as a weighted average of the returns of the underlying indices. The Dimensional Short-Term Extended Quality Index is represented by Bloomberg US Government/Credit 1–5 Year Bond Index from January 1985 to December 1995. The Dimensional US Core Fixed Income Index is represented by Bloomberg US Aggregate Bond Index from January 1985 to January 1989 and the US Government/Credit Simulation plus Bloomberg US Mortgage-Backed Securities Index (70% non MBS/30% MBS) from February 1989 to August 2005. The Index Allocation has been retrospectively calculated by Dimensional and did not exist prior to March 2020.
Dimensional Core Market 60/40 Index Allocation: Dimensional Index Allocation data compiled by Dimensional. 60% of the weight is allocated to the Dimensional Core Market 100/0 Index Allocation and 40% of the weight is allocated to the following indices: Dimensional Short-Term Extended Quality Index (25%) and Dimensional US Core Fixed Income Index (15%). The Index Allocation returns are calculated monthly as a weighted average of the returns of the underlying indices. The Dimensional Short-Term Extended Quality Index is represented by Bloomberg US Government/Credit 1–5 Year Bond Index from January 1985 to December 1995. The Dimensional US Core Fixed Income Index is represented by Bloomberg US Aggregate Bond Index from January 1985 to January 1989 and the US Government/Credit Simulation plus Bloomberg US Mortgage-Backed Securities Index (70% non MBS/30% MBS) from February 1989 to August 2005. The Index Allocation has been retrospectively calculated by Dimensional and did not exist prior to March 2020.
Dimensional Core Market 40/60 Index Allocation: Dimensional Index Allocation data compiled by Dimensional. 40% of the weight is allocated to the Dimensional Core Market 100/0 Index Allocation and 60% of the weight is allocated to the following indices: Dimensional Short-Term Extended Quality Index (40%) and Dimensional US Core Fixed Income Index (20%). The Index Allocation returns are calculated monthly as a weighted average of the returns of the underlying indices. The Dimensional Short-Term Extended Quality Index is represented by Bloomberg US Government/Credit 1–5 Year Bond Index from January 1985 to December 1995. The Dimensional US Core Fixed Income Index is represented by Bloomberg US Aggregate Bond Index from January 1985 to January 1989 and the US Government/Credit Simulation plus Bloomberg US Mortgage-Backed Securities Index (70% non MBS/30% MBS) from February 1989 to August 2005. The Index Allocation has been retrospectively calculated by Dimensional and did not exist prior to March 2020.
Dimensional Core Market 20/80 Index Allocation: Dimensional Index Allocation data compiled by Dimensional. 20% of the weight is allocated to the Dimensional Core Market 100/0 Index Allocation and 80% of the weight is allocated to the following indices: Bloomberg US TIPS Index (10%), Dimensional US Ultra-Short Fixed Income Index (10%), Dimensional Short-Term Extended Quality Index (50%), and Dimensional US Core Fixed Income Index (10%). The Index Allocation returns are calculated monthly as a weighted average of the returns of the underlying indices. The Dimensional Short-Term Extended Quality Index is represented by Bloomberg US Government/Credit 1–5 Year Bond Index from January 1985 to December 1995. The Dimensional US Core Fixed Income Index is represented by Bloomberg US Aggregate Bond Index from January 1985 to January 1989 and the US Government/Credit Simulation plus Bloomberg US Mortgage-Backed Securities Index (70% non MBS/30% MBS) from February 1989 to August 2005. The Bloomberg US TIPS Index is represented by the Bloomberg US Treasury Bond Index from January 1985 to February 1997. The Dimensional US Ultra-Short Fixed Income Index is represented by the ICE BofA US 3-Month Treasury Bill Index from January 1985 to January 1999. The Index Allocation has been retrospectively calculated by Dimensional and did not exist prior to March 2020.
Dimensional Core Market 0/100 Index Allocation: Dimensional Index Allocation data compiled by Dimensional. The Dimensional Core Market 0/100 Index Allocation combines the following indices: Bloomberg US TIPS Index (20%), Dimensional US Ultra Short Fixed Income Index (20%), and Dimensional Short-Term Extended Quality Index (60%). The Index Allocation returns are calculated monthly as a weighted average of the returns of the underlying indices. The Dimensional Short-Term Extended Quality Index is represented by Bloomberg US Government/Credit 1–5 Year Bond Index from January 1985 to December 1995. The Bloomberg US TIPS Index is represented by the Bloomberg US Treasury Bond Index from January 1985 to February 1997. The Dimensional US Ultra-Short Fixed Income Index is represented by the ICE BofA US 3-Month Treasury Bill Index from January 1985 to January 1999. The Index Allocation has been retrospectively calculated by Dimensional and did not exist prior to March 2020.
Disclosures
The information in this material is intended for the recipient's background information and use only. It is provided in good faith and without any warranty or representation as to accuracy or completeness. Information and opinions presented in this material have been obtained or derived from sources believed by Dimensional to be reliable, and Dimensional has reasonable grounds to believe that all factual information herein is true as at the date of this material. It does not constitute investment advice, a recommendation, or an offer of any services or products for sale and is not intended to provide a sufficient basis on which to make an investment decision. Before acting on any information in this document, you should consider whether it is appropriate for your particular circumstances and, if appropriate, seek professional advice. It is the responsibility of any persons wishing to make a purchase to inform themselves of and observe all applicable laws and regulations. Unauthorized reproduction or transmission of this material is strictly prohibited. Dimensional accepts no responsibility for loss arising from the use of the information contained herein.
This material is not directed at any person in any jurisdiction where the availability of this material is prohibited or would subject Dimensional or its products or services to any registration, licensing, or other such legal requirements within the jurisdiction.
"Dimensional" refers to the Dimensional separate but affiliated entities generally, rather than to one particular entity. These entities are Dimensional Fund Advisors LP, Dimensional Fund Advisors Ltd., Dimensional Ireland Limited, DFA Australia Limited, Dimensional Fund Advisors Canada ULC, Dimensional Fund Advisors Pte. Ltd., Dimensional Japan Ltd., and Dimensional Hong Kong Limited.
RISKS
Investments involve risks. The investment return and principal value of an investment may fluctuate so that an investor's shares, when redeemed, may be worth more or less than their original value. Past performance is not a guarantee of future results. There is no guarantee strategies will be successful.
UNITED STATES
Dimensional Fund Advisors LP is an investment advisor registered with the Securities and Exchange Commission.
Investment products: • Not FDIC Insured • Not Bank Guaranteed • May Lose Value
Dimensional Fund Advisors does not have any bank affiliates.
CANADA
These materials have been prepared by Dimensional Fund Advisors Canada ULC. The other Dimensional entities referenced herein are not registered resident investment fund managers or portfolio managers in Canada.
This material is not intended for Quebec residents.
Commissions, trailing commissions, management fees, and expenses all may be associated with mutual fund investments. Please read the prospectus before investing. Unless otherwise noted, any indicated total rates of return reflect the historical annual compounded total returns, including changes in share or unit value and reinvestment of all dividends or other distributions, and do not take into account sales, redemption, distribution, or optional charges or income taxes payable by any security holder that would have reduced returns. Mutual funds are not guaranteed, their values change frequently, and past performance may not be repeated.
AUSTRALIA
This material is issued by DFA Australia Limited (AFS License No. 238093, ABN 46 065 937 671). This material is provided for information only. No account has been taken of the objectives, financial situation or needs of any particular person. Accordingly, to the extent this material constitutes general financial product advice, investors should, before acting on the advice, consider the appropriateness of the advice, having regard to the investor's objectives, financial situation and needs. Investors should also consider the Product Disclosure Statement (PDS) and the target market determination (TMD) that have been made for each financial product either issued or distributed by DFA Australia Limited prior to acquiring or continuing to hold any investment. Go to dimensional.com/funds to access a copy of the PDS or the relevant TMD. Any opinions expressed in this material reflect our judgement at the date of publication and are subject to change.
NEW ZEALAND
This material is issued by DFA Australia Limited (incorporated in Australia, AFS License No. 238093, ABN 46 065 937 671). This material is provided for information only. This material does not give any recommendation or opinion to acquire any financial product or any financial advice product, and is not financial advice to you or any other person. No account has been taken of the objectives, financial situation or needs of any particular person. Accordingly, investors should, before acting on the advice, consider the appropriateness of the advice, having regard to the investor's objectives, financial situation and needs. Investors should also consider the Product Disclosure Statement (PDS) and for the Dimensional Wholesale Trusts the target market determination (TMD) that have been made for each financial product or financial advice product either issued or distributed by DFA Australia Limited prior to acquiring or continuing to hold any investment. Go to dimensional.com/funds to access a copy of the PDS or the relevant TMD. Any opinions expressed in this material reflect our judgement at the date of publication and are subject to change.
WHERE ISSUED BY DIMENSIONAL IRELAND LIMITED
Issued by Dimensional Ireland Limited (Dimensional Ireland), with registered office 25 North Wall Quay, Dublin 1, D01 H104, Ireland. Dimensional Ireland is regulated by the Central Bank of Ireland (Registration No. C185067).
WHERE ISSUED BY DIMENSIONAL FUND ADVISORS LTD.
Issued by Dimensional Fund Advisors Ltd. (Dimensional UK), 20 Triton Street, Regent's Place, London, NW1 3BF. Dimensional UK is authorised and regulated by the Financial Conduct Authority (FCA) - Firm Reference No. 150100.
Dimensional UK and Dimensional Ireland do not give financial advice. You are responsible for deciding whether an investment is suitable for your personal circumstances, and we recommend that a financial adviser helps you with that decision.
Dimensional UK and Dimensional Ireland issue information and materials in English and may also issue information and materials in certain other languages. The recipient's continued acceptance of information and materials from Dimensional UK and Dimensional Ireland will constitute the recipient's consent to be provided with such information and materials, where relevant, in more than one language.
NOTICE TO INVESTORS IN SWITZERLAND: This is advertising material.
JAPAN
For Institutional Investors and Registered Financial Instruments Intermediary Service Providers.
This material is deemed to be issued by Dimensional Japan Ltd., which is regulated by the Financial Services Agency of Japan and is registered as a Financial Instruments Firm conducting Investment Management Business and Investment Advisory and Agency Business.
Dimensional Japan Ltd.
Director of Kanto Local Finance Bureau (FIBO) No. 2683
Membership: Japan Investment Advisers Association
SINGAPORE
This material is deemed to be issued by Dimensional Fund Advisors Pte. Ltd. (UEN:201210847M), which is regulated by the Monetary Authority of Singapore and holds a capital markets services license for fund management.
This advertisement has not been reviewed by the Monetary Authority of Singapore or the Central Provident Fund (CPF) Board.
FOR PROFESSIONAL INVESTORS IN HONG KONG
This material is deemed to be issued by Dimensional Hong Kong Limited (CE No. BJE760) ("Dimensional Hong Kong"), which is licensed by the Securities and Futures Commission to conduct Type 1 (dealing in securities), Type 4 (advising on securities) and Type 9 (asset management) regulated activities.
This material should only be provided to "professional investors" (as defined in the Securities and Futures Ordinance [Chapter 571 of the Laws of Hong Kong] and its subsidiary legislation) and is not for use with the public. This material is not intended to constitute and does not constitute marketing of the services of Dimensional Hong Kong or its affiliates to the public of Hong Kong. When provided to prospective investors, this material forms part of, and must be provided together with, applicable fund offering materials. This material must not be provided to prospective investors on a standalone basis. Before acting on any information in this material, you should consider whether it is suitable for your particular circumstances and, if appropriate, seek professional advice.
Neither Dimensional Hong Kong nor its affiliates shall be responsible or held responsible for any content prepared by financial advisors. Financial advisors in Hong Kong shall not actively market the services of Dimensional Hong Kong or its affiliates to the Hong Kong public.


 X
X