Retirement Plan Analyzer

Watch Instructional Video

Download Sample Report This report is offered as a tool for helping investors understand key factors in retirement investing. The charts and graphs generated based on your input to the form below rely on a Monte Carlo simulation method, which simulates 10,000 portfolio outcomes an investor may experience based on long-term historical data. These simulations are illustrative only and rely on multiple assumptions, including historical return and risk data, that may not represent future market conditions or outcomes. The results provided through this tool reflect hypothetical performance and should not be interpreted as guarantees of actual investment results. Significant limitations of this method include the inability to account for all real-life variables, changes in economic conditions, or personal circumstances that could impact outcomes. Any reliance on these results should be accompanied by careful consideration of the assumptions and risks involved in using such projections.

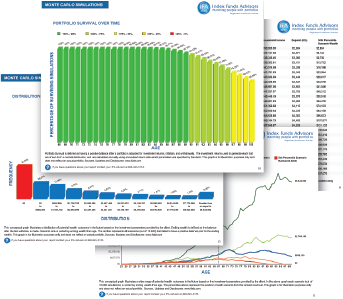
To access the full report, including detailed charts and graphs, you must confirm your acknowledgment of the limitations inherent in hypothetical performance data and the assumptions underlying the Monte Carlo simulations. These results are illustrative and presented for educational purposes only, and should not be construed as guarantees of future performance or personalized investment advice. By proceeding, you agree to consider the significant risks and assumptions associated with the projections and understand that actual market conditions, economic factors, and personal circumstances may vary significantly from those used in this analysis.

Monte Carlo Simulation Request Form

Clear Form
  1. Are you currently retired?

  2. %

  3. %

  4. The standard method of determining safe withdrawal rates during retirement is to take a percentage of your initial retirement portfolio, then adjust that dollar amount for inflation throughout your retirement. IFA also assumes that you will pay your taxes from those withdrawals, and that social security and other sources of income will be in addition to these withdrawals. We suggest 4.5% of your portfolio at retirement. Would you like to see what dollar withdrawals that would provide you?


  5. IFA needs to estimate the expected return and risk (standard deviation) of your Index Portfolio. Would you like IFA to use data beginning in 1928, which includes the Great Depression? If you choose no, IFA will make its estimates of risk and return based on the last 50 years, which does not include the Great Depression.


  6. It is not realistic to assume investors will keep their investments at the same risk level throughout their investing lifetime. Therefore, IFA advises its clients to put their Index Portfolios on a Glide Path, which reduces the Index Portfolio by one number per year, which is a 1% reduction in the equity allocation per year. Would you like IFA to assume you are on the Glide Path?


  7. What kind of investor are you?


These data options, projections, assumptions, and Index Portfolio risk and return assumptions represent historical market conditions and form the basis for hypothetical projections. Projections derived from this data are illustrative and may not indicate actual future risk or return profiles Actual results may vary materially. IFA recommends this analysis be reviewed with your investment advisor.

Contact Information & Download >