Figure 1(permalink)
The most common risk measure is standard deviation — a statistic measurement of volatility
that tells you how tightly the various annual returns are clustered
around the average. When the annual returns
are tightly bunched together the standard deviation is small and the bell-shaped curve is
narrow. When the annual returns
are spread apart and the bell curve is relatively flat, it tells
you that you have a relatively large standard deviation.
The combination
of the average and the standard deviation characterize various bell
curve shapes, and those shapes represent the risk and return of the
Index Portfolio.
Figure 2 shows you graphically what a standard deviation
represents.
Figure 2(permalink)
One standard deviation away from the average in both directions
on the horizontal axis (the yellow area on the graph) accounts
for somewhere around 68 percent of the annual returns in the time
period. Two standard deviations away from the mean (the yellow
and green areas) account for roughly 95 percent of the annual returns.
And three standard deviations (the yellow, green and orange areas)
account for about 99 percent of the annual returns.
Standard Error
 |
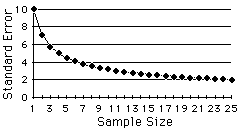
The standard error of the mean
indicates the degree of uncertainty in calculating an estimate from
a sample, like a series of returns data. A standard
error can be calculated from the standard deviation by dividing
the standard deviation by a square root of the sample size. So with only 3 years of returns data
on the S&P 500, the error in the average return is 2.6 times
larger than having 20 years of data.
Figure 3(permalink)
Figure 4(permalink)
Figure 5(permalink)
Figure 6(permalink)
Figure 7(permalink)