To many investors, Atlanta-based Invesco Ltd. is an investment management conglomerate with a history of acquiring large multi-asset fund families across the globe. These days, it's involved in everything from mutual funds and exchange-traded funds to private placements, separately managed accounts, variable insurance funds and a myriad of alternative investment strategies.
Indeed, this firm's history traces its roots to banking. It has also been active in growing through acquistions of other major fund competitors such as the former AIM Investments (1997) and one of the largest players in exchange-traded funds, PowerShares (2006). In May of 2019, it completed the acquisition of OppenheimerFunds, which added $224.4 billion in assets under management.
With nearly $1.85 trillion in assets under management1 and 8,400 employees in 120 countries, Morningstar ranks Invesco as the seventh-largest U.S. retail asset manager. The company's stock trades on the New York Stock Exchange (TICKER: IVZ).
Still, in a consolidating asset-management industry, active competitors — including hedge funds and private equity managers — have reportedly been circling. A much publicized story in recent years involved Nelson Peltz's Trian Partners taking a 9.9% stake in the company in 2020. At the same time, Trian Partners bought a similar-sized chunk of Janus Henderson Group, an Invesco rival.
The move raised eyebrows on Wall Street since it came on the heels of the Peltz-led hedge fund becoming a major Legg Mason shareholder. After pushing for cost-cutting measures and a merger, Legg Mason in 2020 agreed to be acquired by another big rival, Franklin Templeton (NYSE: BEN).
Questions about Trian Partners' designs for Invesco seemed to ebb in early 2022 after Peltz announced he was leaving the fund manufacturer's board. Even so, speculation about Invesco's M&A future lingers. Trian Partners has retained its Invesco shares. Also worth noting: Invesco in recent years has been linked to potential merger partners such as State Street Corp. and JP Morgan, among others.
In a recent analysis of Invesco by Morningstar, strategist Greggory Warren warned that "the company has been far more acquisitive in the past couple of years than in the past, increasing its exposure to the risks associated with mergers and acquisitions, including overpaying for deals, loss of (or overestimation of) synergy opportunities, and insufficient operational diligence during acquisition integrations." 2
He also suggested that Invesco's current management was likely to remain open to joining forces or becoming a buyout target of another large asset-manager. At the same time, the independent analyst pointed out they weren't alone in struggling to increase assets and stem investment outflows. Warren observed:
"A confluence of several issues — poor relative active investment performance, the growth and acceptance of low-cost index-based products, and the expanding power of the retail-advised channel —has made it increasingly difficult for active asset managers to generate organic growth, leaving them more dependent on market gains to increase their assets under management."
Along with such ongoing M&A drama and corporate headwinds, Invesco's rather large family of funds includes "too many that are only decent or are unappealing," according to Morningstar's so-called "Parent" rating of the fund complex as an investment manager. The analysis also highlighted a 2020 rebalancing "mishap" in one of its U.S. index funds that was "avoidable" and wound up costing Invesco "money and diverted attention." 3
As a result, in this installment of IFA's ongoing Deeper Look series we're putting under our microscope the investment strategies run by Invesco's mutual fund managers. Along with independent analysis by leading academics, our own research leads IFA's investment committee to an overarching conclusion about stock and bond jockeys: On the whole, active fund managers have failed to deliver on the value proposition they profess, which is to reliably outperform a risk-comparable benchmark.
Controlling for Survivorship Bias
It's important for investors to understand the concept of survivorship bias, which occurs when performance analyses focus only on funds that currently exist, potentially overstating overall performance by excluding funds that were closed or merged due to poor results. While Invesco currently offers 85 active equity mutual funds with five or more years of performance-related data, the company has historically managed a total of 320 funds in this category. This includes 235 funds that no longer exist, either due to underperformance, mergers, or other reasons. To provide a more comprehensive view, the performance analysis in this article includes both surviving and non-surviving funds, aggregating their results to account for survivorship bias. Details of this aggregate performance analysis can be found in the "Performance Analysis" section.
Fees & Expenses
Let's first examine the costs associated with Invesco's surviving 85 strategies. It should go without saying that if investors are paying a premium for investment "expertise," then they should be receiving above average results consistently over time. The alternative would be to simply accept a market's return, less a significantly lower fee, via an index fund.
The costs we examine include expense ratios, sales loads — front-end (A), back-end (B) and level (C) — as well as 12b-1 marketing fees. These are considered the "hard" costs that investors incur. Prospectuses, however, do not reflect the trading costs associated with mutual funds.
Commissions and market impact costs are real expenses associated with implementing a particular investment strategy and can vary depending on the frequency and size of the trades executed by portfolio managers.
We can estimate the costs associated with an investment strategy by looking at its annual turnover ratio. For example, a turnover ratio of 100% means that the portfolio manager turns over the entire portfolio in one year. This is considered an active approach, and investors holding these funds in taxable accounts will likely incur a higher exposure to tax liabilities, such as short- and long-term capital gains distributions, than those incurred by passively managed funds.
The table below details the hard costs as well as the turnover ratio for all 85 surviving active funds offered by Invesco that have at least five years of complete performance history. You can search this page for a symbol or name by using Control F in Windows or Command F on a Mac. Then click the link to see the Alpha Chart. Also, remember that this is what is considered an in-sample test; the next level of analysis is to do an out-of-sample test (for more information see here).
| Fund Name | Ticker | Turnover Ratio % | Prospectus Net Expense Ratio | 12b-1 Fee | Deferred Load | Max Front Load | Global Broad Category Group |
| Invesco Macro Allocation Strategy Y | GMSHX | 76.00 | 1.22 | Alternative | |||
| Invesco Fundamental Alternatives A | QVOPX | 47.00 | 1.38 | 0.25 | 5.50 | Alternative | |
| Invesco Balanced-Risk Commodity Strat Y | BRCYX | 87.00 | 1.15 | Commodities | |||
| Invesco Convertible Securities Y | CNSDX | 65.00 | 0.69 | Convertibles | |||
| Invesco EQV Asia Pacific Equity A | ASIAX | 15.00 | 1.45 | 0.25 | 5.50 | Equity | |
| Invesco Energy Inv | FSTEX | 28.00 | 1.27 | 0.25 | Equity | ||
| Invesco SteelPath MLP Alpha Plus Y | MLPNX | 26.00 | 7.81 | Equity | |||
| Invesco SteelPath MLP Alpha Y | MLPOX | 101.00 | 2.86 | Equity | |||
| Invesco SteelPath MLP Income Y | MLPZX | 11.00 | 6.31 | Equity | |||
| Invesco SteelPath MLP Select 40 Y | MLPTX | 20.00 | 6.34 | Equity | |||
| Invesco Income Advantage Intl A | GTNDX | 49.00 | 1.29 | 0.25 | 5.50 | Equity | |
| Invesco Income Advantage U.S. Fund R5 | SCIUX | 54.00 | 0.78 | Equity | |||
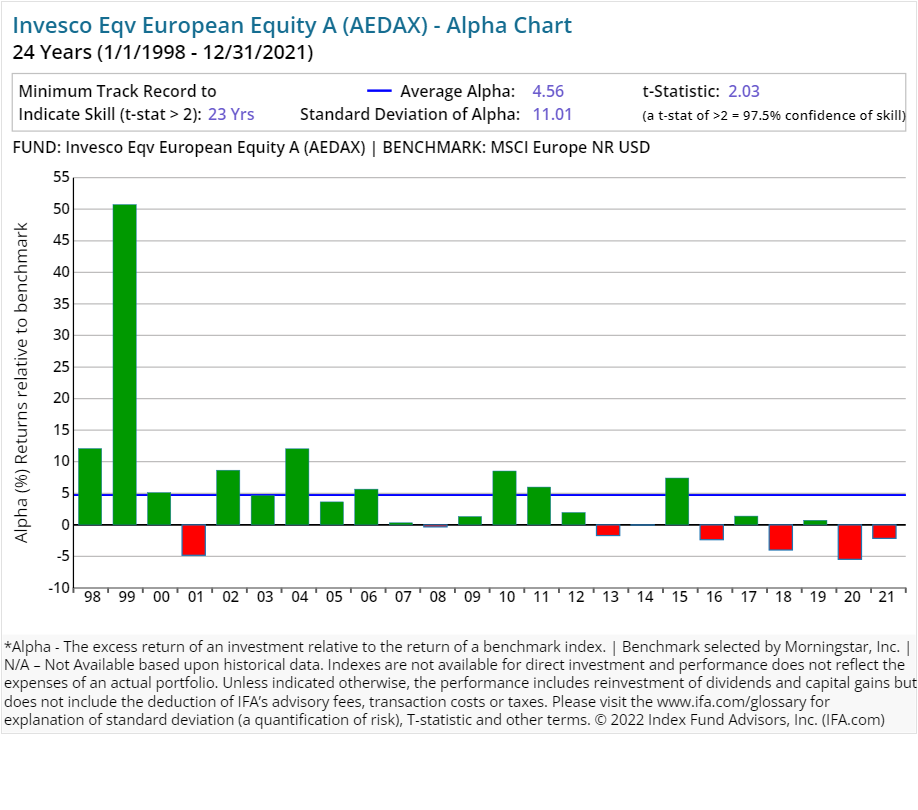
| Invesco EQV European Equity A | AEDAX | 19.00 | 1.42 | 0.25 | 5.50 | Equity | |
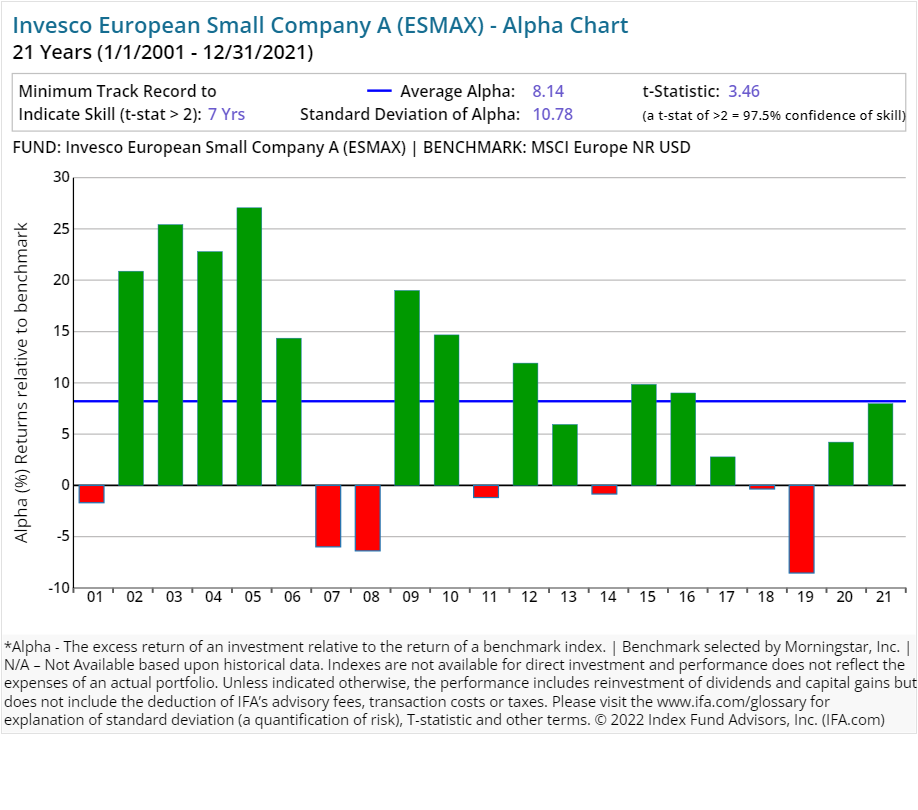
| Invesco EQV Euro Small Company A | ESMAX | 24.00 | 1.45 | 0.25 | 5.50 | Equity | |
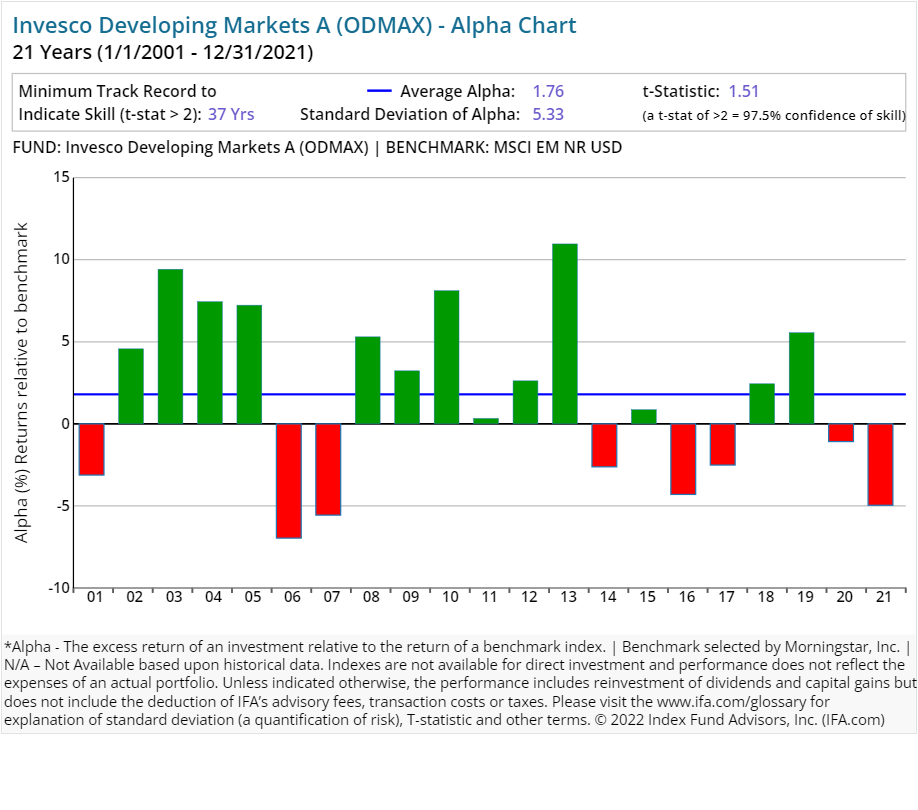
| Invesco Developing Markets A | ODMAX | 43.00 | 1.26 | 0.25 | 5.50 | Equity | |
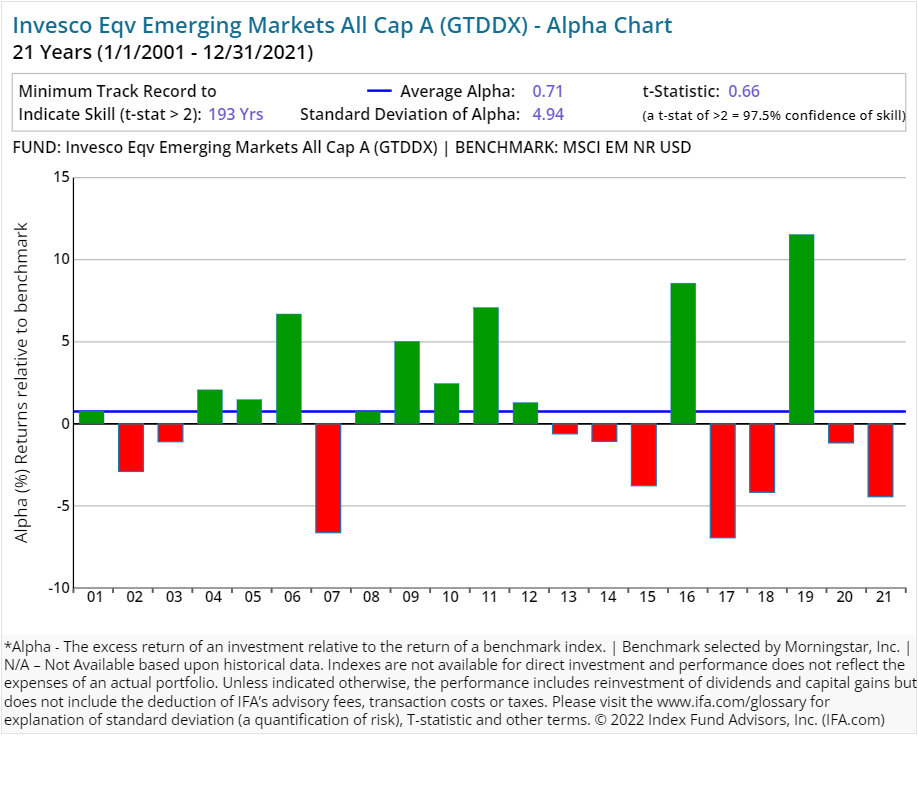
| Invesco EQV Emerging Markets All Cap A | GTDDX | 20.00 | 1.34 | 0.25 | 5.50 | Equity | |
| Invesco Advantage International R6 | QMGIX | 156.00 | 0.94 | Equity | |||
| Invesco EQV International Equity A | AIIEX | 28.00 | 1.27 | 0.25 | 5.50 | Equity | |
| Invesco Global A | OPPAX | 7.00 | 1.06 | 0.23 | 5.50 | Equity | |
| Invesco Global Core Equity A | AWSAX | 107.00 | 1.26 | 0.25 | 5.50 | Equity | |
| Invesco Global Focus Y | GLVYX | 13.00 | 1.03 | Equity | |||
| Invesco International Diversified Y | OIDYX | 7.00 | 1.04 | Equity | |||
| Invesco Oppenheimer International Gr A | OIGAX | 10.00 | 1.10 | 0.24 | 5.50 | Equity | |
| Invesco EQV Intl Small Company A | IEGAX | 11.00 | 1.56 | 0.25 | 5.50 | Equity | |
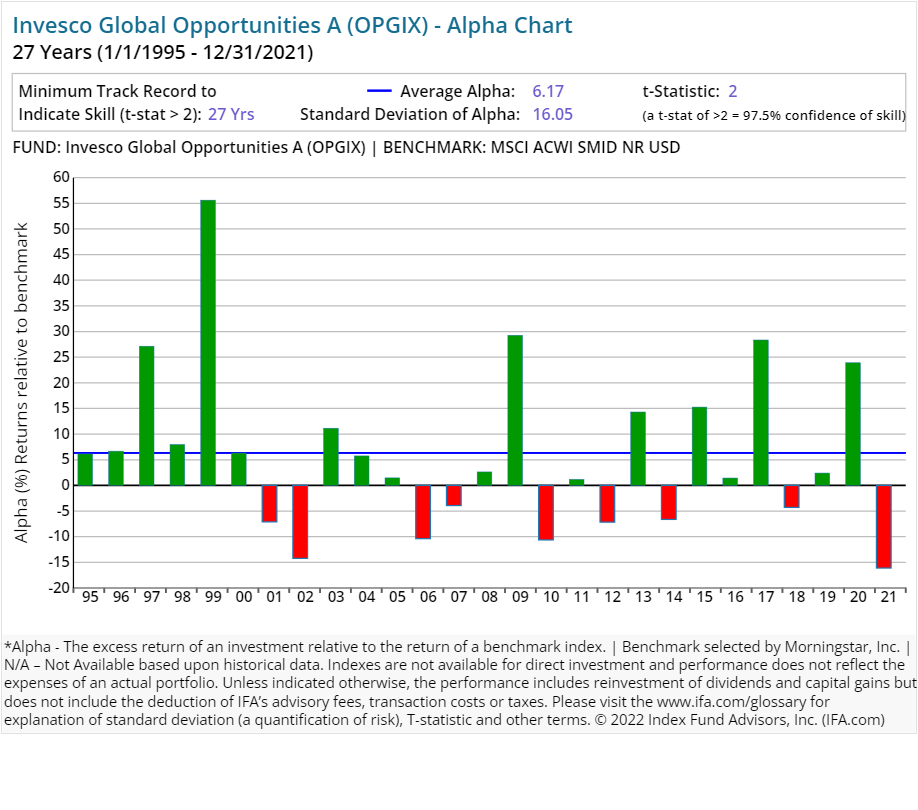
| Invesco Global Opportunities A | OPGIX | 62.00 | 1.12 | 0.24 | 5.50 | Equity | |
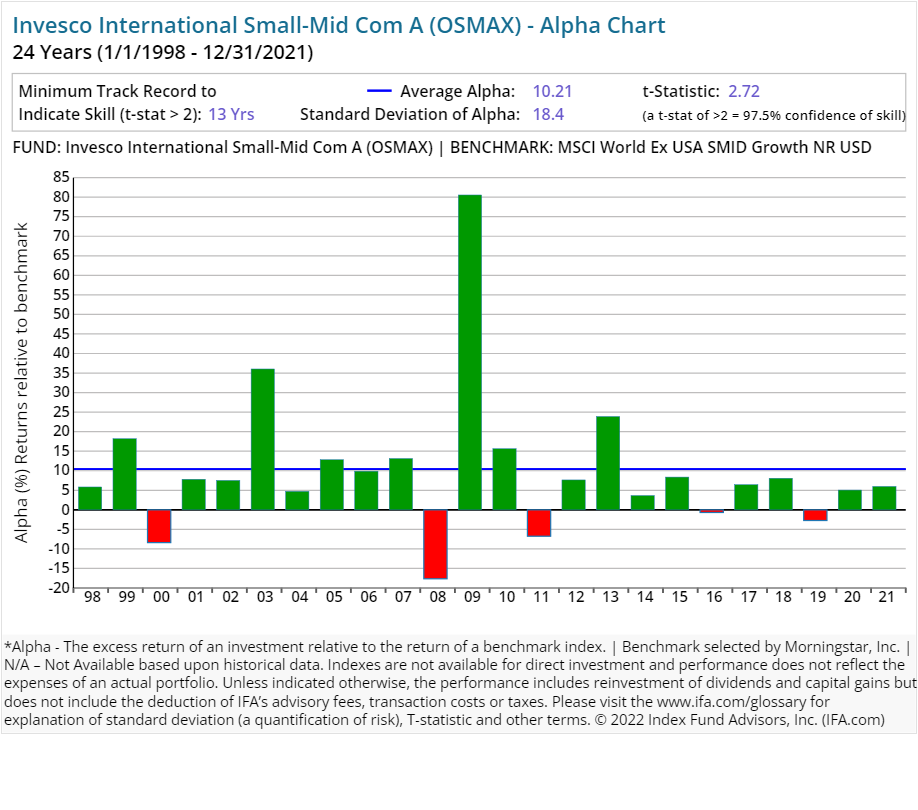
| Invesco International Small-Mid Com A | OSMAX | 21.00 | 1.35 | 0.24 | 5.50 | Equity | |
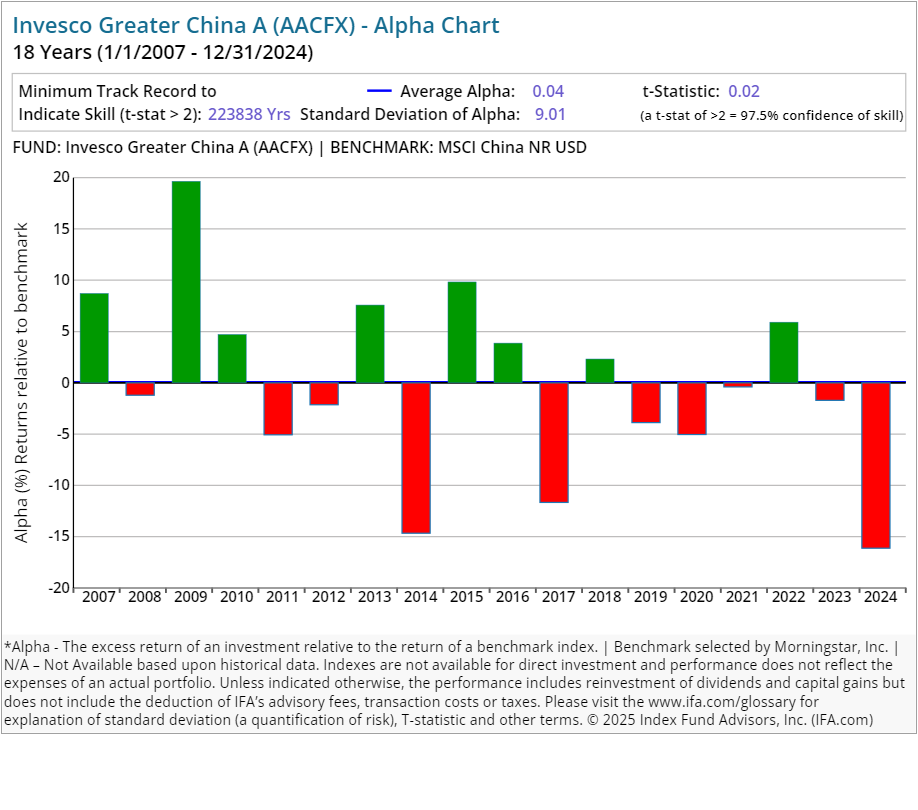
| Invesco Greater China A | AACFX | 106.00 | 1.64 | 0.25 | 5.50 | Equity | |
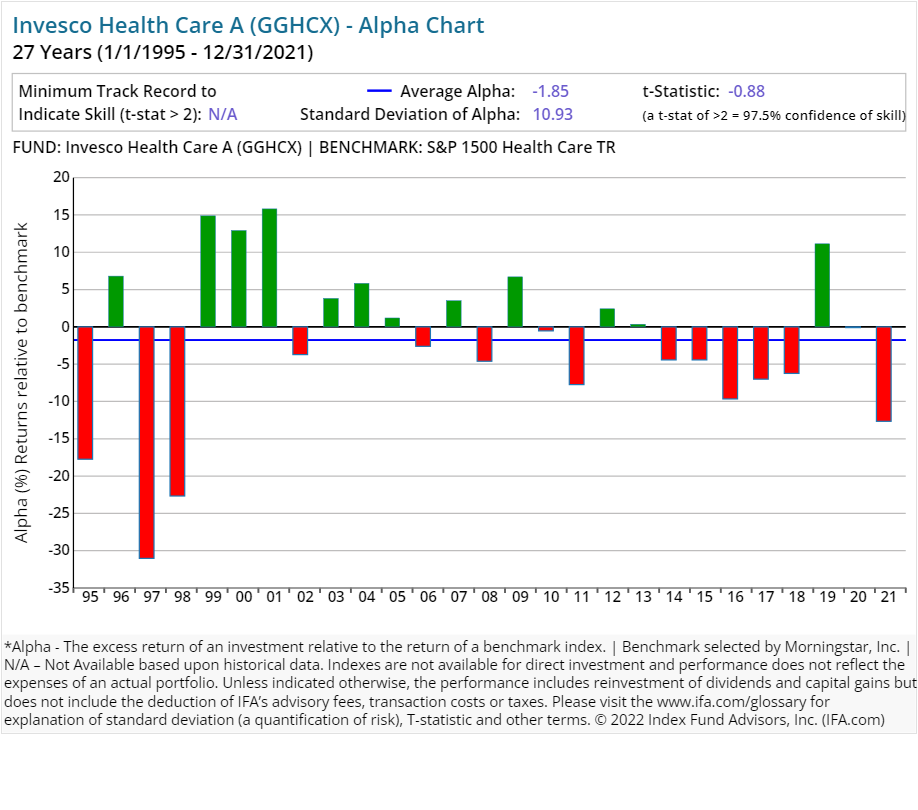
| Invesco Health Care A | GGHCX | 56.00 | 1.06 | 0.25 | 5.50 | Equity | |
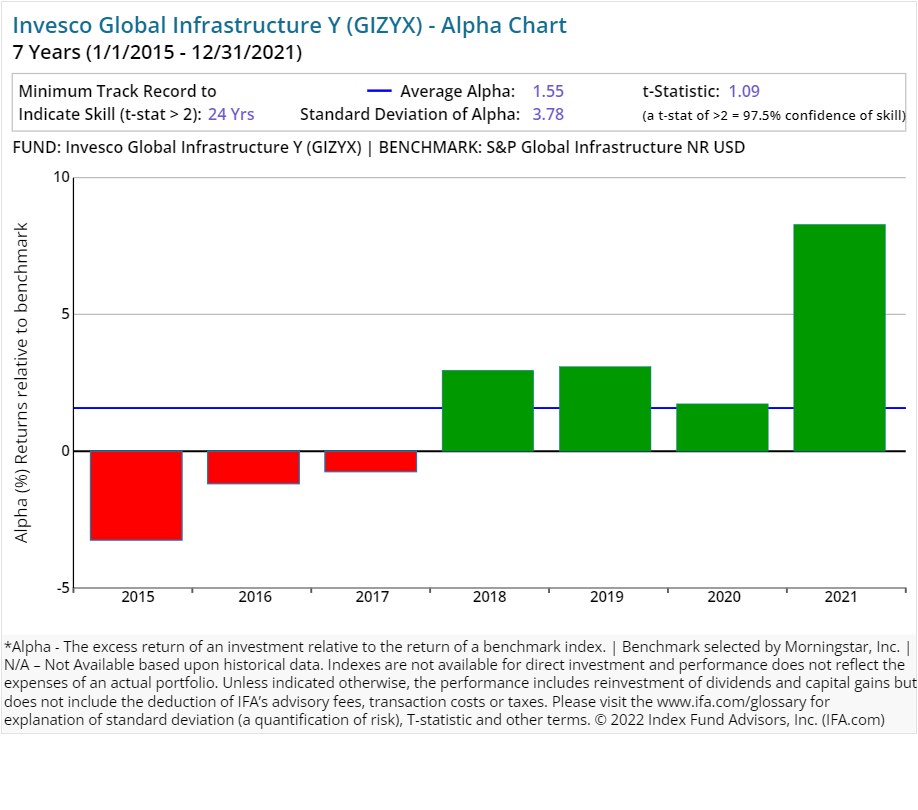
| Invesco Global Infrastructure Y | GIZYX | 193.00 | 1.00 | Equity | |||
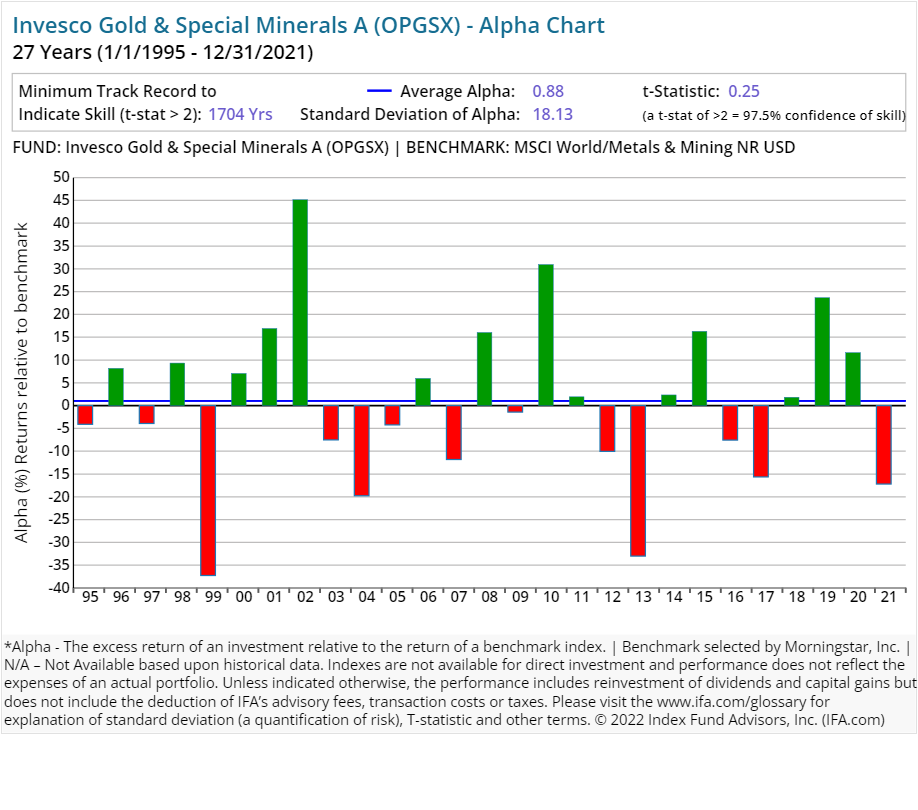
| Invesco Gold & Special Minerals A | OPGSX | 30.00 | 1.10 | 0.24 | 5.50 | Equity | |
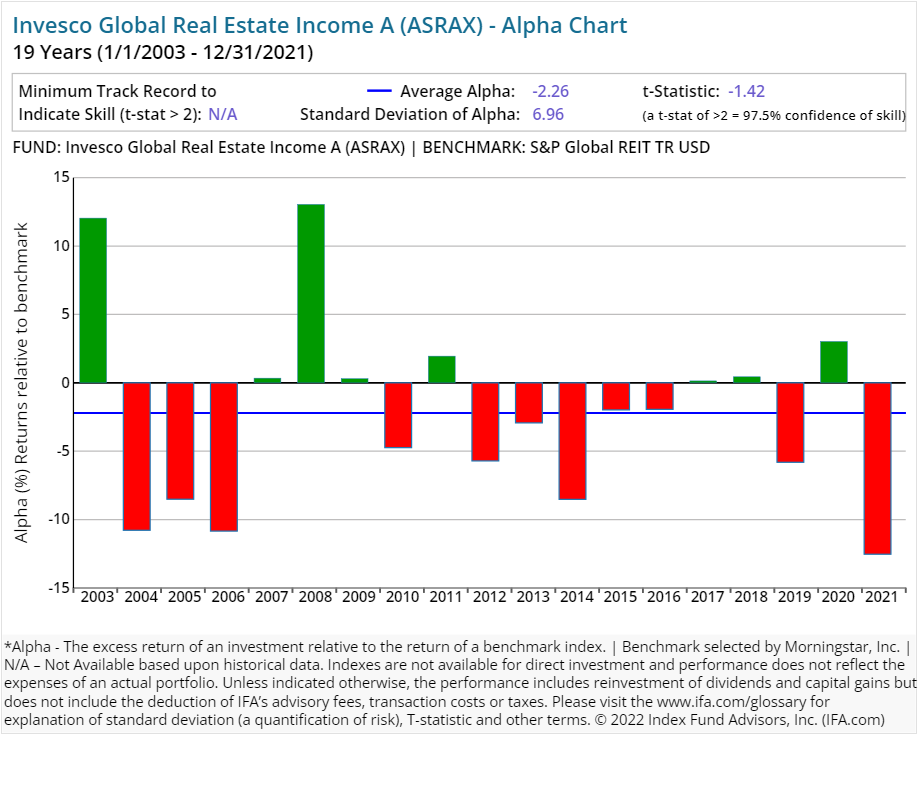
| Invesco Global Real Estate Income A | ASRAX | 49.00 | 1.26 | 0.25 | 5.50 | Equity | |
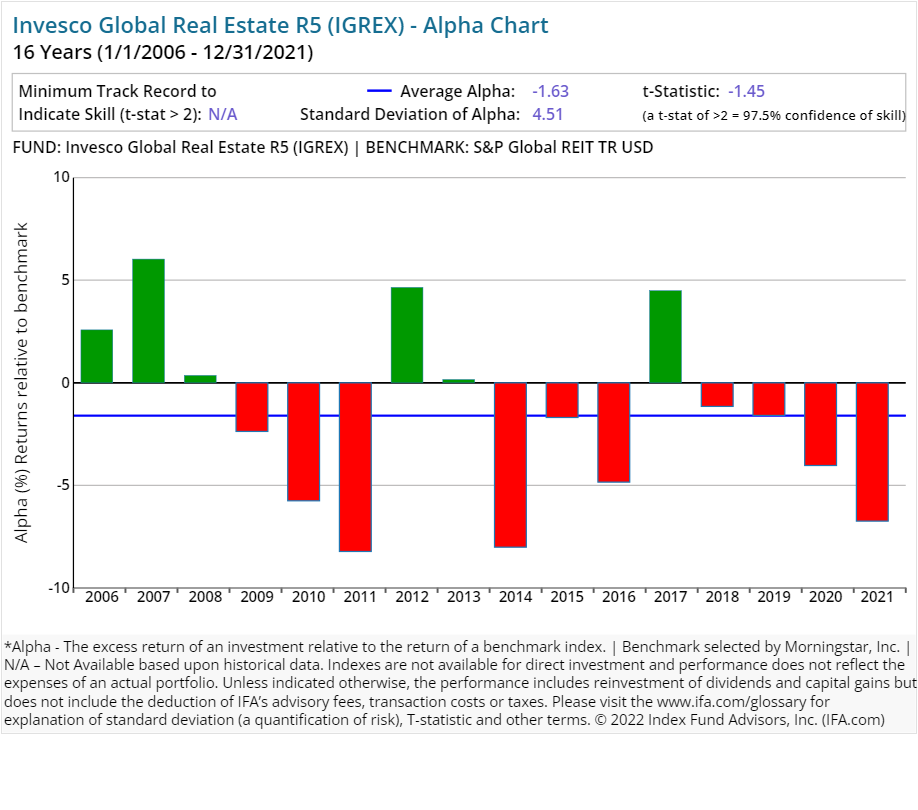
| Invesco Global Real Estate R5 | IGREX | 89.00 | 0.98 | Equity | |||
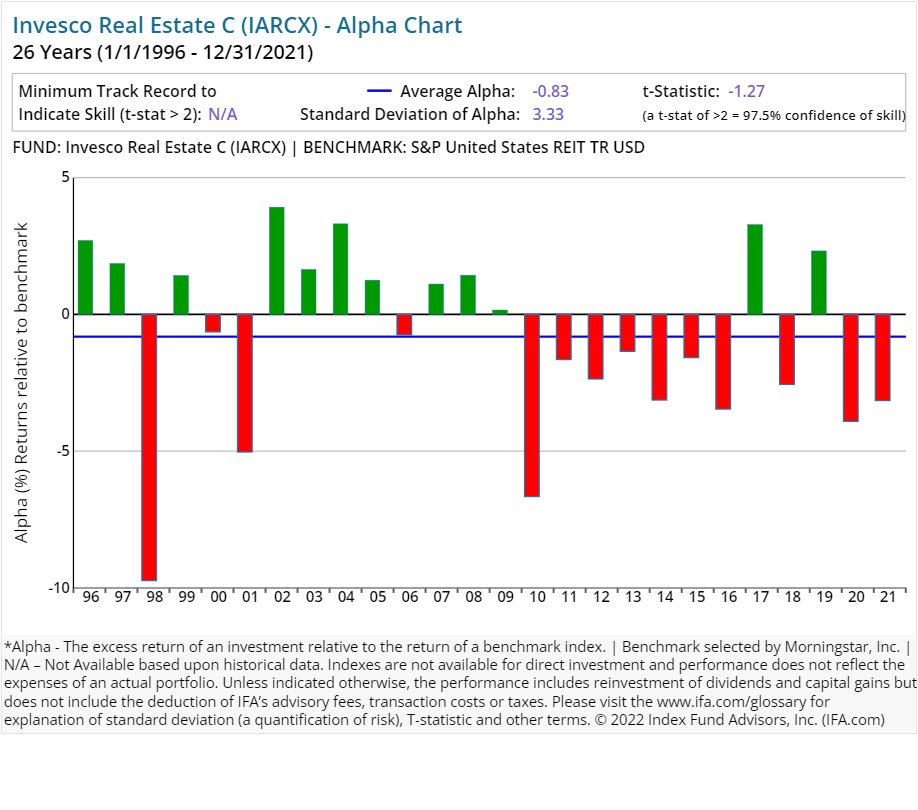
| Invesco Real Estate C | IARCX | 62.00 | 2.00 | 1.00 | 1.00 | Equity | |
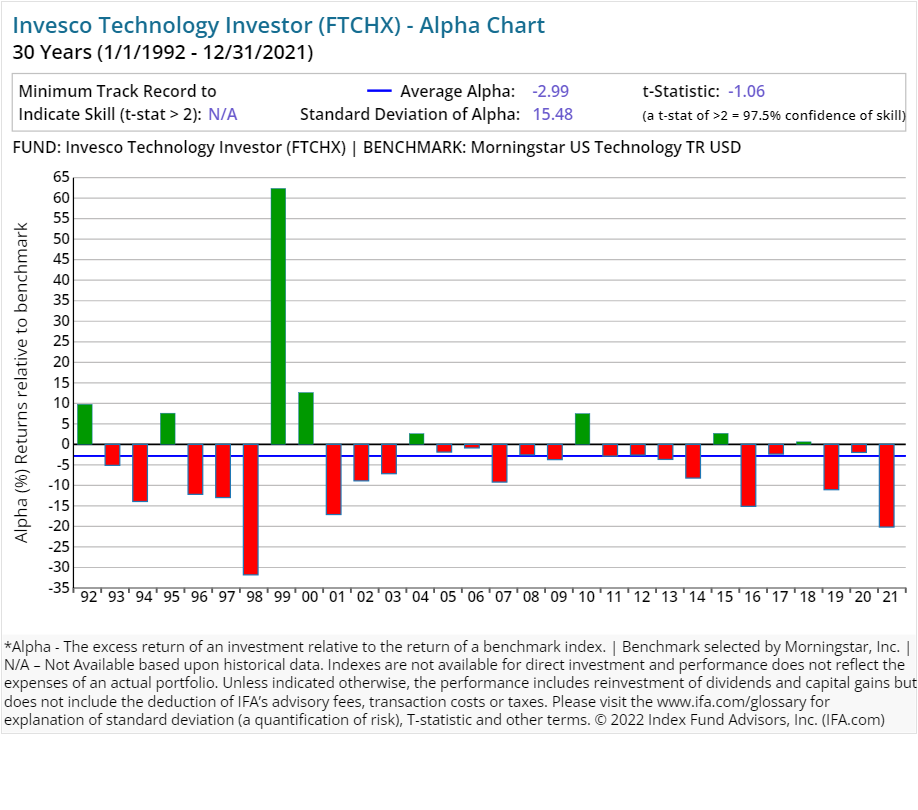
| Invesco Technology Investor | FTCHX | 95.00 | 0.96 | 0.14 | Equity | ||
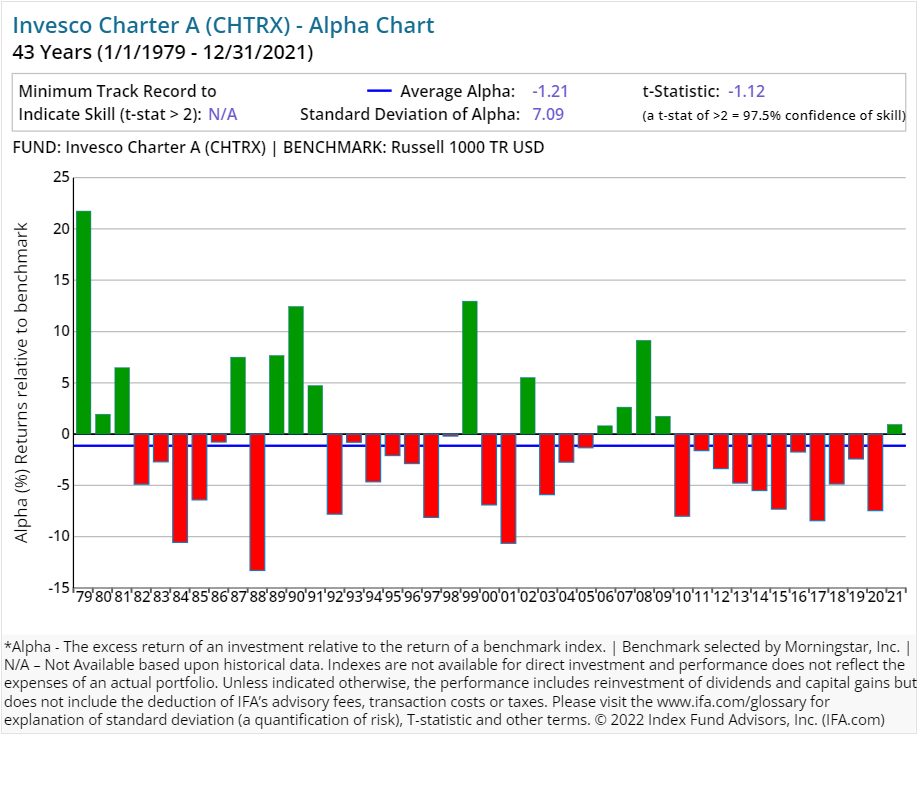
| Invesco Charter A | CHTRX | 37.00 | 1.03 | 0.25 | 5.50 | Equity | |
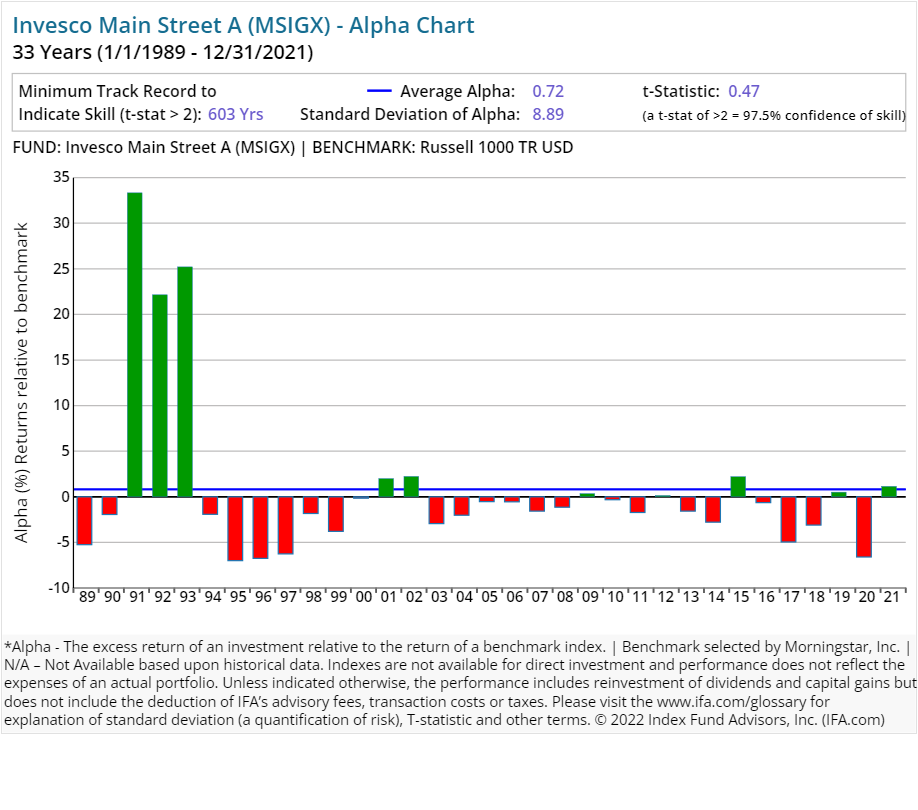
| Invesco Main Street A | MSIGX | 39.00 | 0.80 | 0.23 | 5.50 | Equity | |
| Invesco Main Street All Cap Y | OMSYX | 54.00 | 0.82 | Equity | |||
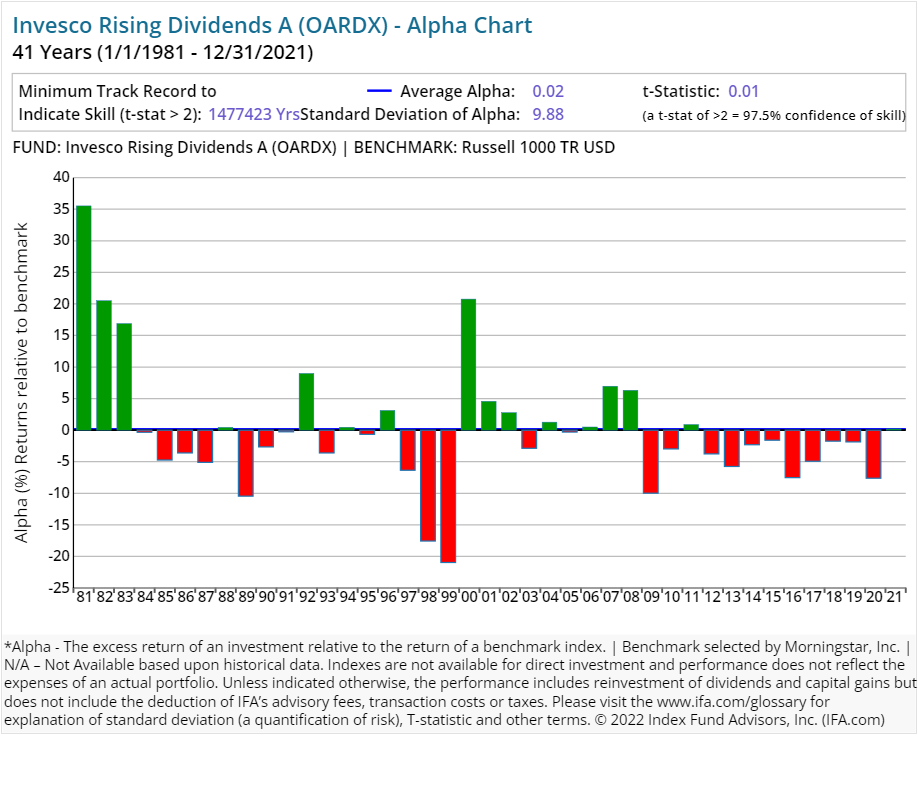
| Invesco Rising Dividends A | OARDX | 31.00 | 0.99 | 0.25 | 5.50 | Equity | |
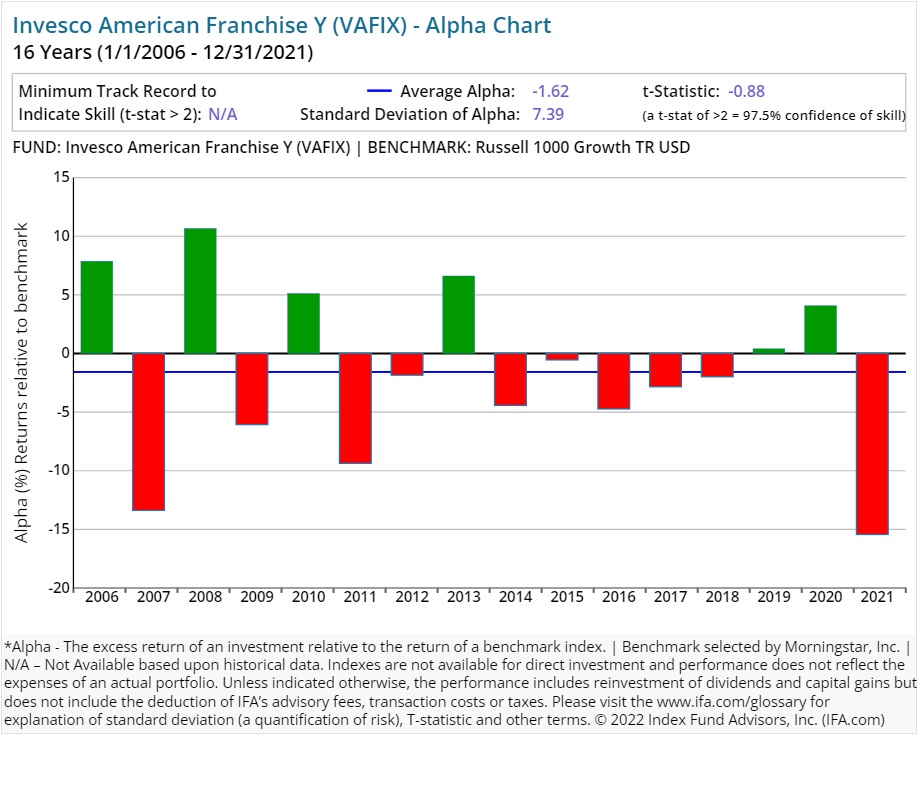
| Invesco American Franchise Y | VAFIX | 51.00 | 0.71 | Equity | |||
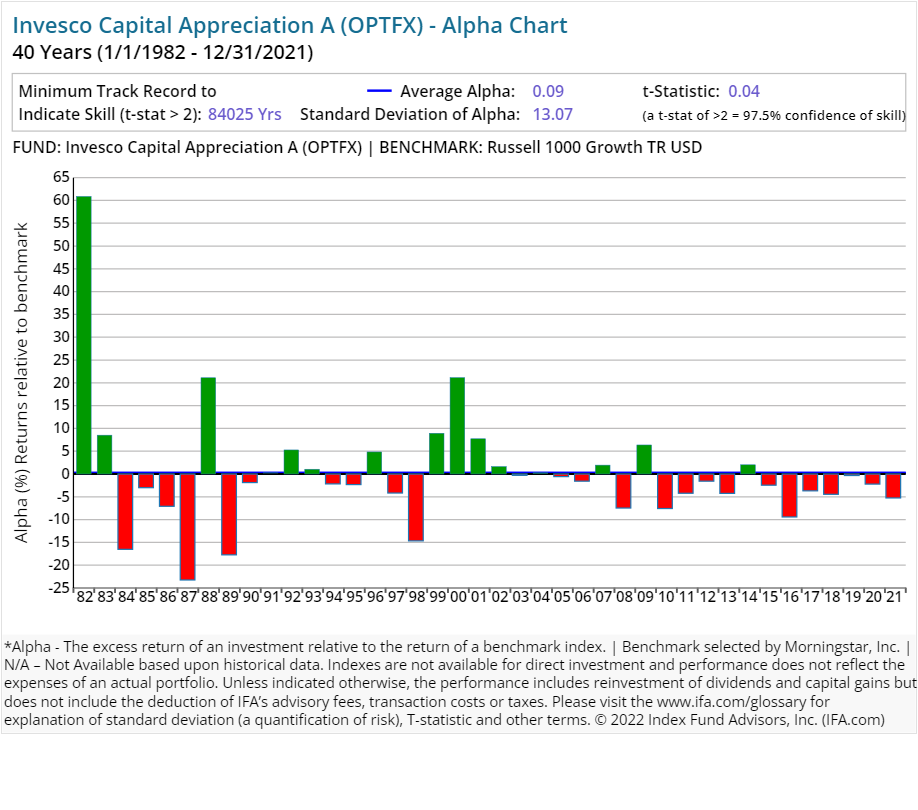
| Invesco Discovery Large Cap A | OPTFX | 55.00 | 0.94 | 0.23 | 5.50 | Equity | |
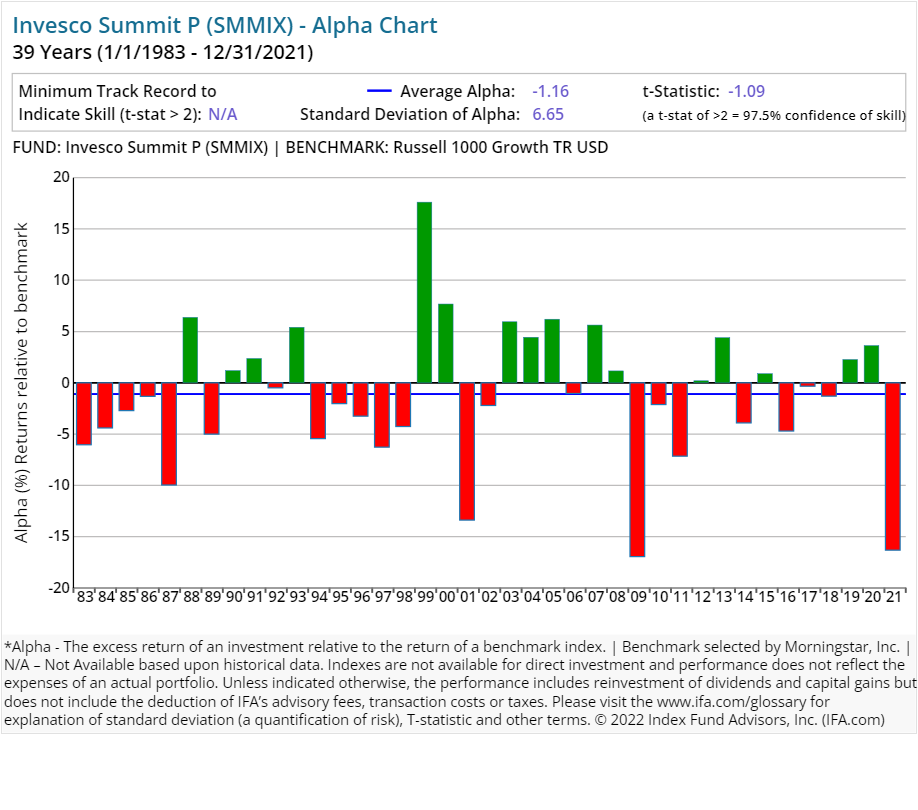
| Invesco Summit P | SMMIX | 57.00 | 0.85 | 0.10 | Equity | ||
| Invesco Comstock A | ACSTX | 18.00 | 0.81 | 0.25 | 5.50 | Equity | |
| Invesco Comstock Select A | CGRWX | 104.00 | 0.92 | 0.24 | 5.50 | Equity | |
| Invesco Diversified Dividend A | LCEAX | 47.00 | 0.82 | 0.25 | 5.50 | Equity | |
| Invesco Dividend Income Investor | FSTUX | 40.00 | 0.94 | 0.25 | Equity | ||
| Invesco Growth and Income A | ACGIX | 25.00 | 0.78 | 0.25 | 5.50 | Equity | |
| Invesco Value Opportunities A | VVOAX | 47.00 | 1.07 | 0.25 | 5.50 | Equity | |
| Invesco Discovery Mid Cap Growth Y | OEGYX | 102.00 | 0.79 | Equity | |||
| Invesco Main Street Mid Cap Y | OPMYX | 34.00 | 0.82 | Equity | |||
| Invesco Discovery A | OPOCX | 86.00 | 1.03 | 0.24 | 5.50 | Equity | |
| Invesco Main Street Small Cap R6 | OSSIX | 42.00 | 0.71 | Equity | |||
| Invesco Small Cap Equity A | SMEAX | 43.00 | 1.26 | 0.25 | 5.50 | Equity | |
| Invesco Small Cap Growth A | GTSAX | 55.00 | 1.17 | 0.25 | 5.50 | Equity | |
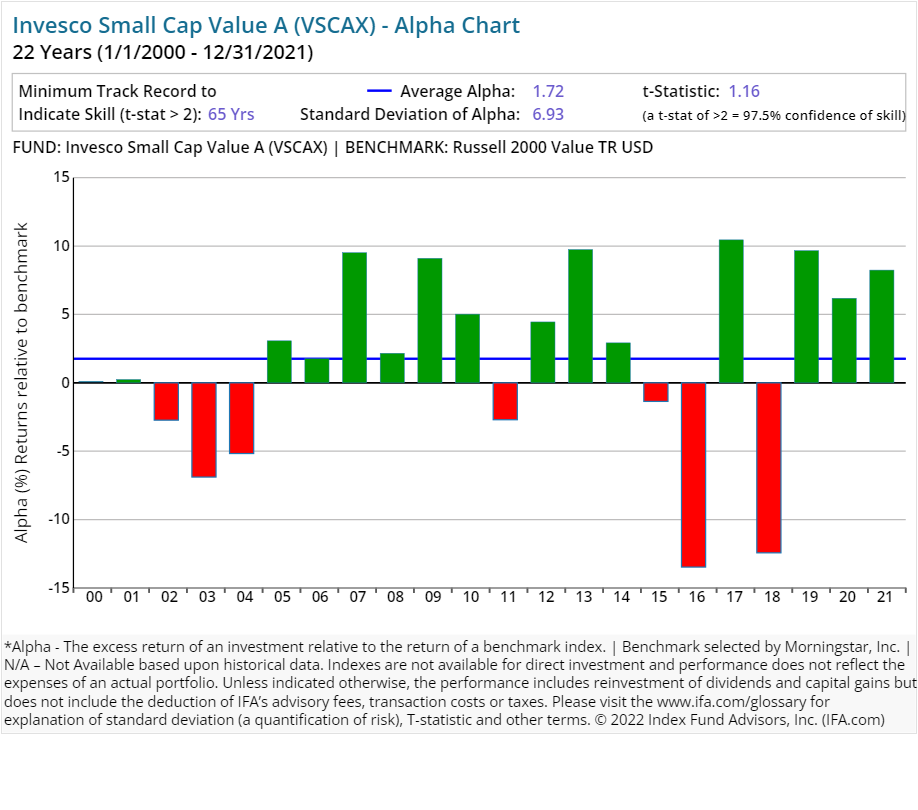
| Invesco Small Cap Value A | VSCAX | 40.00 | 1.12 | 0.25 | 5.50 | Equity | |
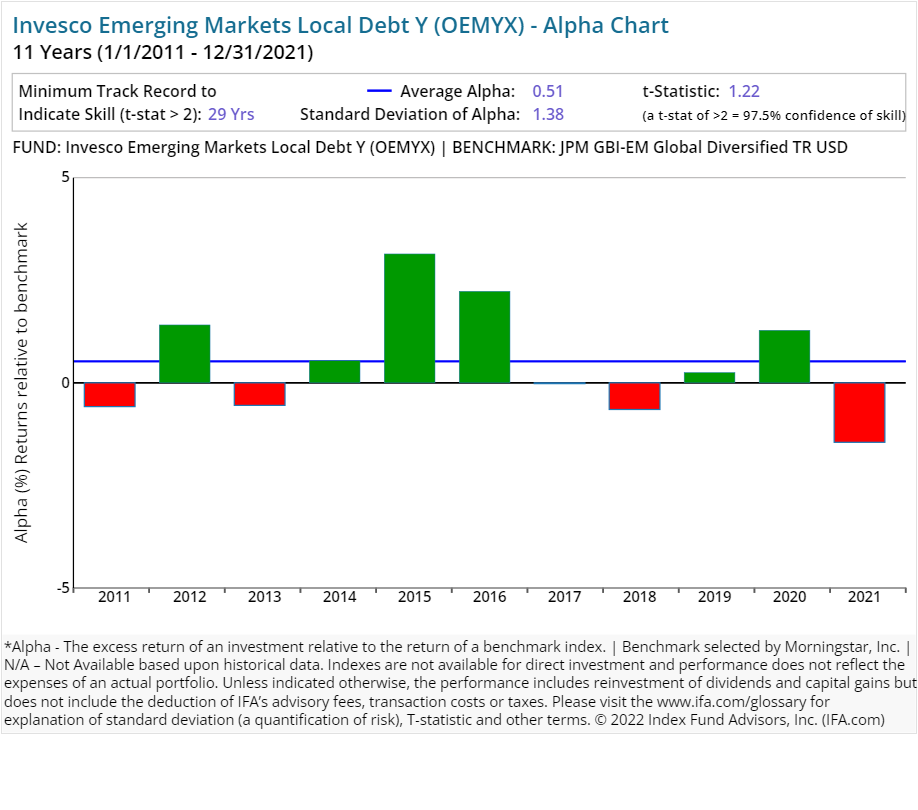
| Invesco Emerging Markets Local Debt Y | OEMYX | 99.00 | 0.99 | Fixed Income | |||
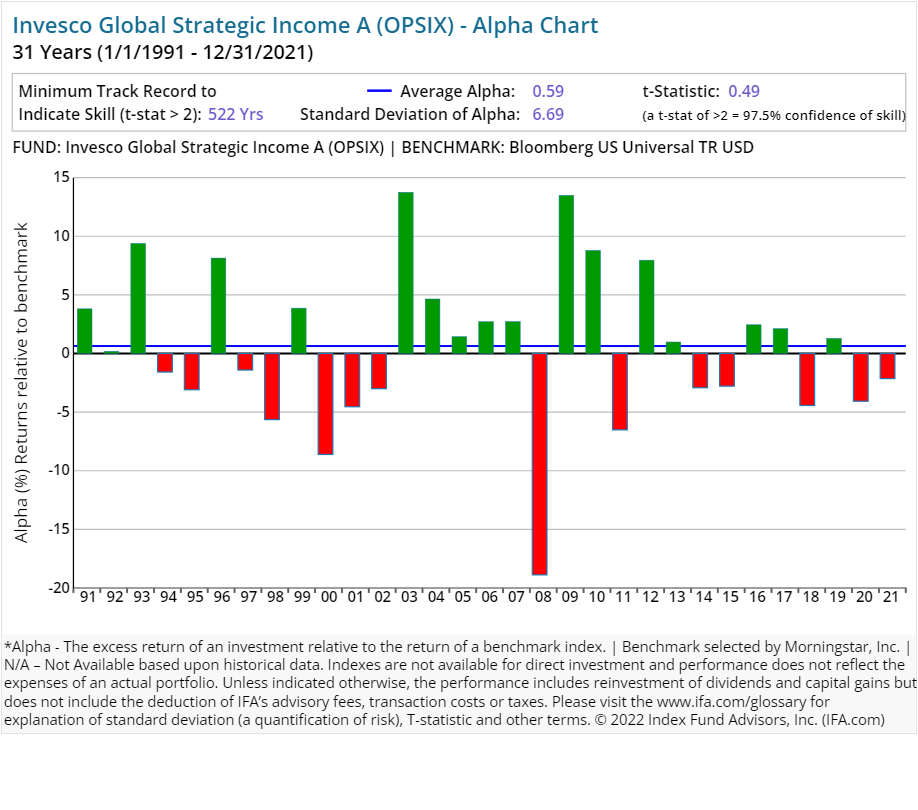
| Invesco Global Strategic Income A | OPSIX | 278.00 | 1.05 | 0.24 | 4.25 | Fixed Income | |
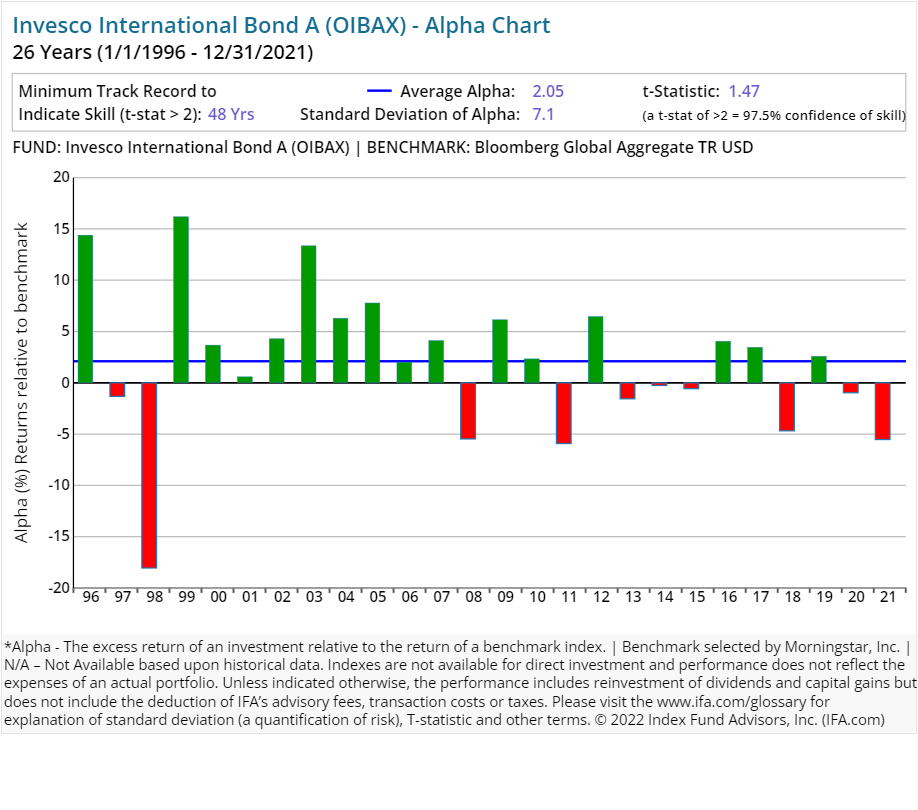
| Invesco International Bond A | OIBAX | 102.00 | 1.05 | 0.24 | 4.25 | Fixed Income | |
| Invesco Conservative Income Instl | ICIFX | 75.00 | 0.28 | Fixed Income | |||
| Invesco Core Bond A | OPIGX | 565.00 | 0.71 | 0.25 | 4.25 | Fixed Income | |
| Invesco Core Plus Bond Y | CPBYX | 465.00 | 0.51 | Fixed Income | |||
| Invesco Corporate Bond A | ACCBX | 195.00 | 0.75 | 0.25 | 4.25 | Fixed Income | |
| Invesco Floating Rate ESG A | AFRAX | 46.00 | 1.09 | 0.25 | 2.50 | Fixed Income | |
| Invesco High Yield A | AMHYX | 148.00 | 1.05 | 0.25 | 4.25 | Fixed Income | |
| Invesco Income A | AGOVX | 268.00 | 1.00 | 0.25 | 4.25 | Fixed Income | |
| Invesco Intermediate Bond Factor Y | OFIYX | 276.00 | 0.28 | Fixed Income | |||
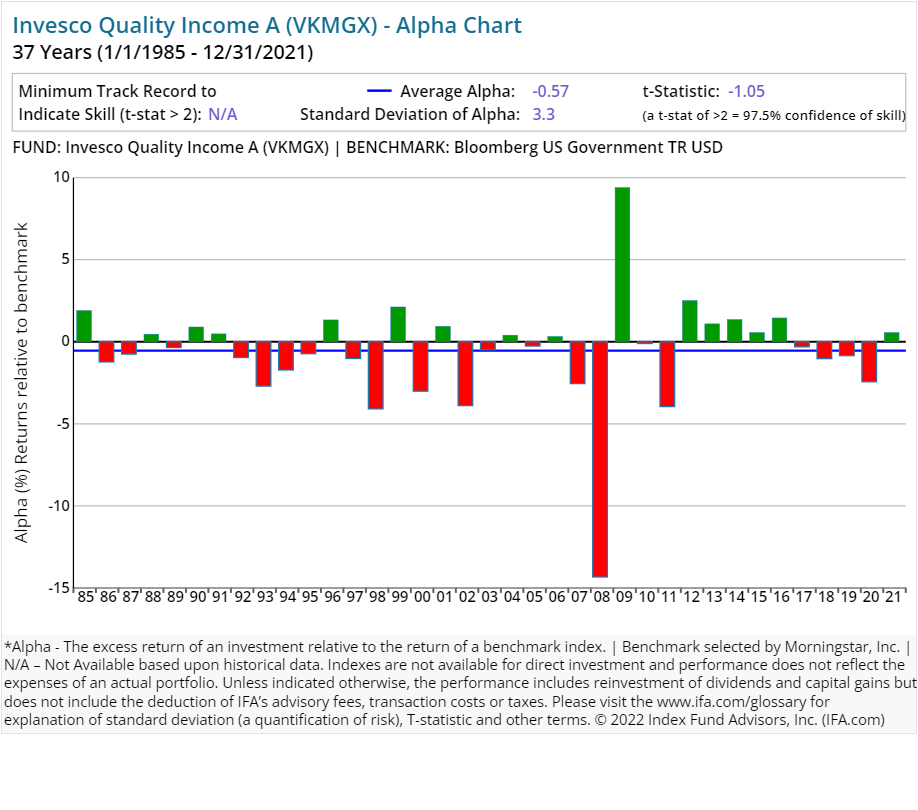
| Invesco Quality Income A | VKMGX | 427.00 | 0.86 | 0.24 | 4.25 | Fixed Income | |
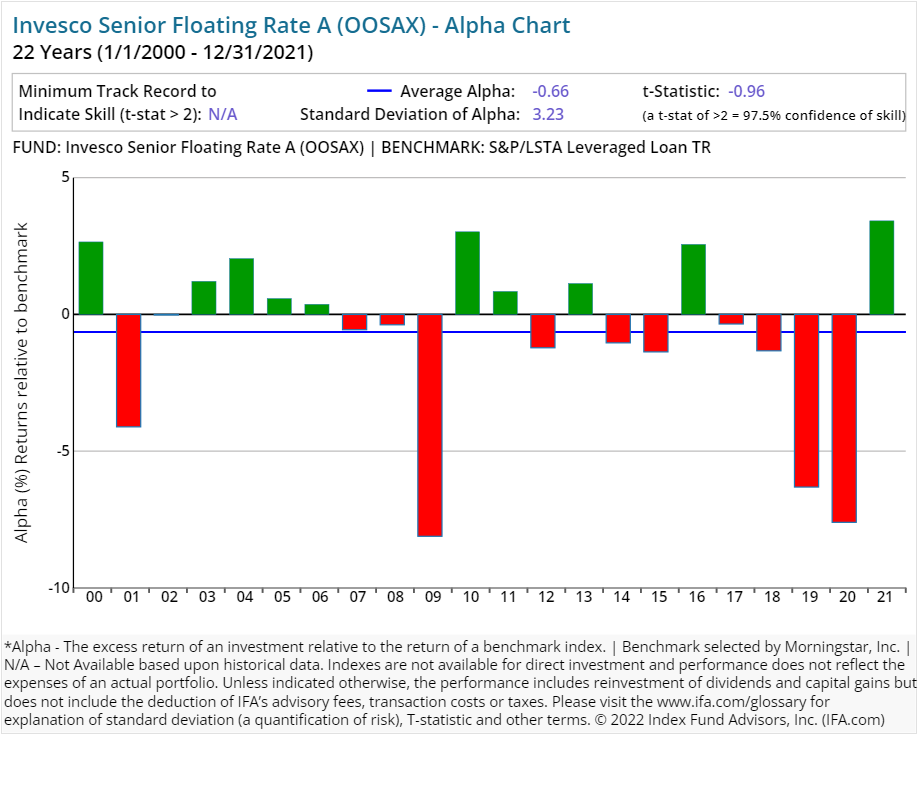
| Invesco Senior Floating Rate A | OOSAX | 48.00 | 1.09 | 0.25 | 3.25 | Fixed Income | |
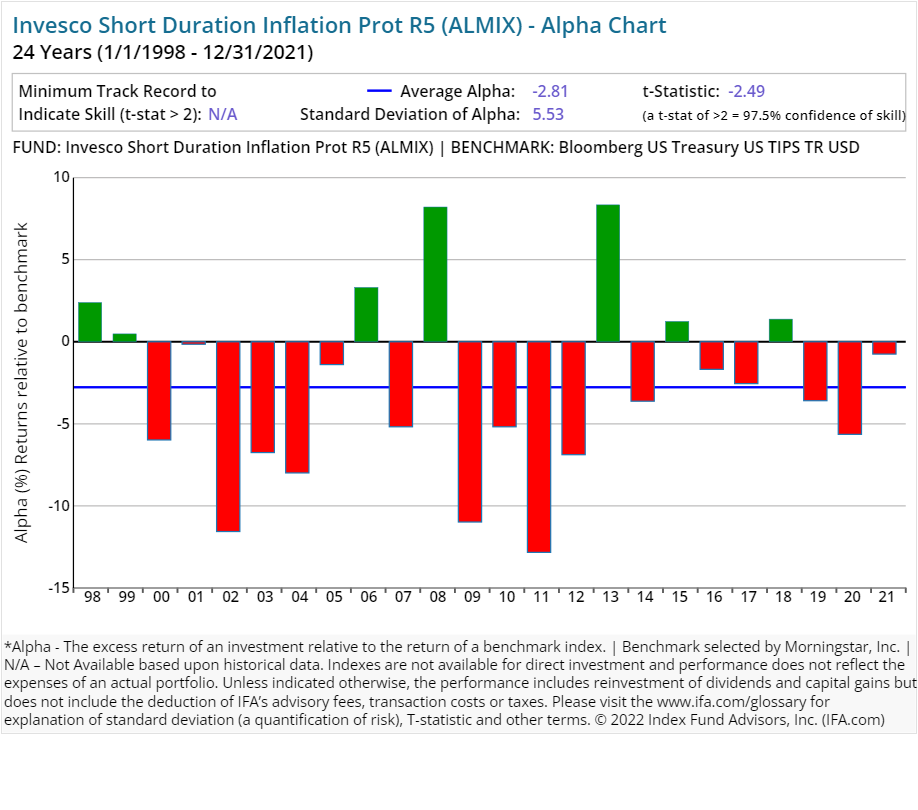
| Invesco Short Duration Inflation Prot R5 | ALMIX | 36.00 | 0.30 | Fixed Income | |||
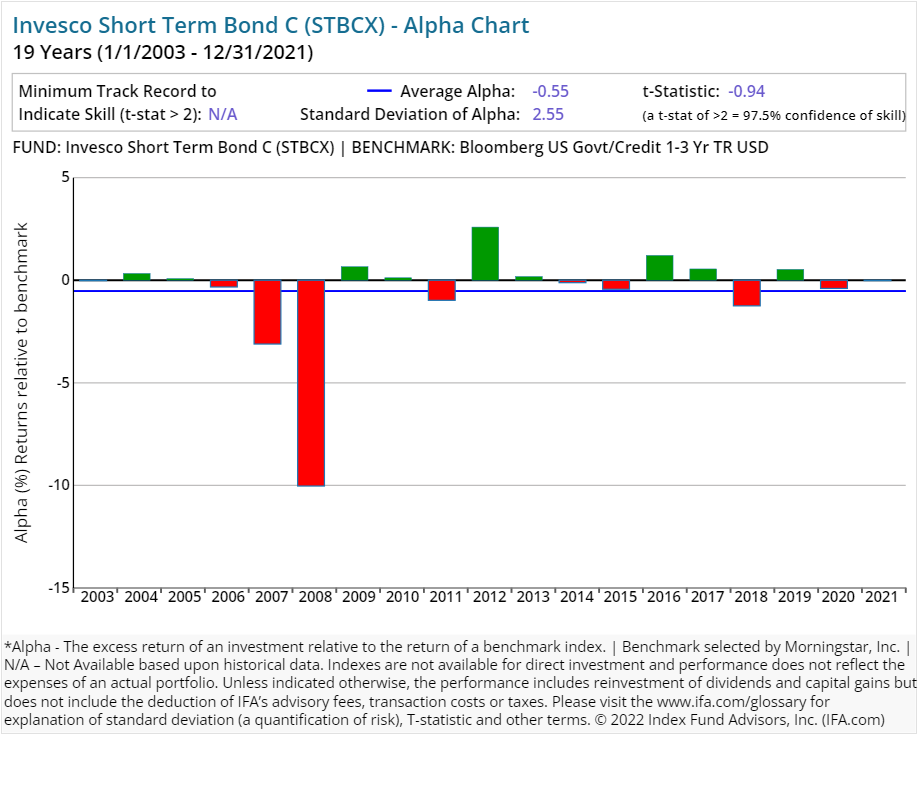
| Invesco Short Term Bond C | STBCX | 169.00 | 1.00 | 0.65 | 0.50 | Fixed Income | |
| Invesco AMT-Free Municipal Inc A | OPTAX | 21.00 | 0.93 | 0.24 | 4.25 | Fixed Income | |
| Invesco California Municipal A | OPCAX | 20.00 | 1.18 | 0.25 | 4.25 | Fixed Income | |
| Invesco Environmental Focus Muni A | OPAMX | 21.00 | 0.87 | 0.25 | 4.25 | Fixed Income | |
| Invesco High Yield Municipal A | ACTHX | 25.00 | 1.54 | 0.25 | 4.25 | Fixed Income | |
| Invesco Intermediate Term Muni Inc A | VKLMX | 23.00 | 0.85 | 0.25 | 2.50 | Fixed Income | |
| Invesco Limited Term CA Municipal A | OLCAX | 26.00 | 0.93 | 0.25 | 2.50 | Fixed Income | |
| Invesco Limited Term Municipal Income A2 | AITFX | 60.00 | 0.34 | 1.00 | Fixed Income | ||
| Invesco Municipal Income A | VKMMX | 17.00 | 1.04 | 0.25 | 4.25 | Fixed Income | |
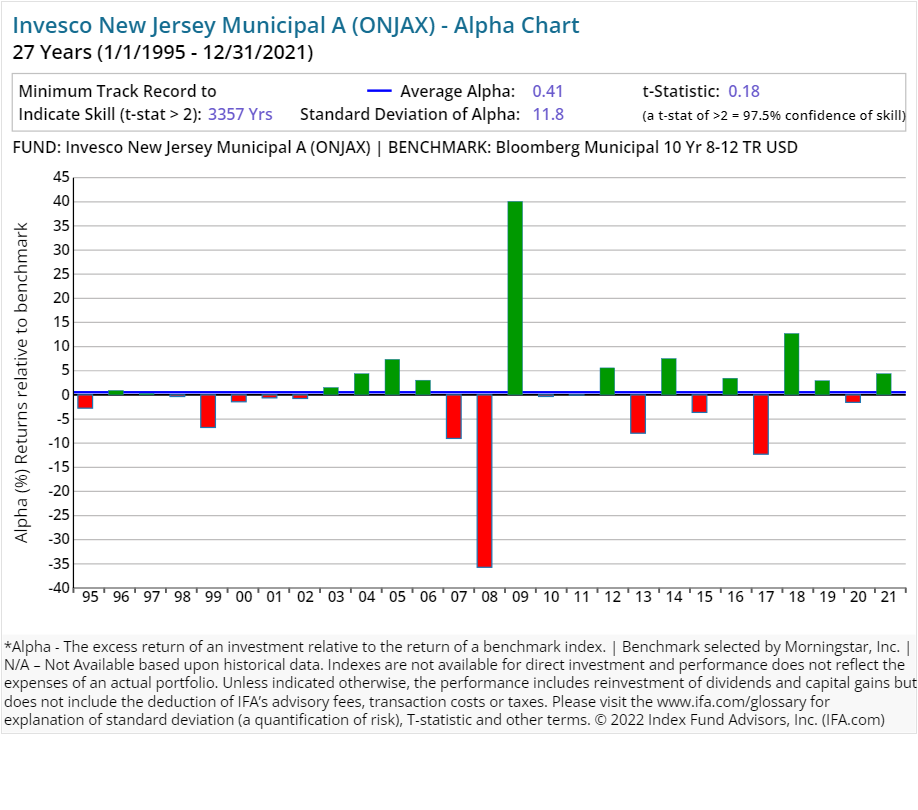
| Invesco New Jersey Municipal A | ONJAX | 25.00 | 1.09 | 0.25 | 4.25 | Fixed Income | |
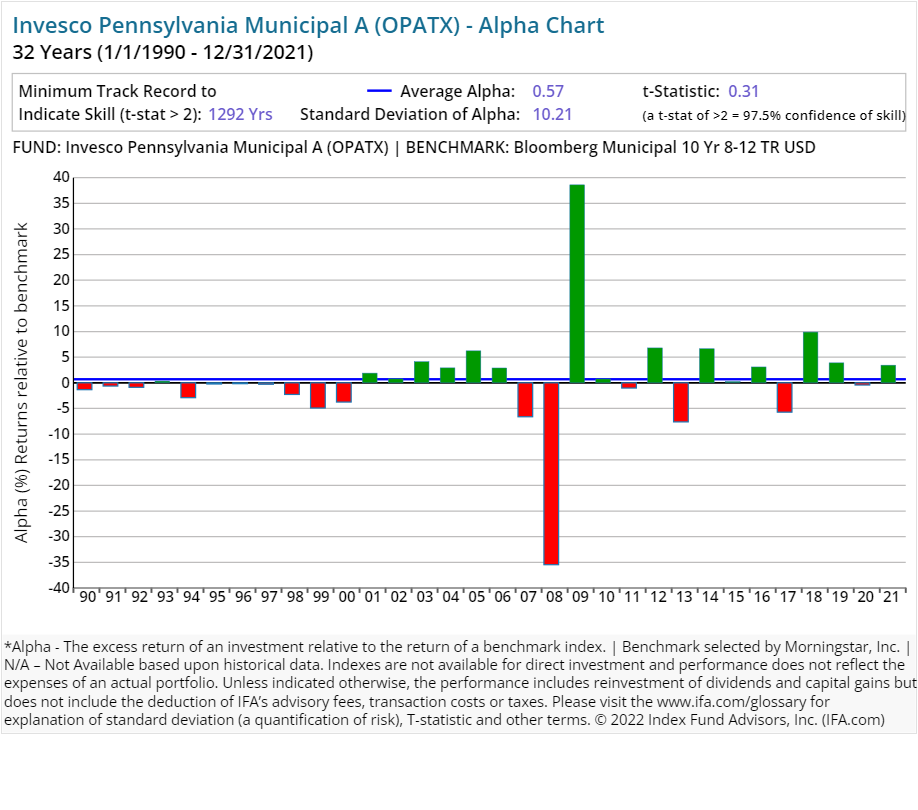
| Invesco Pennsylvania Municipal A | OPATX | 11.00 | 0.95 | 0.25 | 4.25 | Fixed Income | |
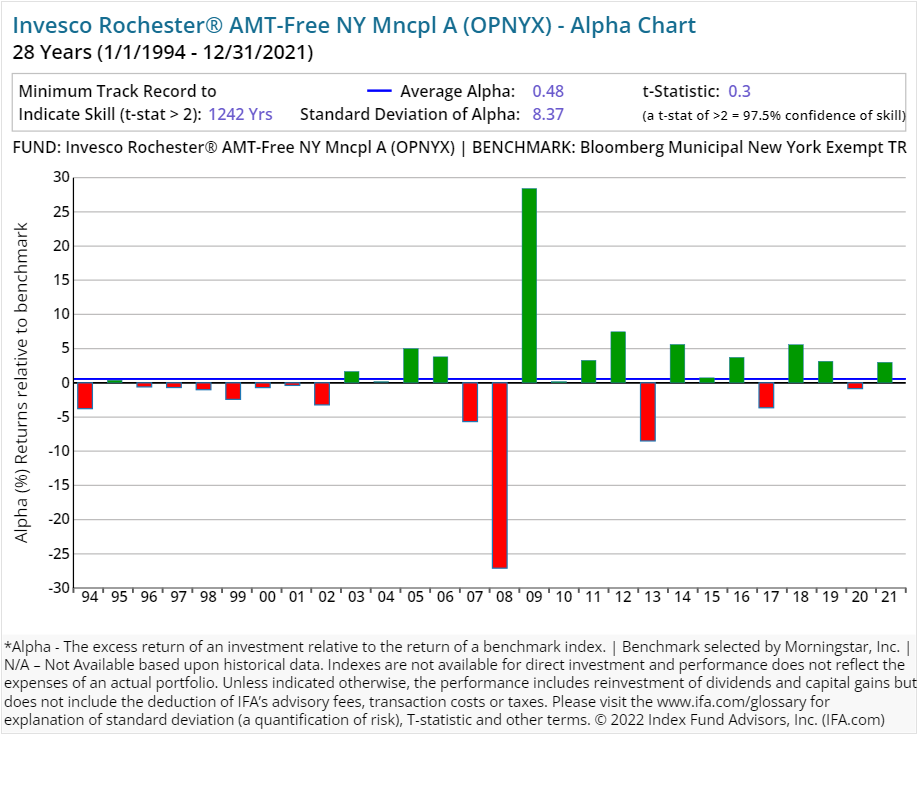
| Invesco Rochester® AMT-Free NY Mncpl A | OPNYX | 24.00 | 1.35 | 0.24 | 4.25 | Fixed Income | |
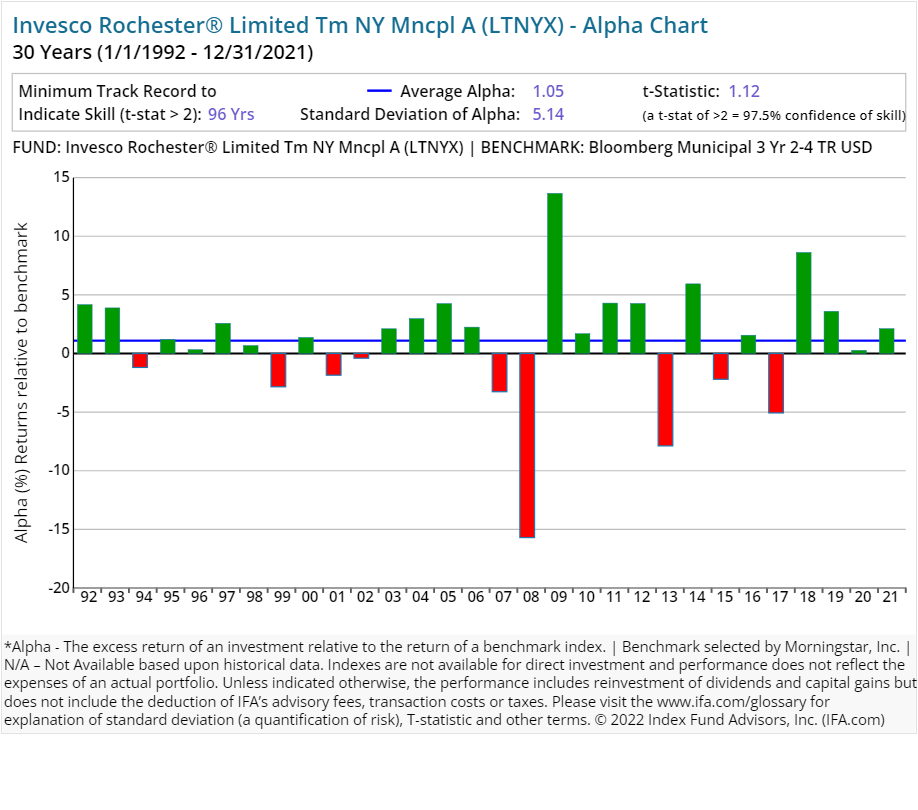
| Invesco Rochester® Limited Tm NY Mncpl A | LTNYX | 21.00 | 0.90 | 0.25 | 2.50 | Fixed Income | |
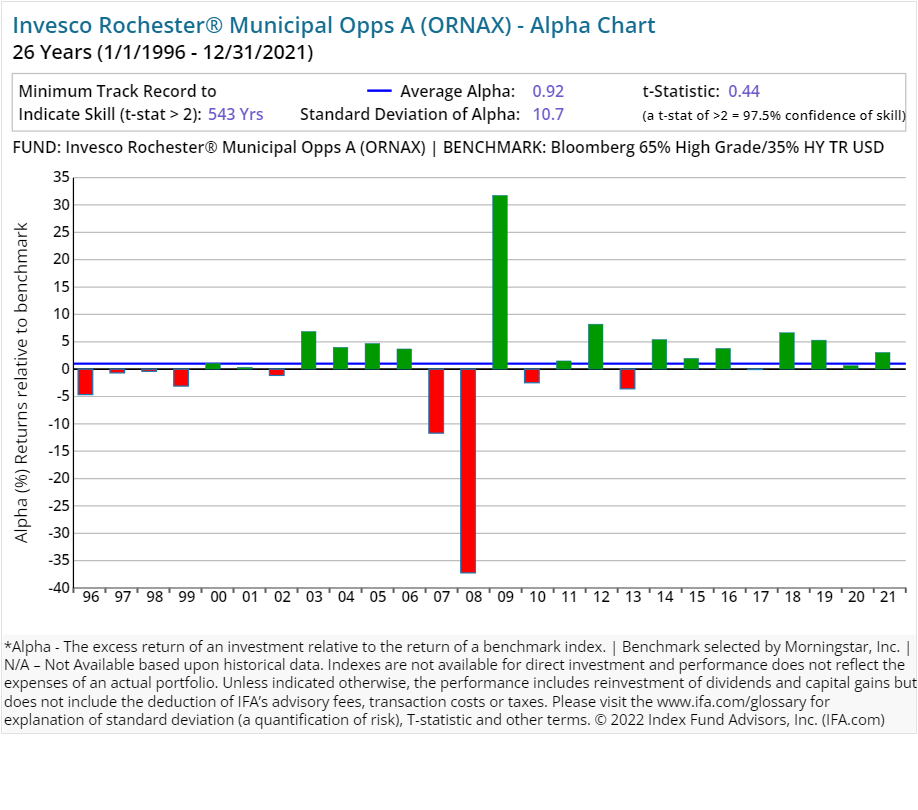
| Invesco Rochester® Municipal Opps A | ORNAX | 25.00 | 1.44 | 0.25 | 4.25 | Fixed Income | |
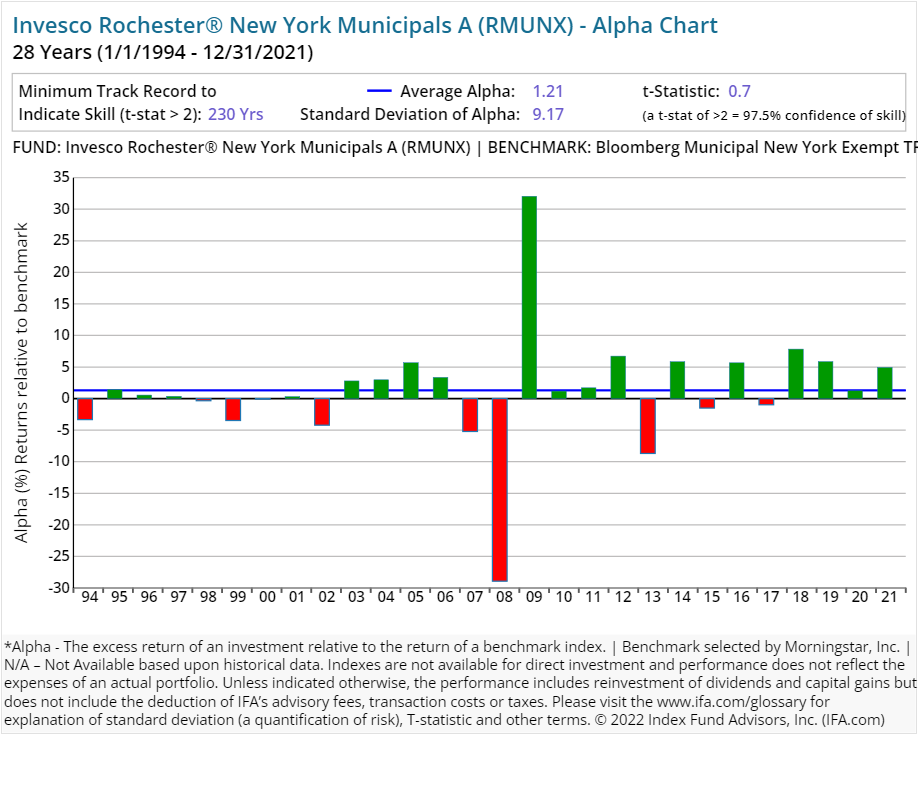
| Invesco Rochester® New York Municipals A | RMUNX | 27.00 | 1.27 | 0.24 | 4.25 | Fixed Income | |
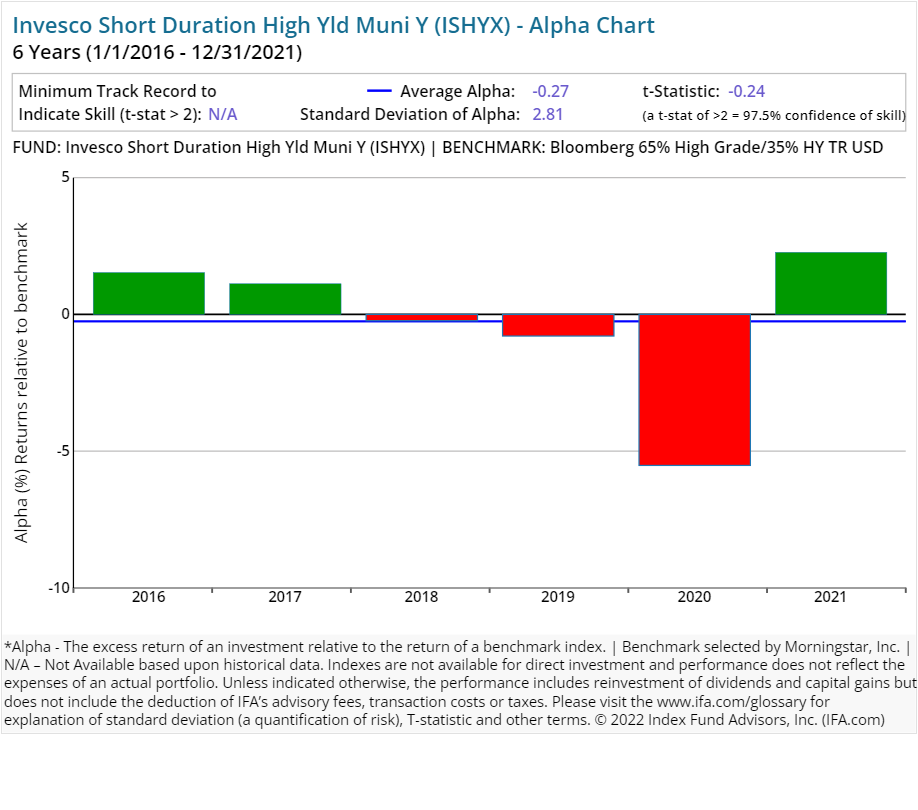
| Invesco Short Duration High Yld Muni Y | ISHYX | 29.00 | 0.64 | Fixed Income | |||
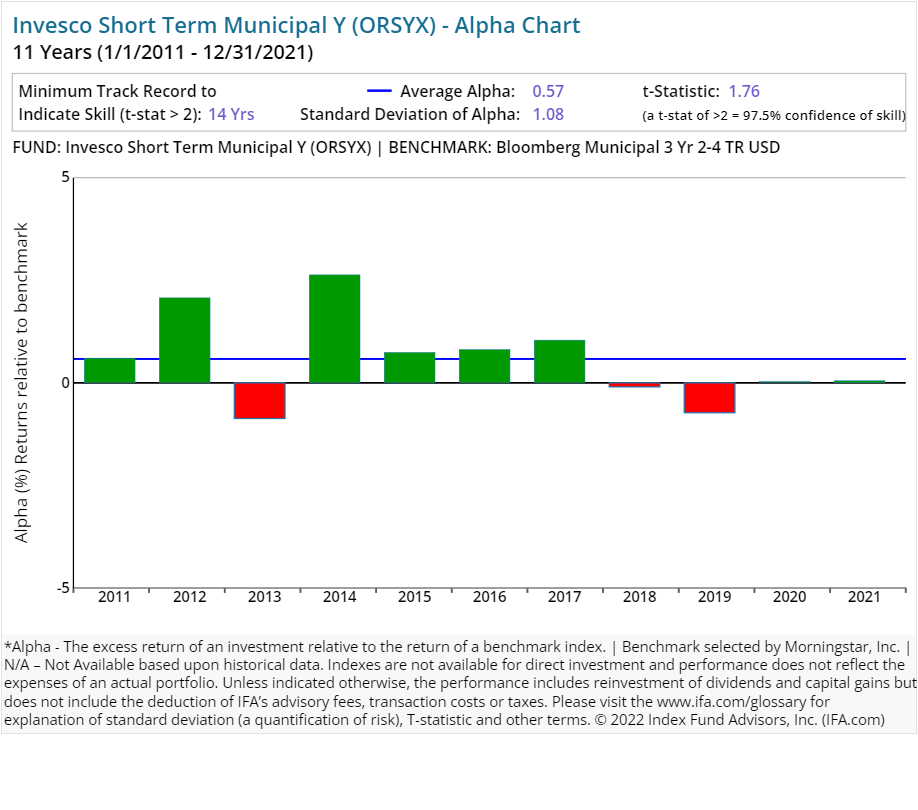
| Invesco Short Term Municipal Y | ORSYX | 91.00 | 0.52 | Fixed Income |
On average, an investor who utilized a surviving active equity mutual fund strategy from Invesco experienced an expense ratio of 1.47% per year. Similarly, an investor who utilized a bond strategy from Invesco on average paid an expense ratio of 0.89% a year.
These expenses can have a substantial impact on an investor's overall accumulated wealth if they are not backed by superior performance. The average turnover ratios for equity and bond strategies from Invesco were 50% and 118%, respectively. This implies an average holding period of 10 to 24 months.
In contrast, most index funds have very long holding periods — decades, in fact, thus deafening themselves to the random noise that accompanies short-term market movements. Again, turnover is a cost that is not itemized to the investor but is definitely embedded in the overall performance.
Performance Analysis
The next question we address is whether investors can expect superior performance in exchange for the higher costs associated with Invesco's implementation of active management. We compare each of its 320 strategies with five or more years against its Morningstar-assigned benchmark to see just how well each has delivered on its perceived value proposition. We also use the oldest share class of each fund, which sometimes are older than its assigned benchmark. In those cases, comparisons can only be made for the length of time that the benchmark has data available.
This analysis includes the performance of both surviving and non-surviving funds to account for survivorship bias. Non-surviving funds, such as those that were closed, merged, or liquidated, are included in the aggregate performance calculations based on their historical returns up to the date they ceased to exist. This approach ensures a more comprehensive and accurate representation of overall performance but may not fully reflect the experience of individual investors due to timing and other factors.
We have included alpha charts for each of their current strategies at the bottom of this article. Here is what we found:
-
84.69% (271 of 320 funds) have underperformed (or didn't survive) their respective benchmarks since inception.
-
15.31% (49 of 320 funds) have outperformed (and survived) their respective benchmarks since inception, having delivered a positive alpha.
Here's the real kicker, however:
- 1.88% (6 of 320 funds) wound up outperforming their respective benchmarks consistently enough since inception to provide 97.5% confidence that such outperformance could persist (as opposed to being based simply on random outcomes).
So, relatively few — less than 2% — of Invesco's active mutual fund managers were able to deliver statistically significant benchmark outperformance. The inclusion of the statistical significance of alpha is key to this exercise, as it indicates which outcomes are due to a skill that is likely to repeat and those that are more likely due to a random outcome.
As a result, this study shows that a majority of funds offered by Invesco have not outperformed Morningstar-assigned benchmarks.
Regression Analysis
How we define or choose a benchmark is extremely important. If we relied solely on commercial indexes assigned by Morningstar, then we may form a false conclusion that Invesco has the "secret sauce" as active managers.
Since Morningstar is limited in terms of trying to fit the best commercial benchmark with each fund in existence, there is of course going to be some error in terms of matching up proper characteristics such as average market capitalization or average price-to-earnings ratio.
A better way of controlling these possible discrepancies is to run multiple regressions where we account for the known factors (betas) of expected return in the U.S. (i.e., market, size, relative price, etc.).
For example, if we were to look at all of the U.S.-based equity strategies offered as a part of the Invesco mutual funds family that've been around for at least the past 10 years, we could run multiple regressions to see what each fund's alpha looks like — once we control for the multiple betas that are being systematically priced into the overall market.
Besides using common mathematical concepts of regression analysis, our methodology for this study incorporates a standard point of demarcation for determining the number of years reviewed. Given that many active families have few survivors with records spanning a decade or more, we use this number (10) as a basic threshold for comparing active managers as part of our ongoing Deeper Look series. The chart below displays the average alpha and standard deviation of that alpha for the past 10 years through 2024. Screening criteria include funds with holdings of 90% or greater in U.S. equities and uses the oldest available share classes.
As shown above, two of the mutual funds studied had positive excess returns over the stated benchmarks. At the same time, no equity funds produced a statistically significant level of alpha, based on a t-stat of 2.0 or greater. Why is this important? Given the lower costs associated with index funds, we'd have greater confidence of experiencing a more desirable result using a passively managed portfolio of funds compared to one constructed around more expensive actively managed funds. (A review of how to calculate a fund's t-stat can be found at the end — right after the presentations of the individual alpha charts for each Invesco fund included in this study.)
Conclusion
Like many of the other largest financial institutions, a deep analysis into the performance of Invesco has yielded a not so surprising result: active management is has historically struggled to outperform their benchmarks on a consistent basis, particularly after fees and expenses. We believe this is due to market efficiency, costs and increased competition in the financial services sector.
As we always like to remind investors, a more reliable investment strategy for capturing the returns of global markets is to buy, hold and rebalance a globally diversified portfolio of index funds.
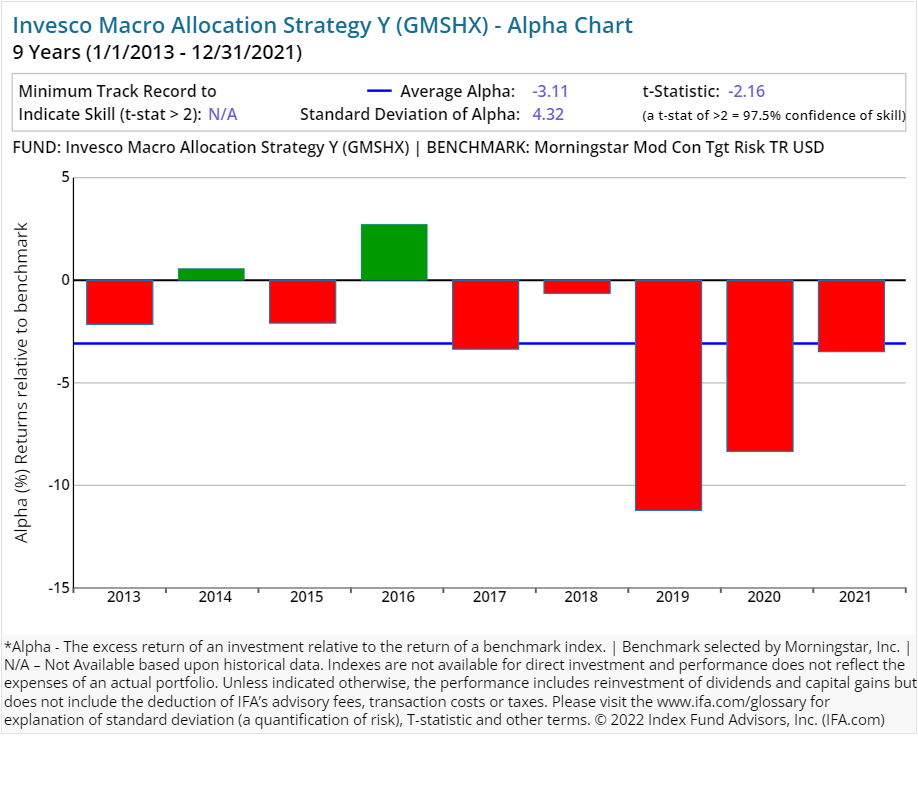
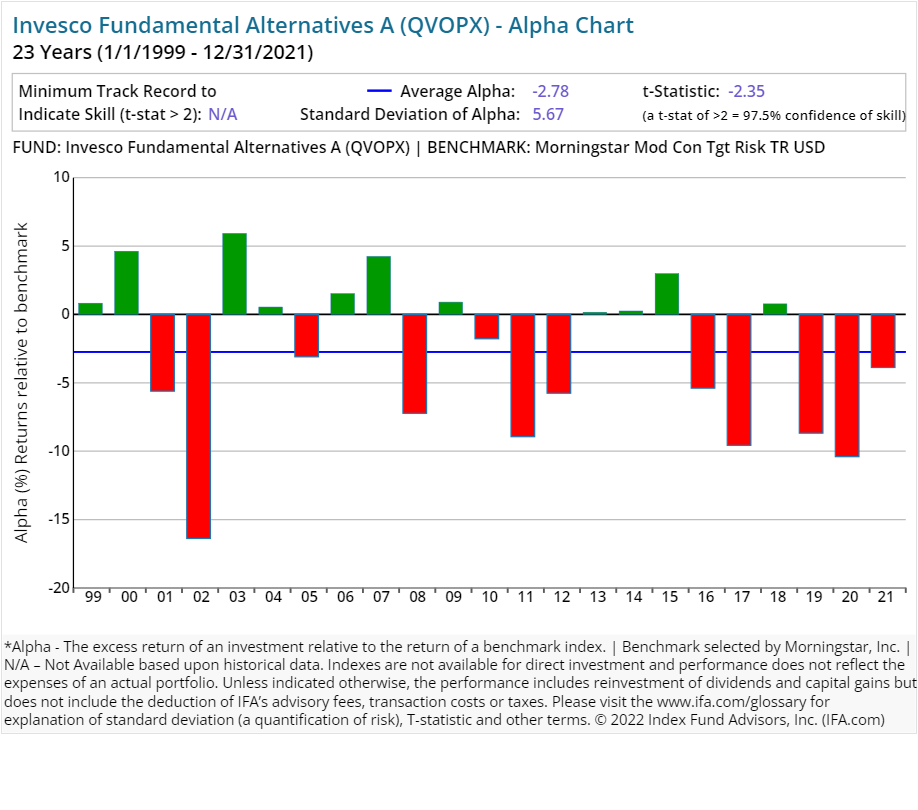
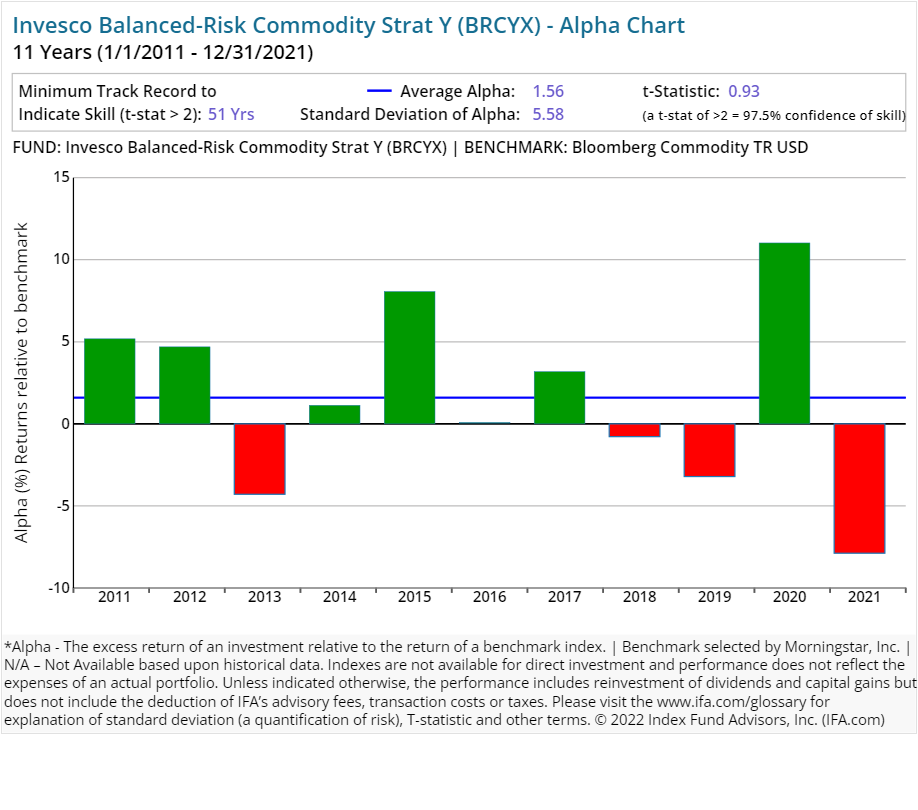
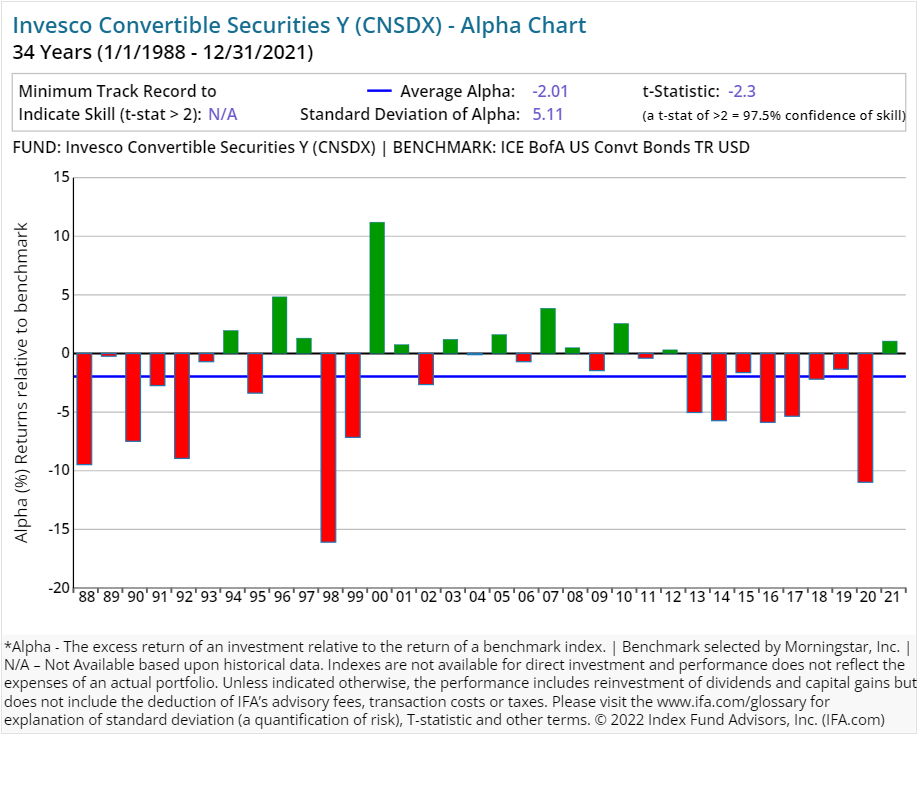
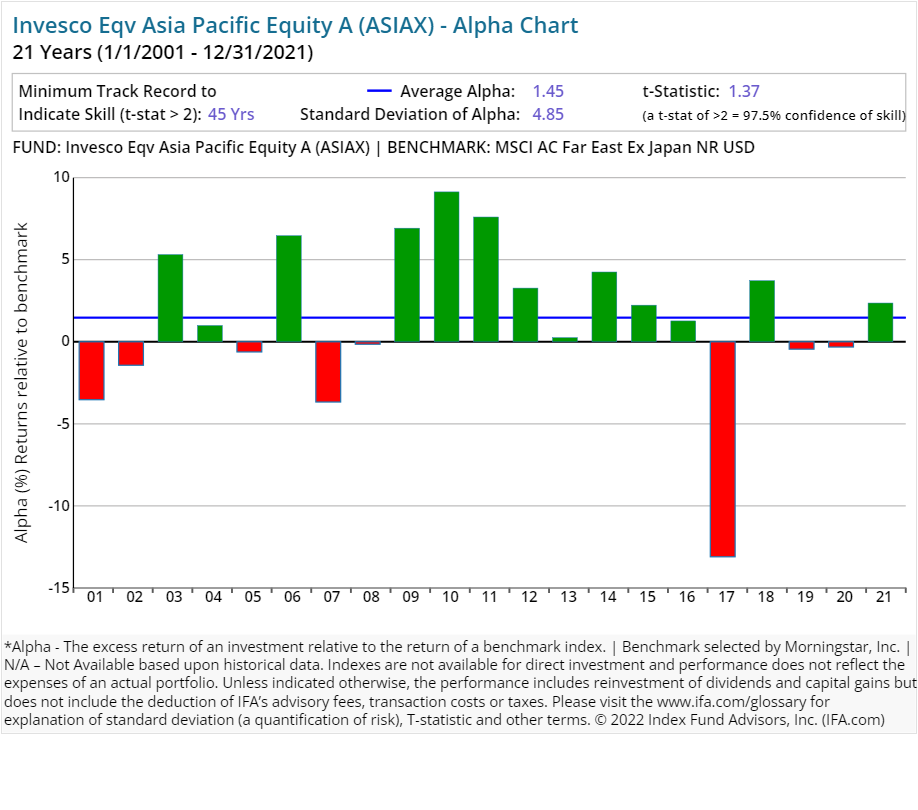
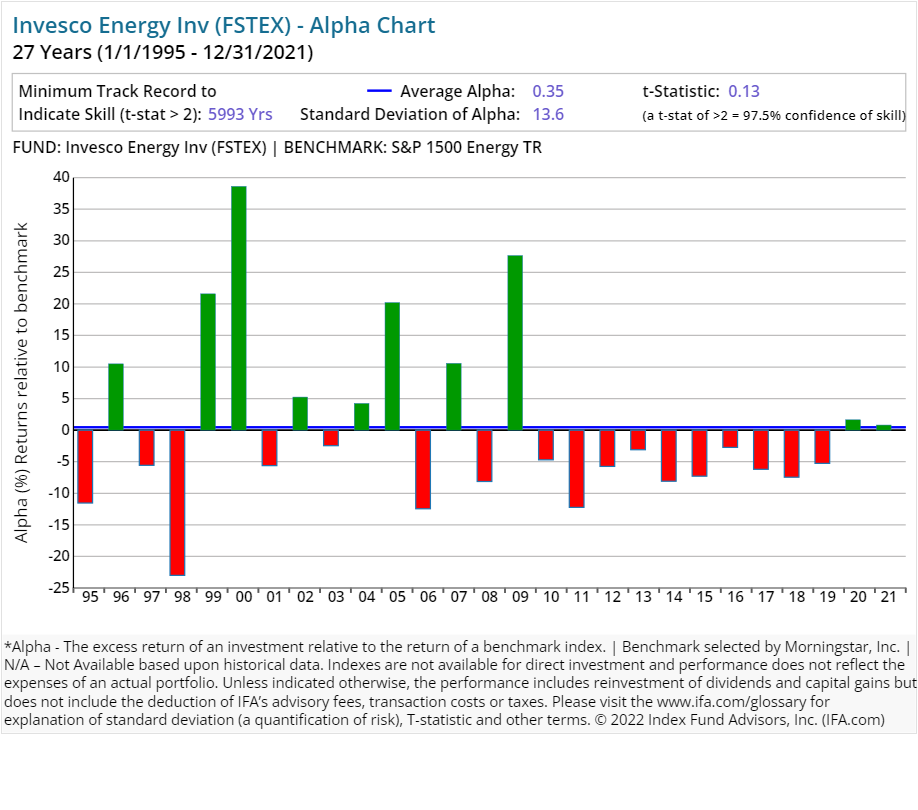
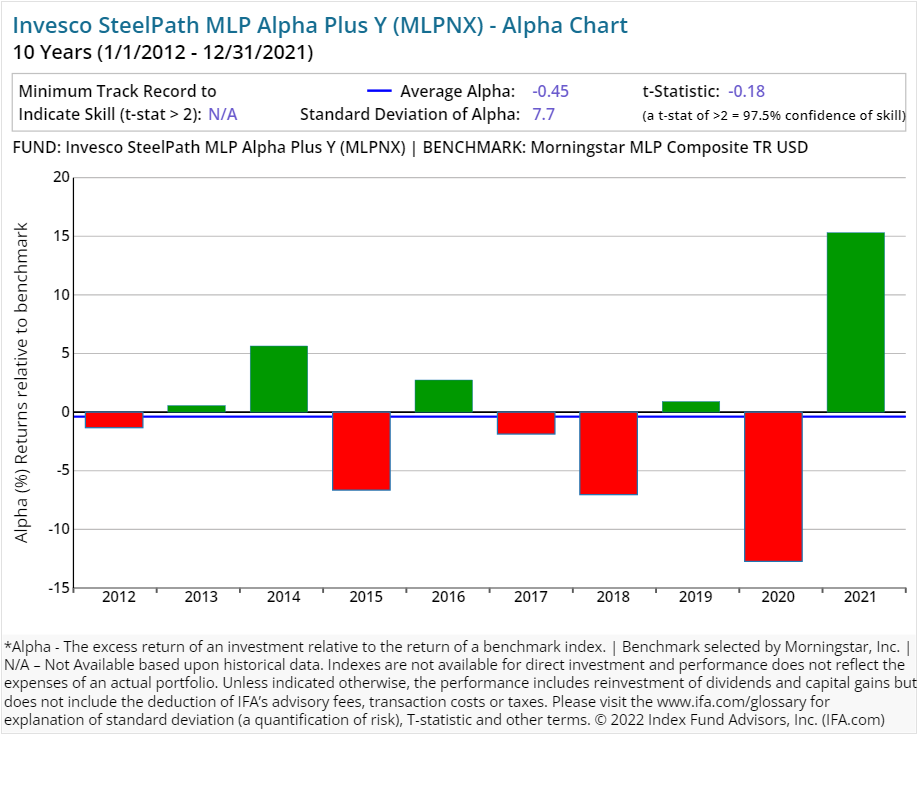
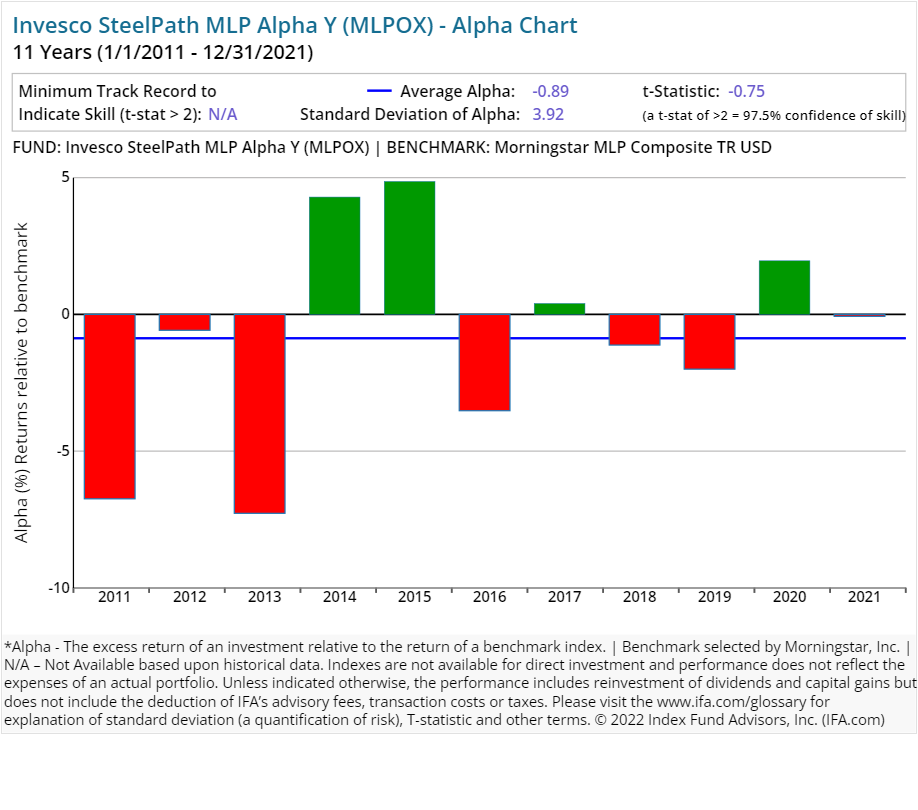
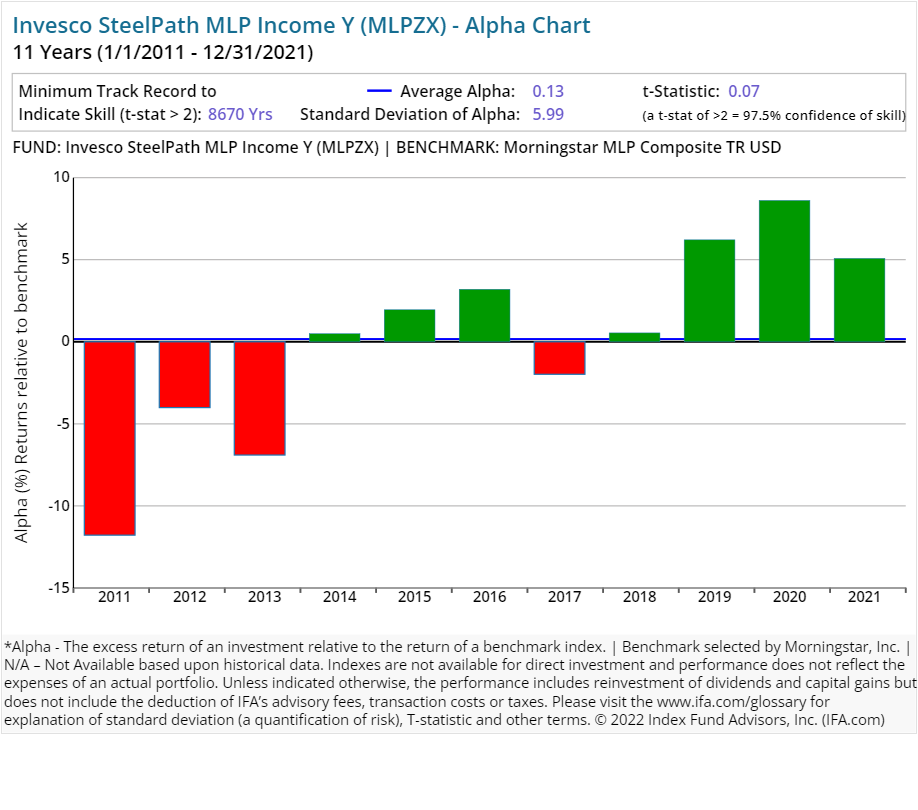
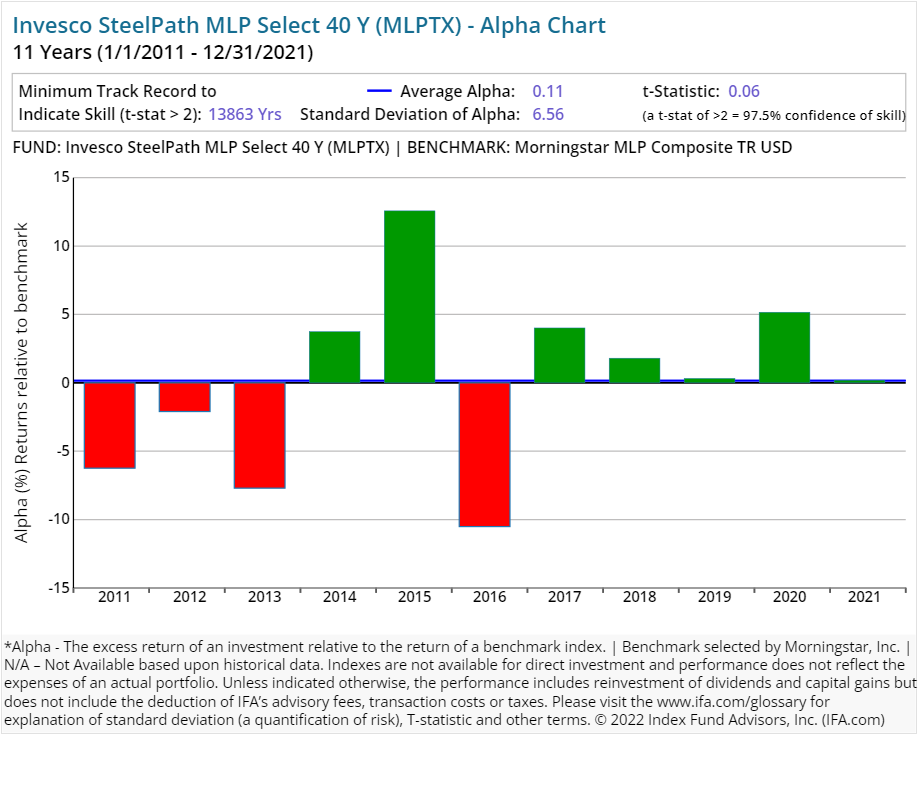
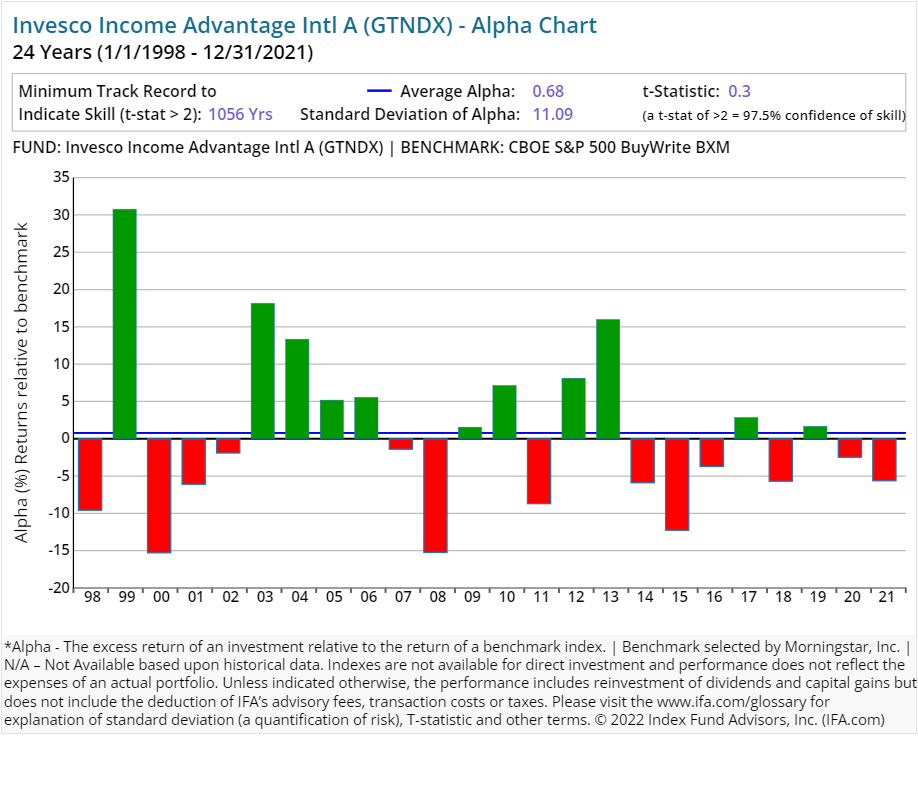
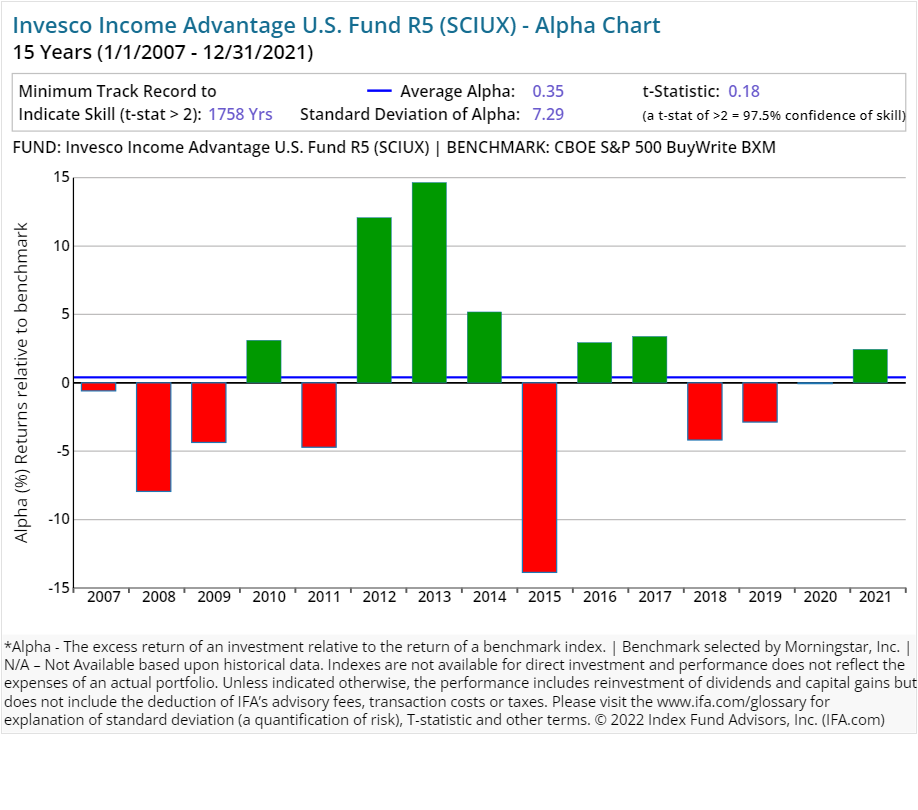
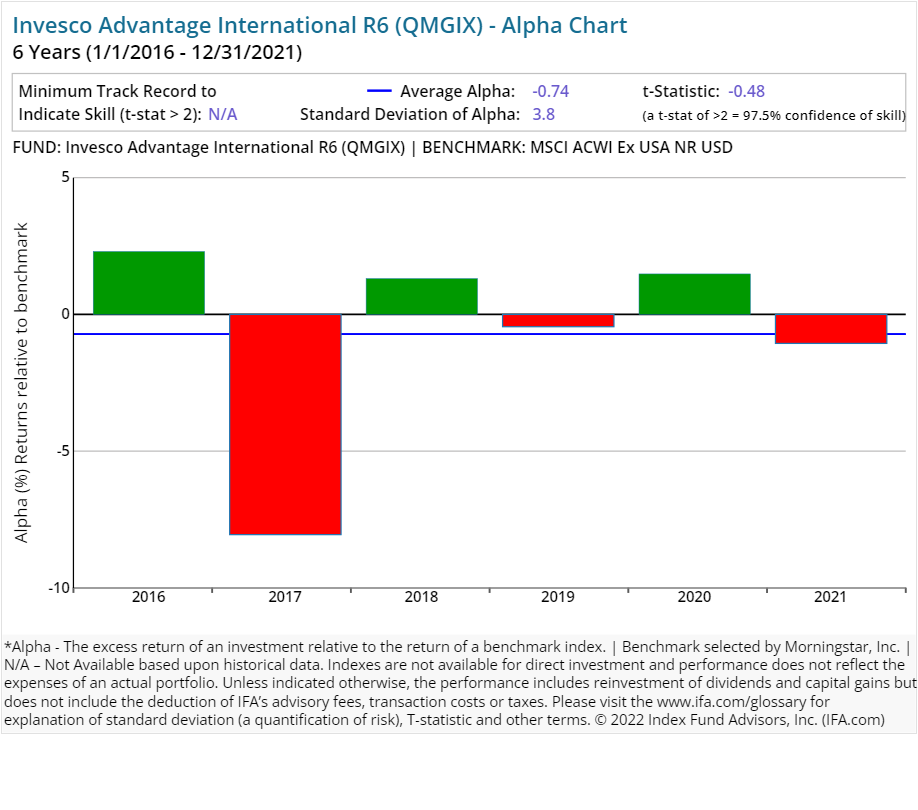
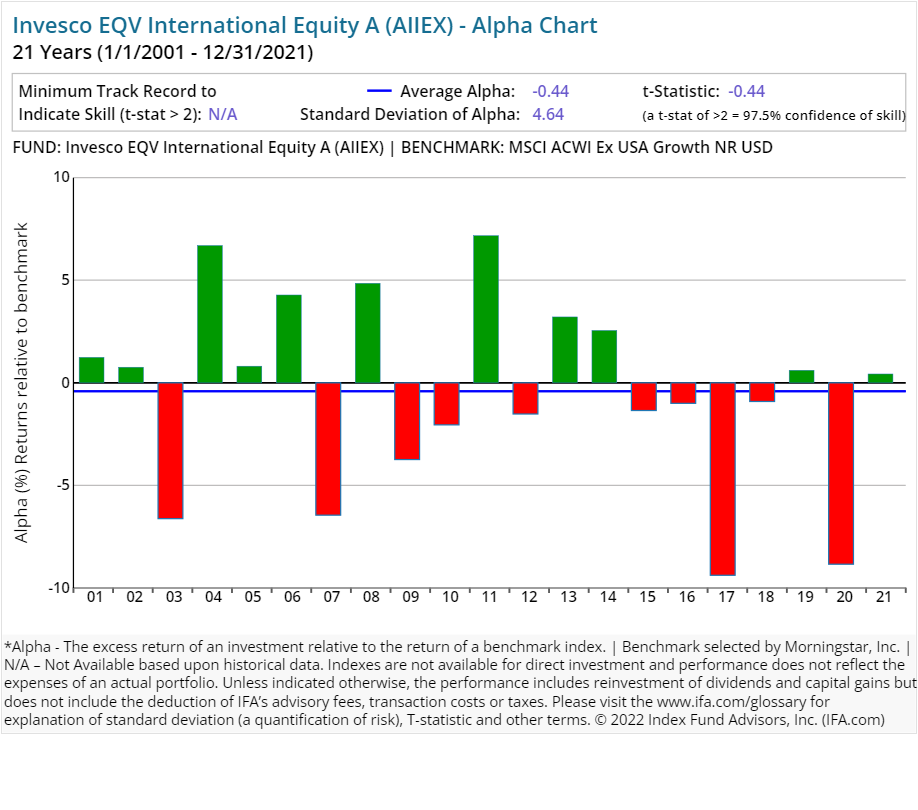
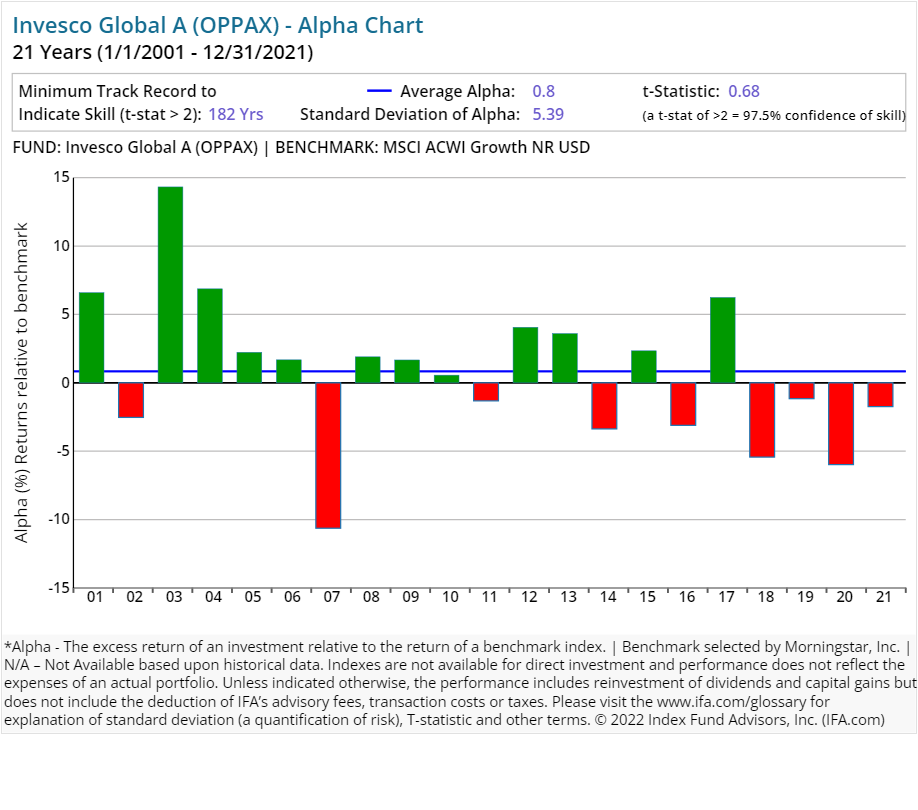
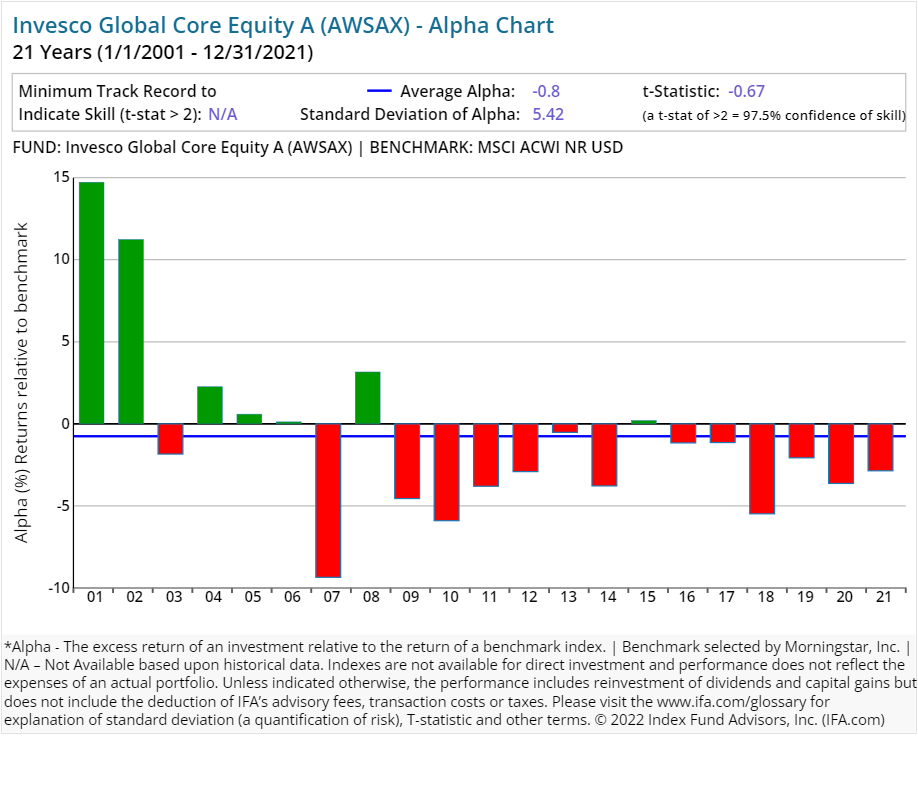
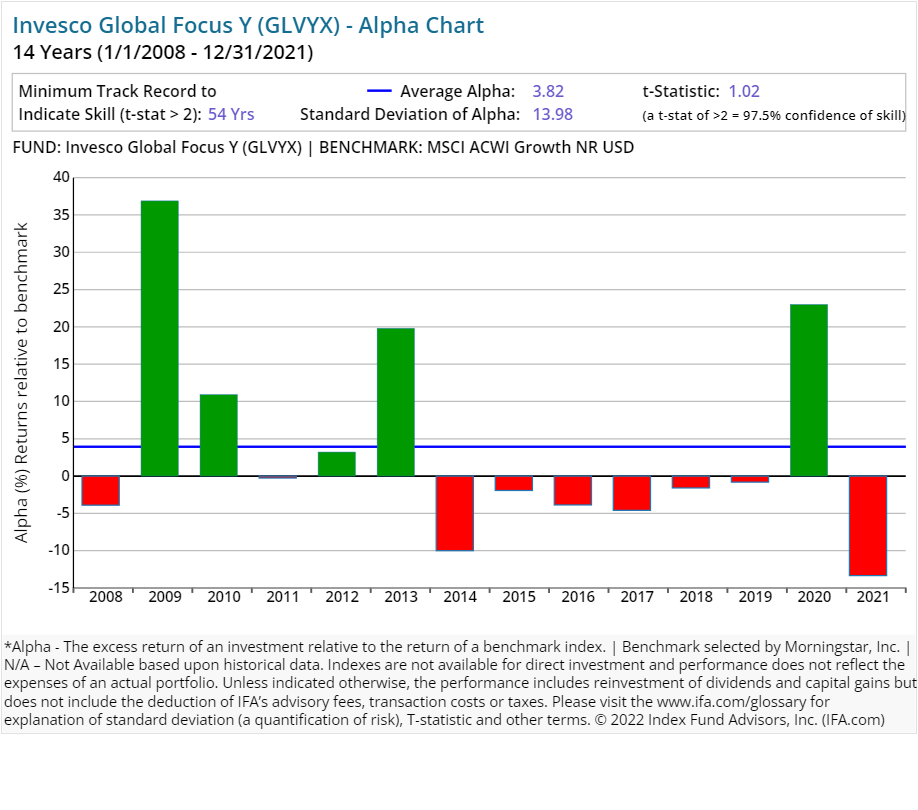
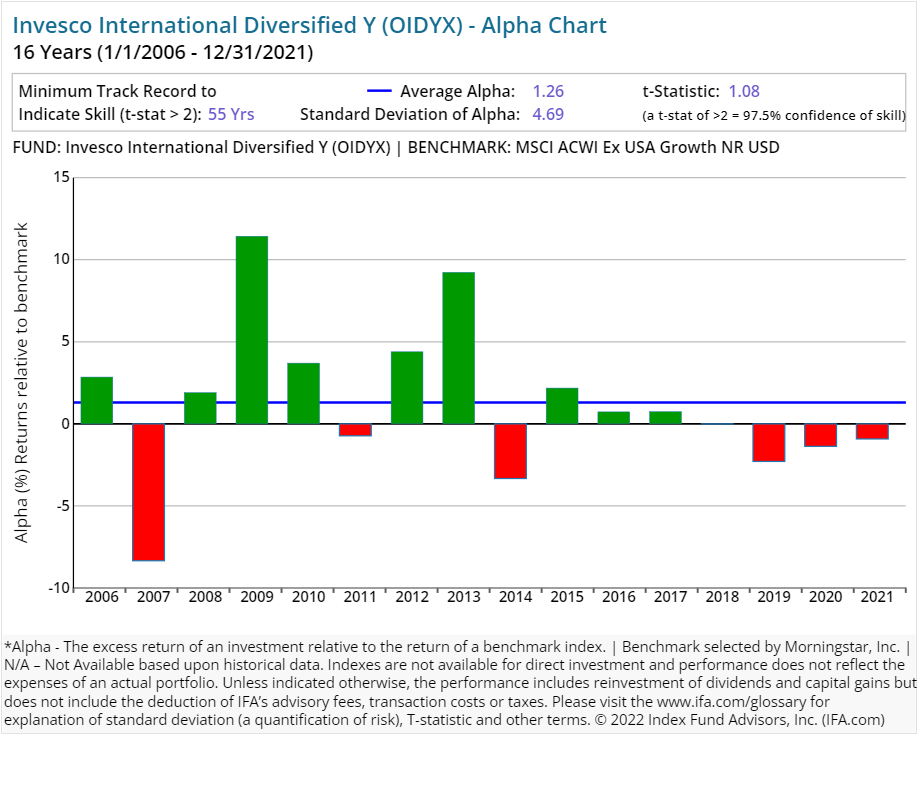
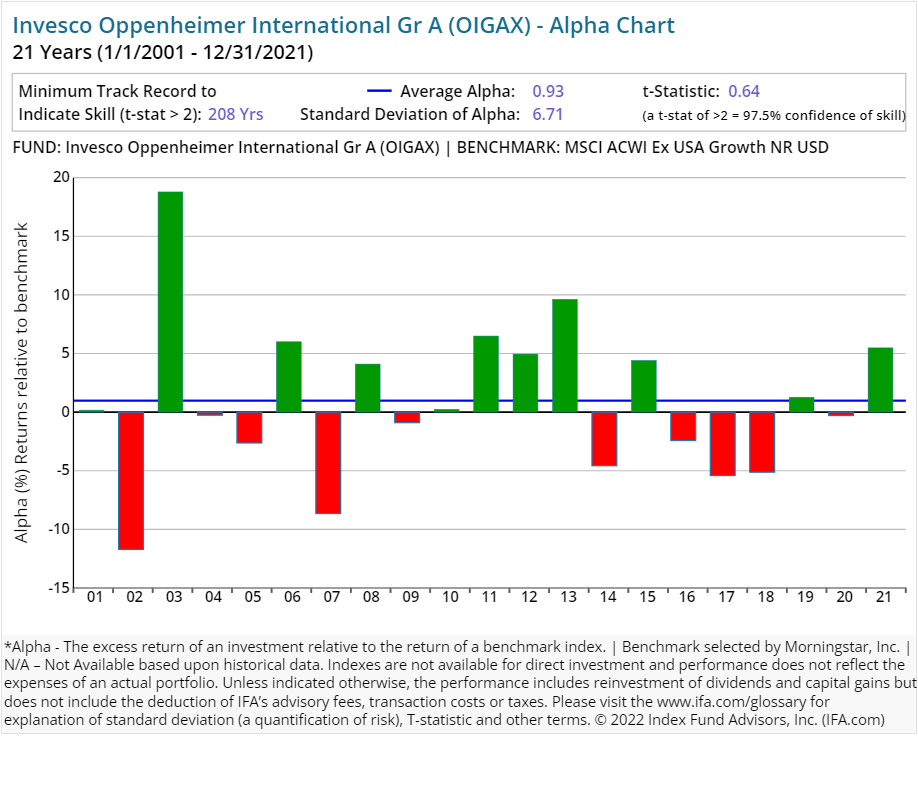
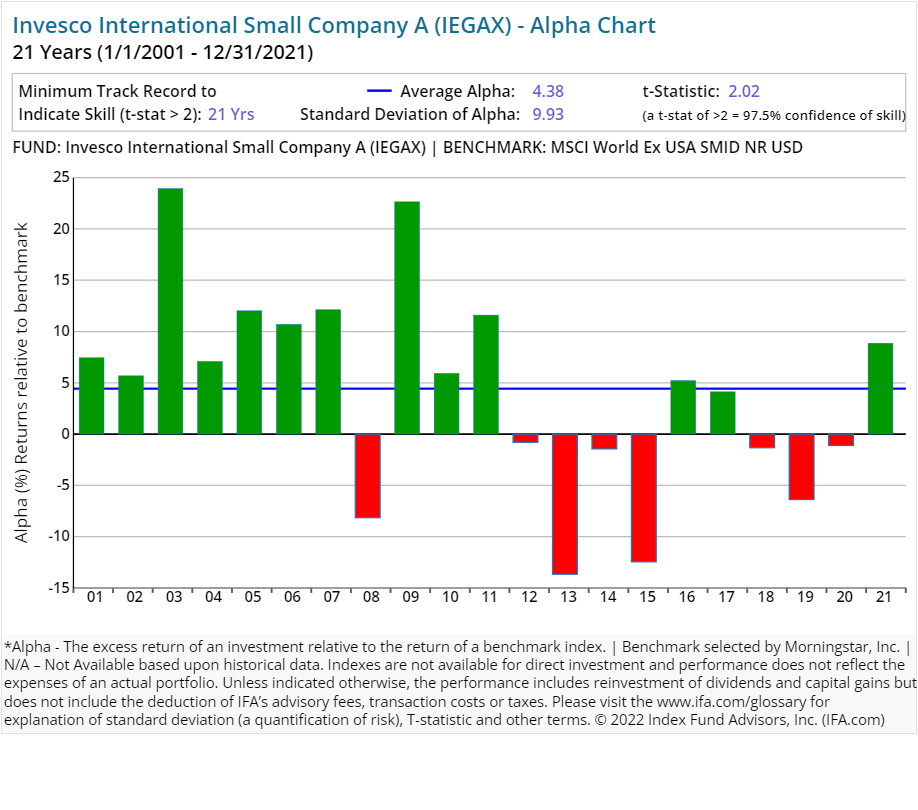
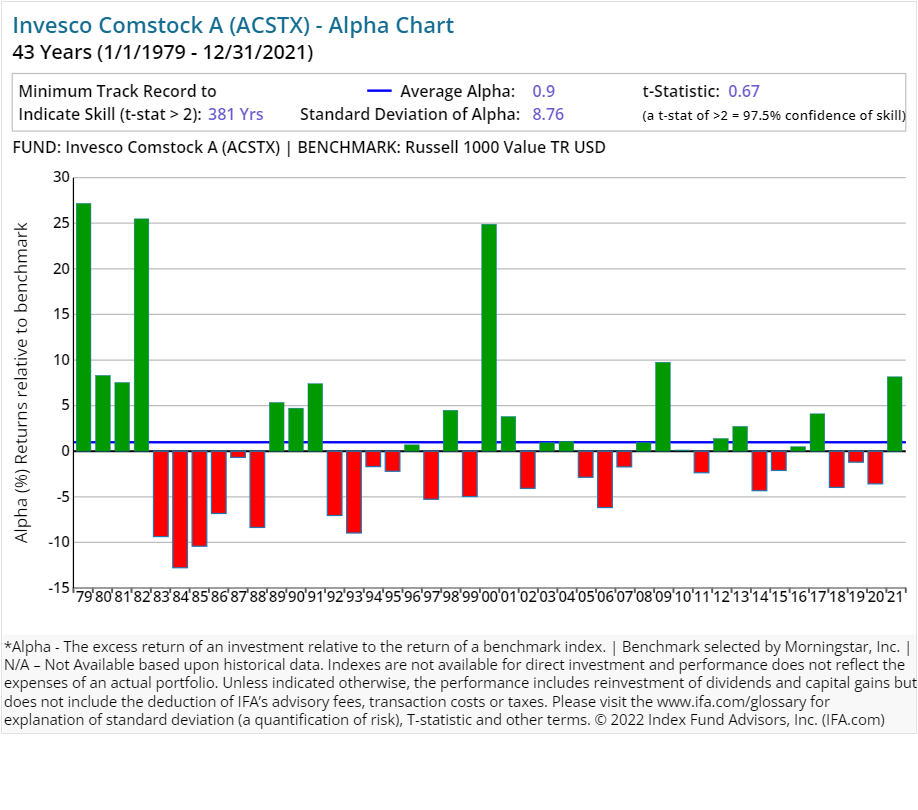
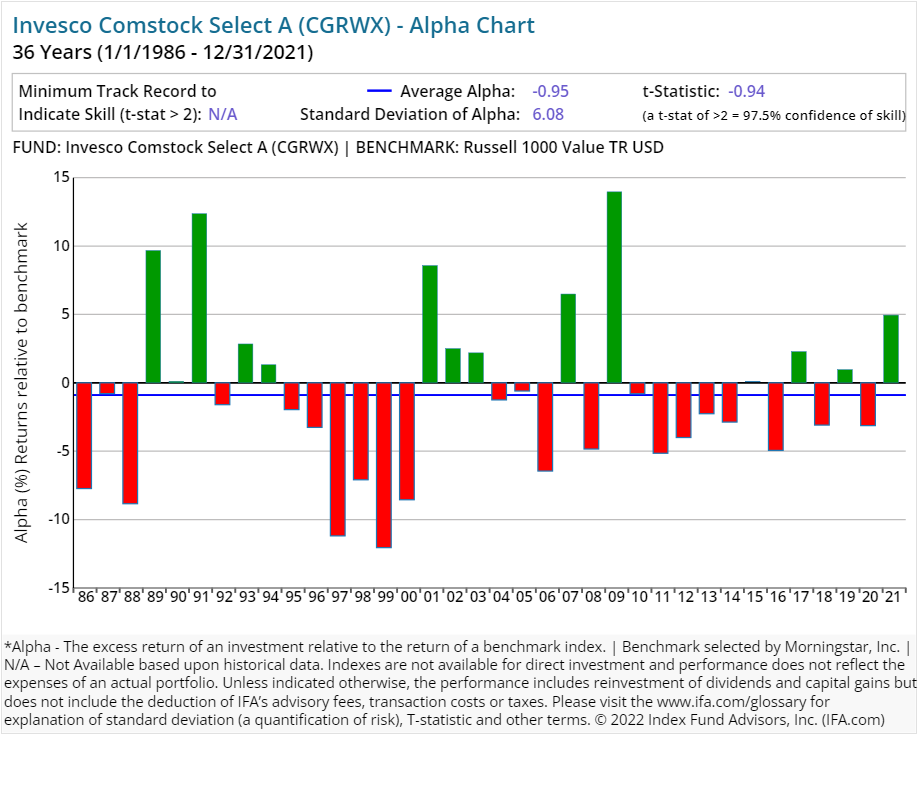
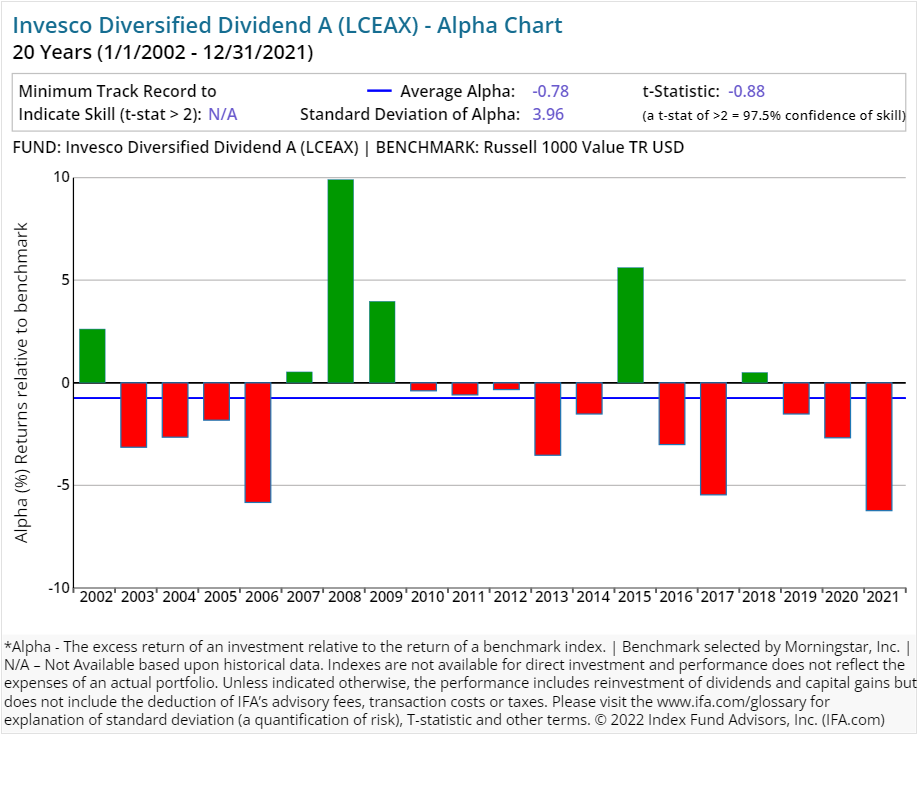
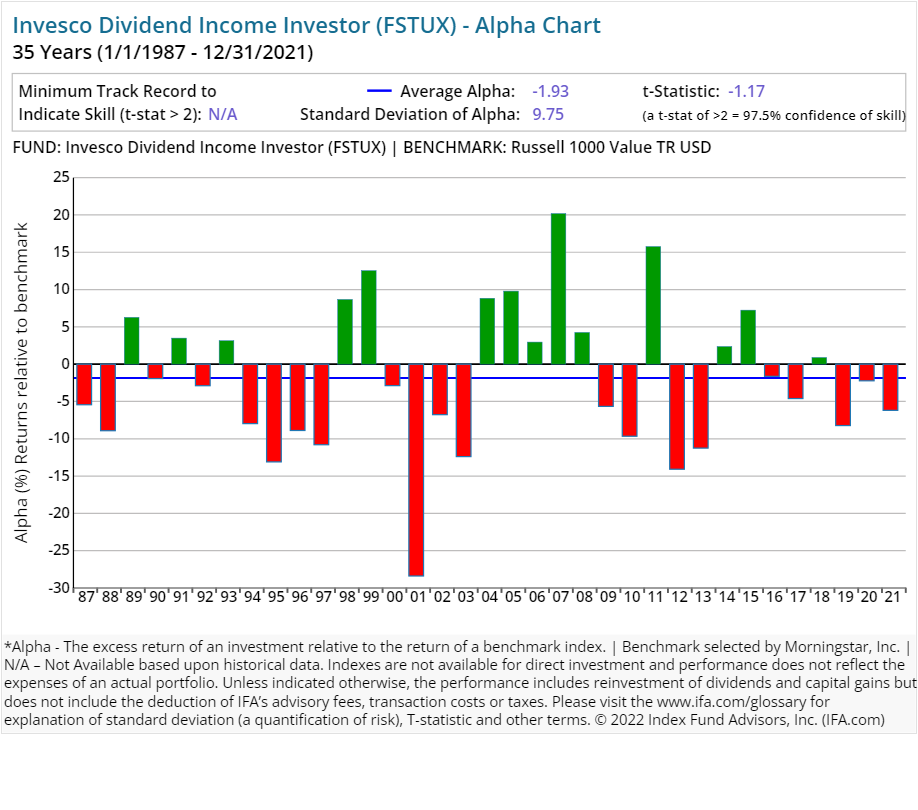
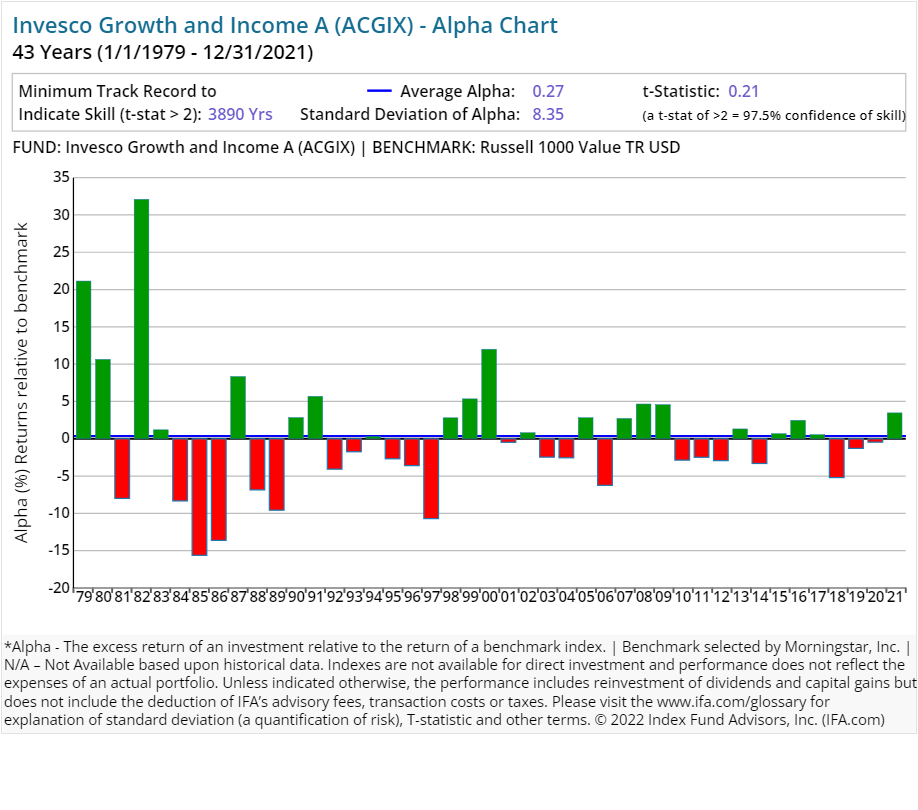
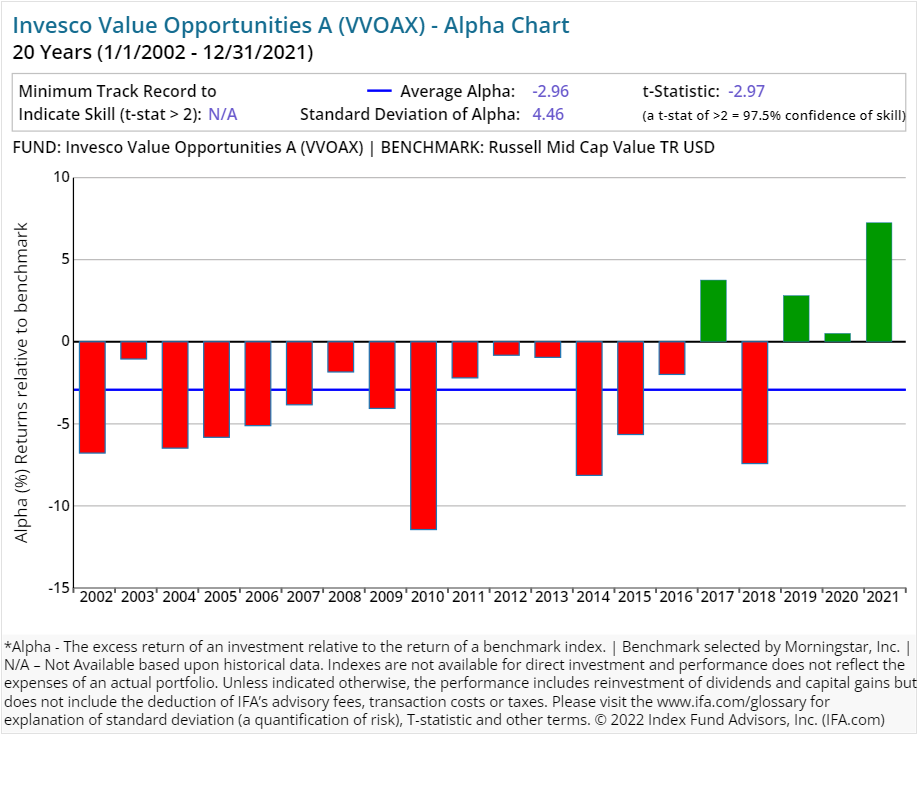
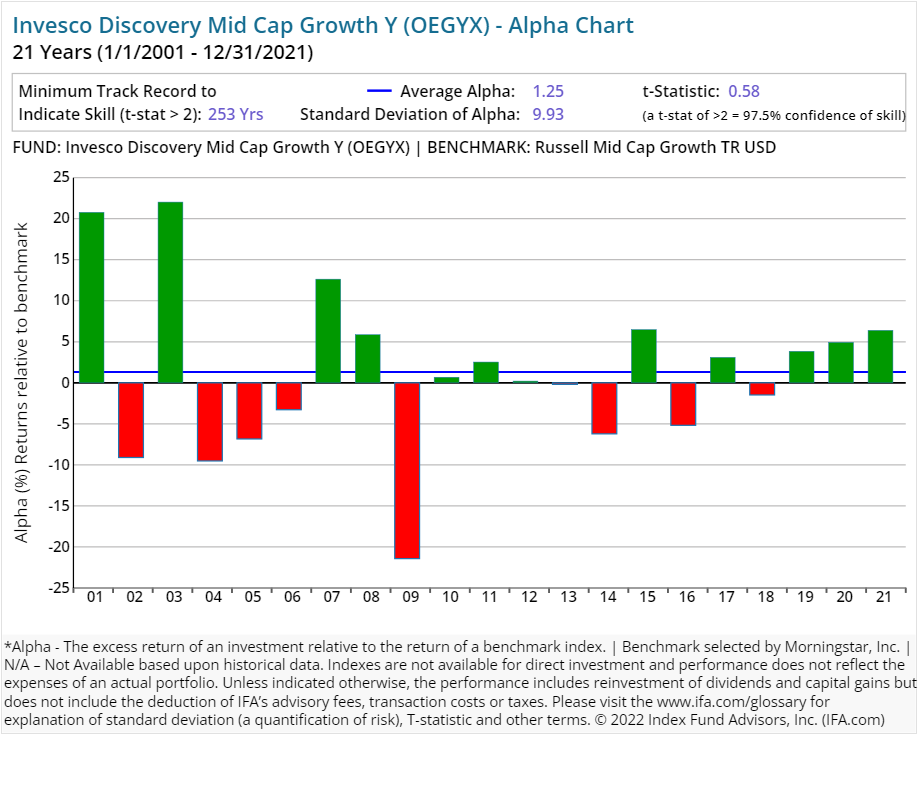
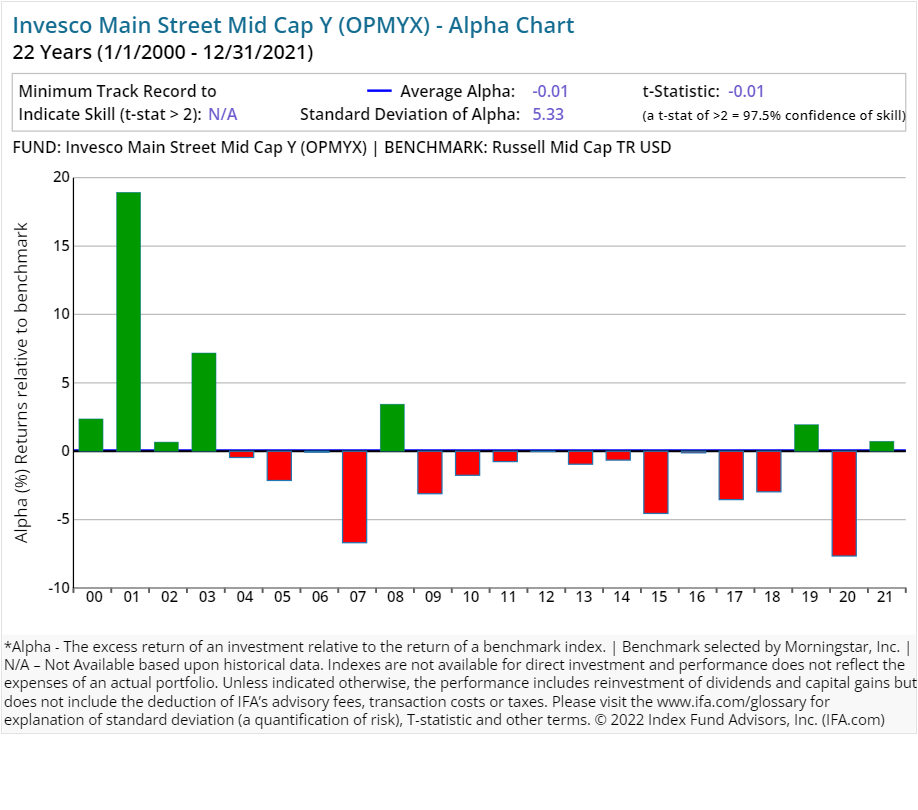
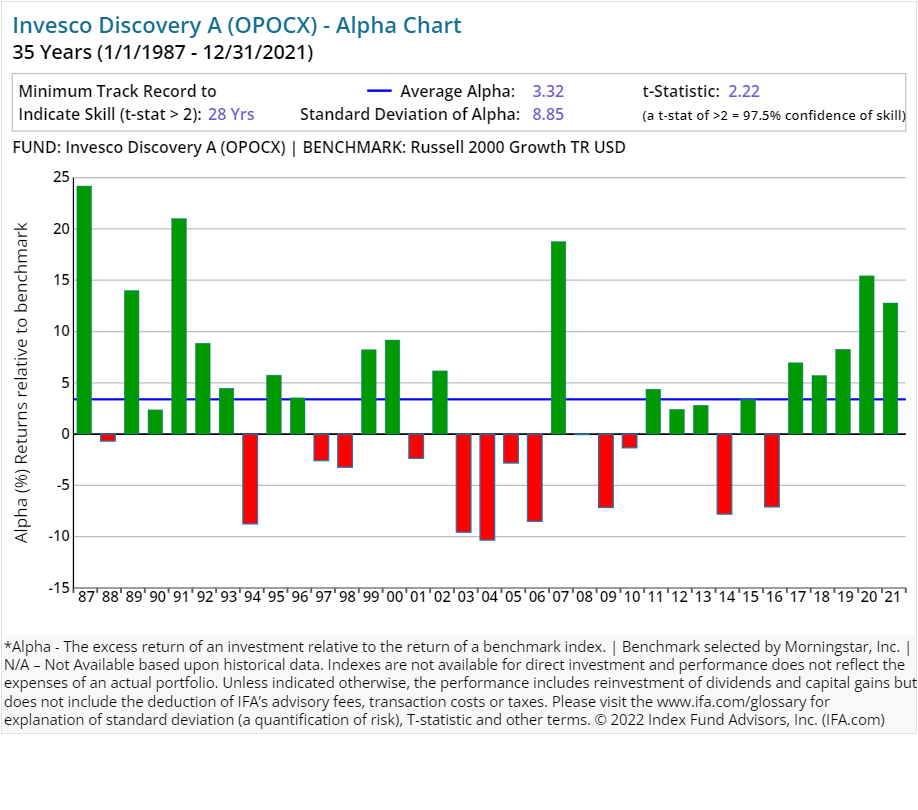
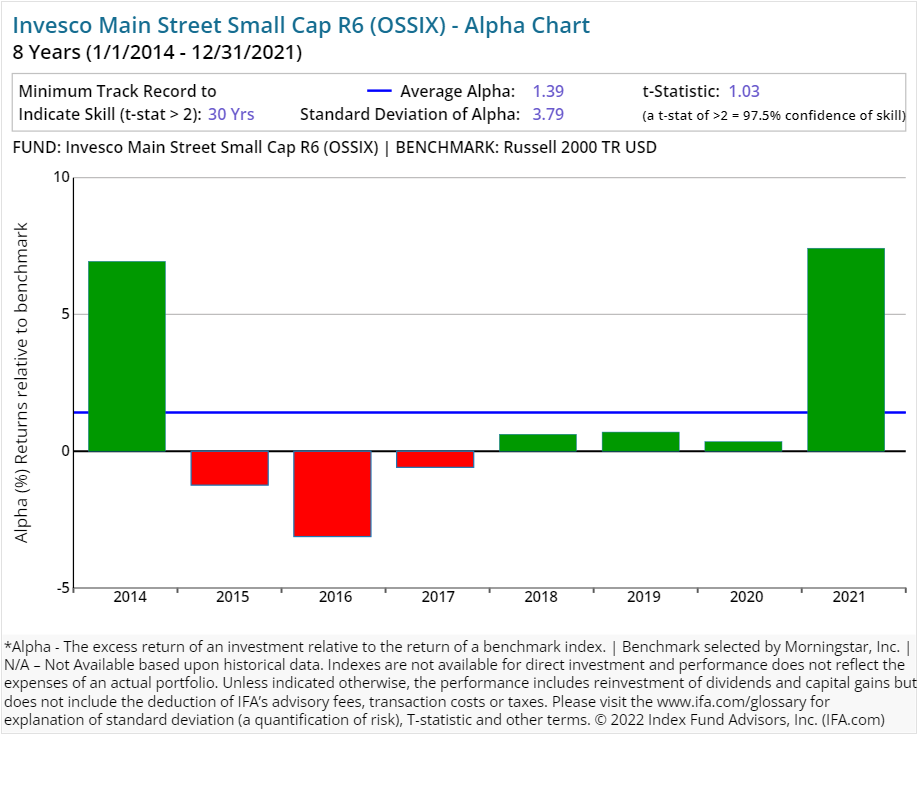
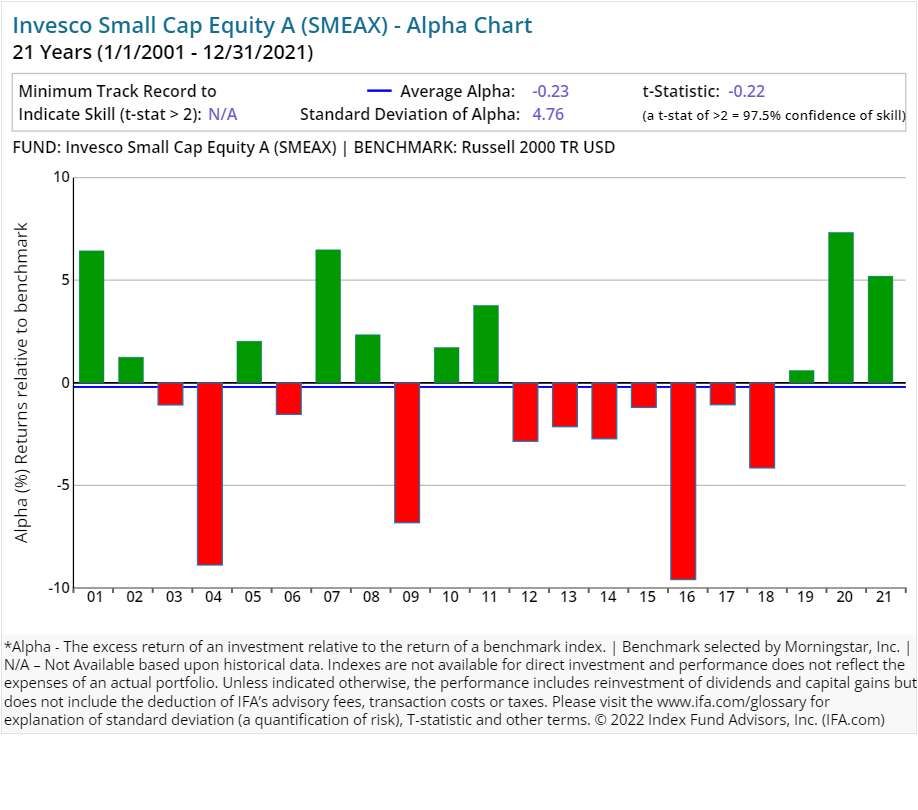
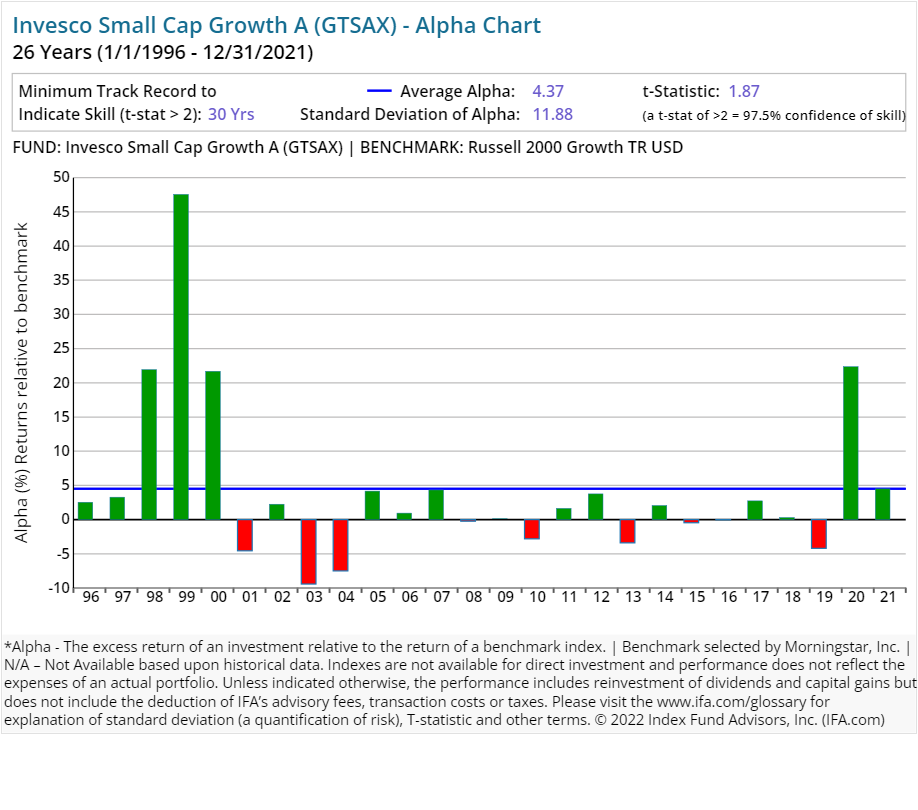
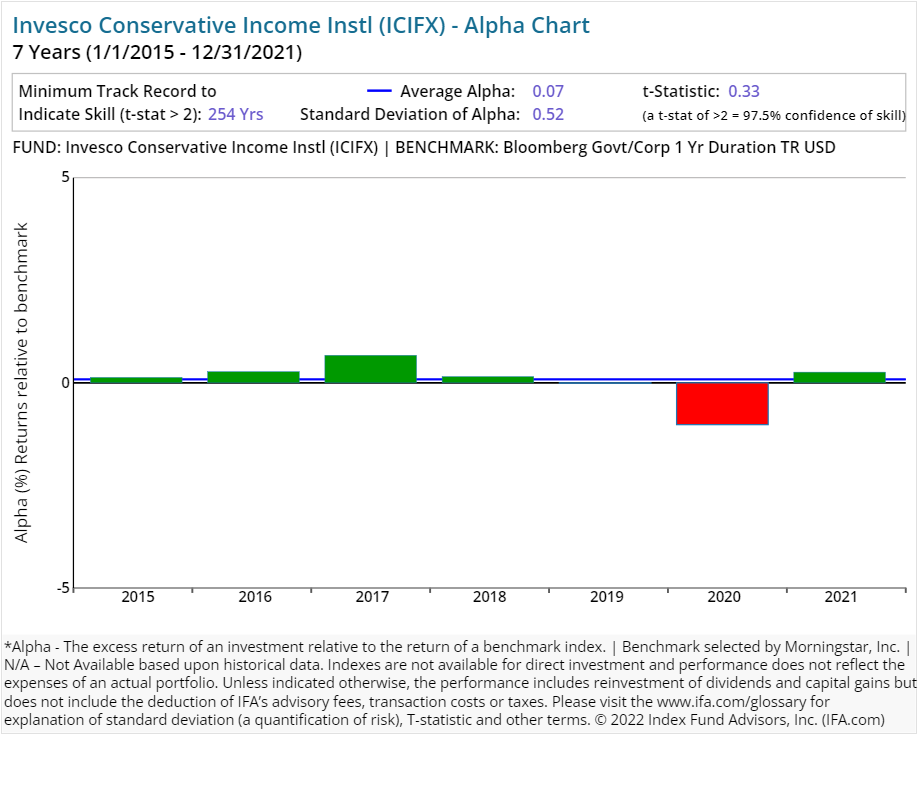
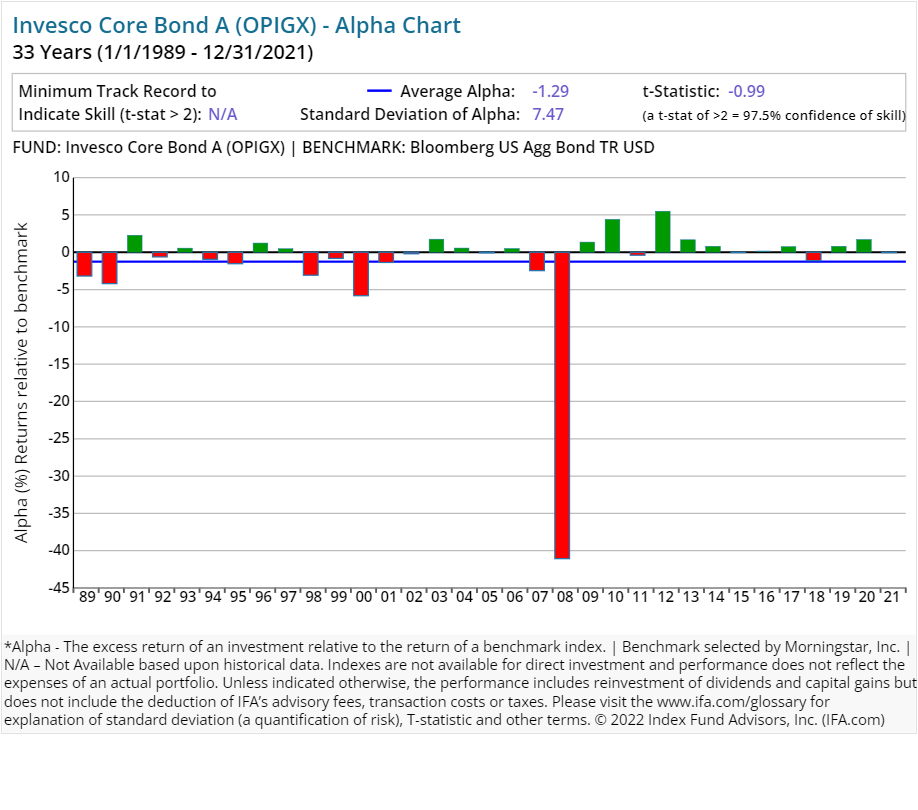
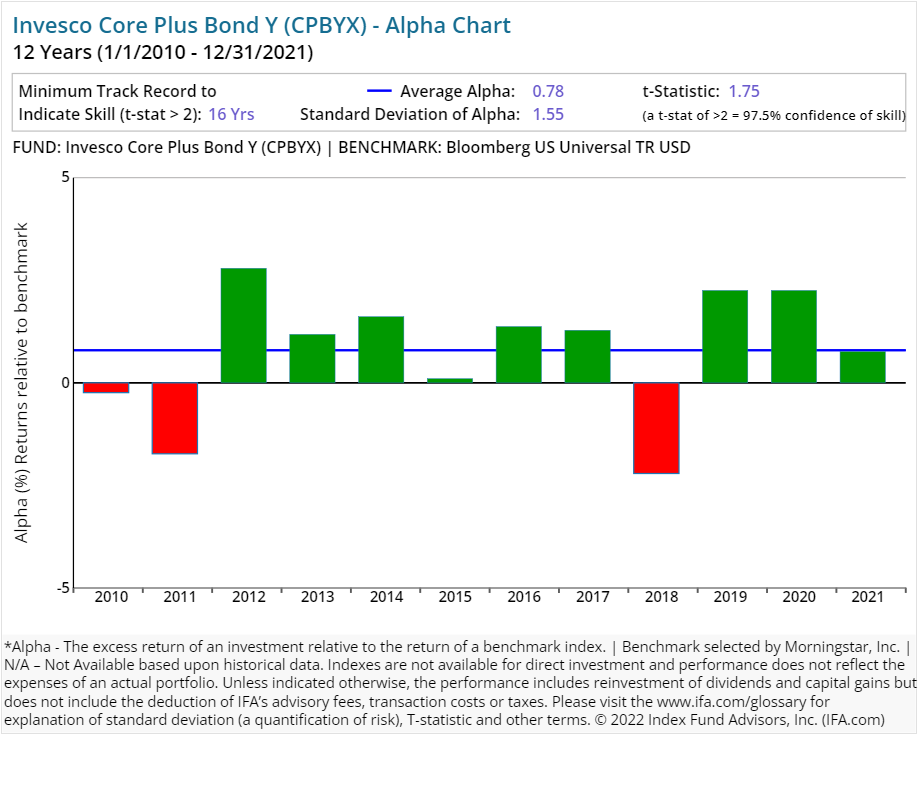
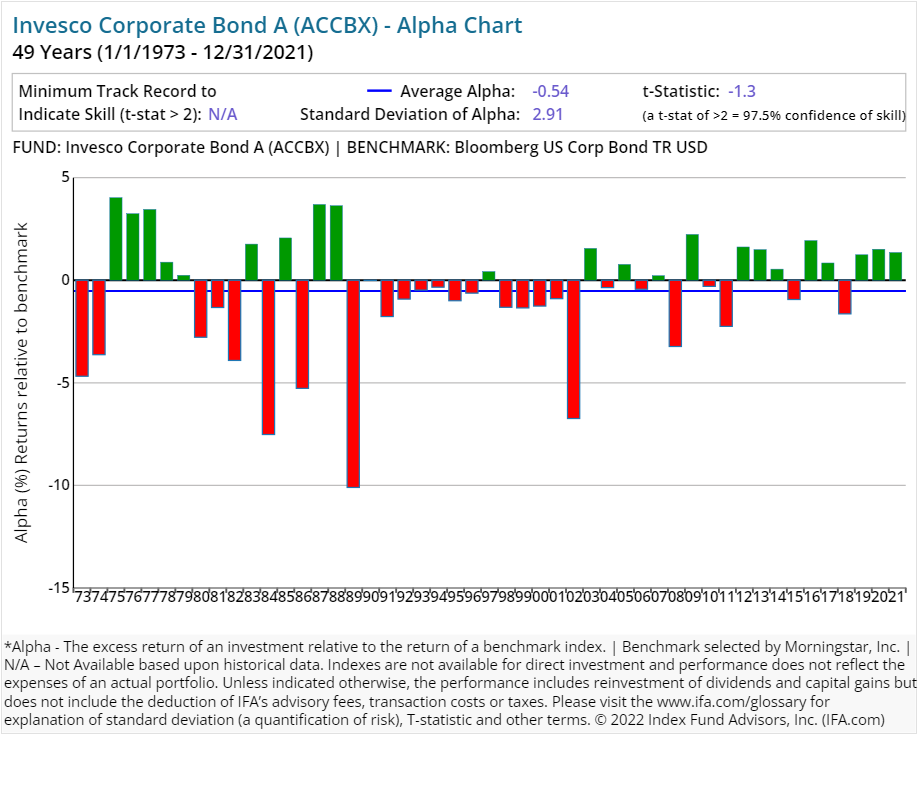
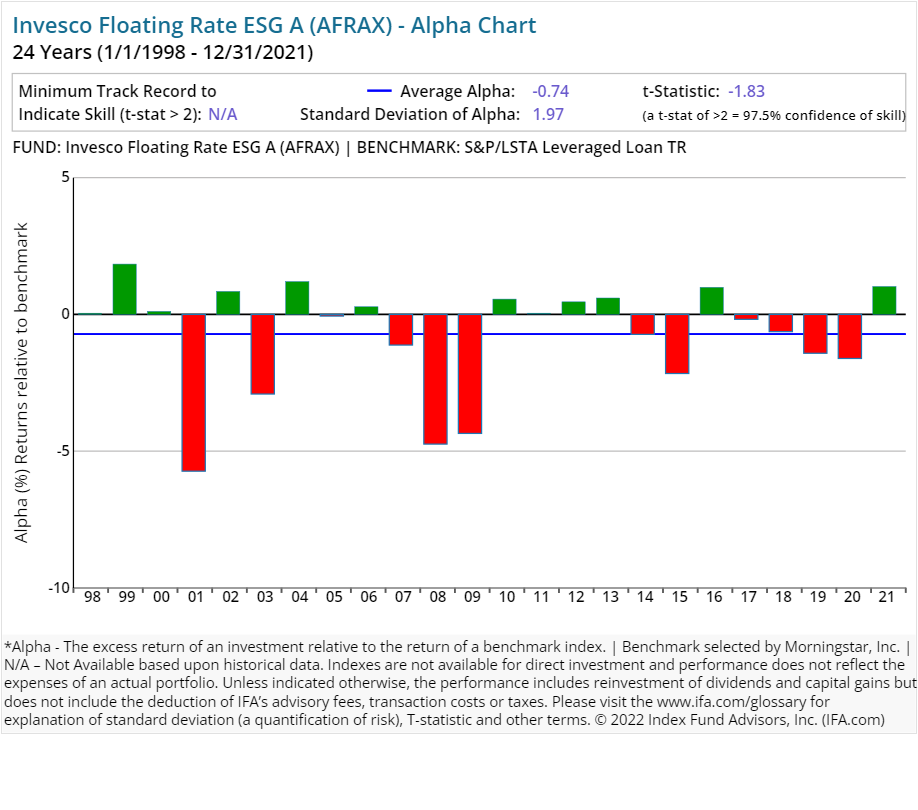
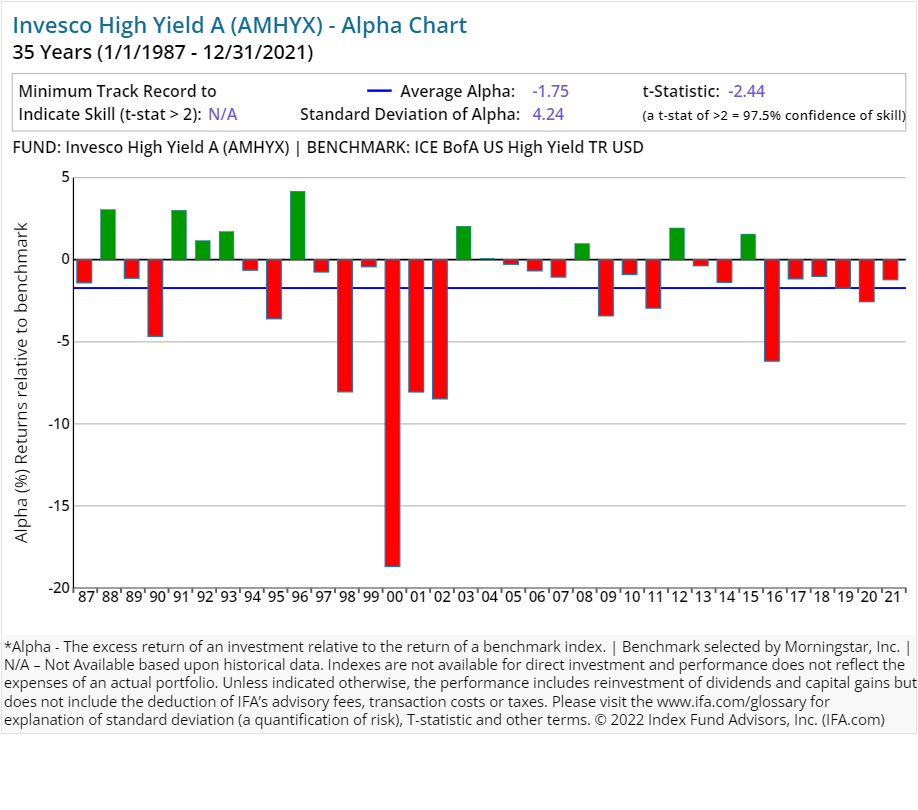
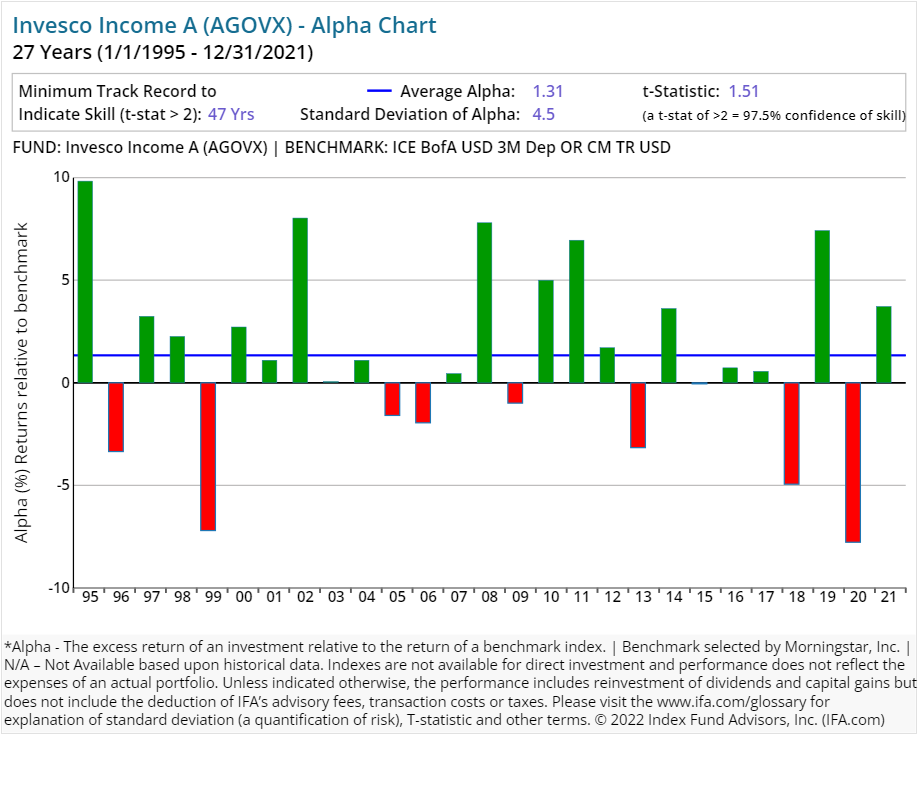
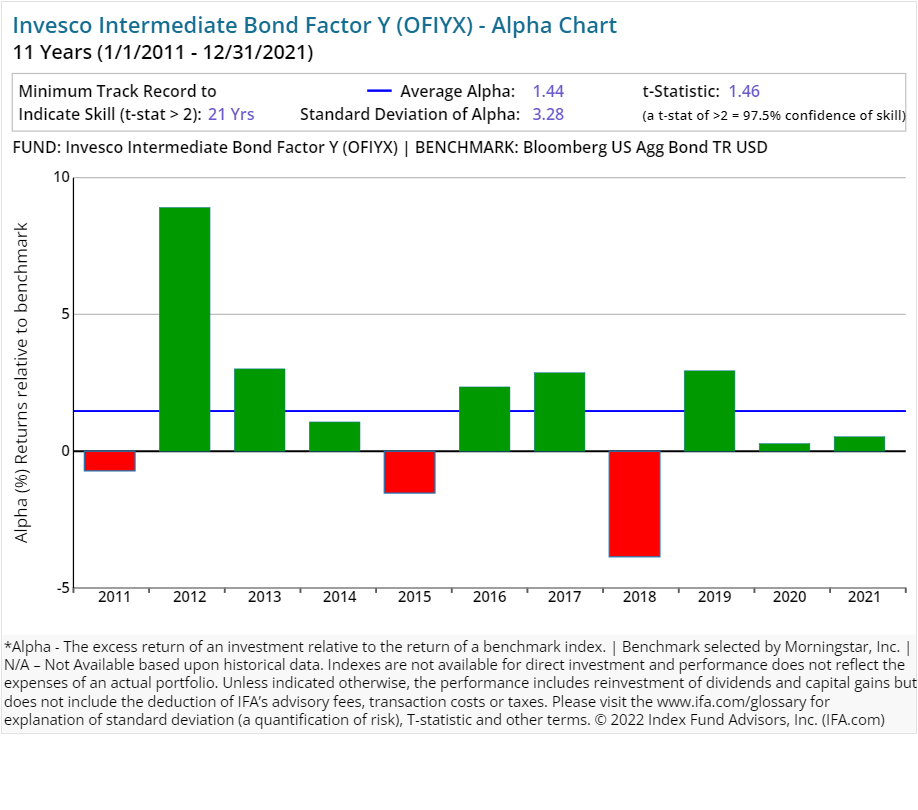
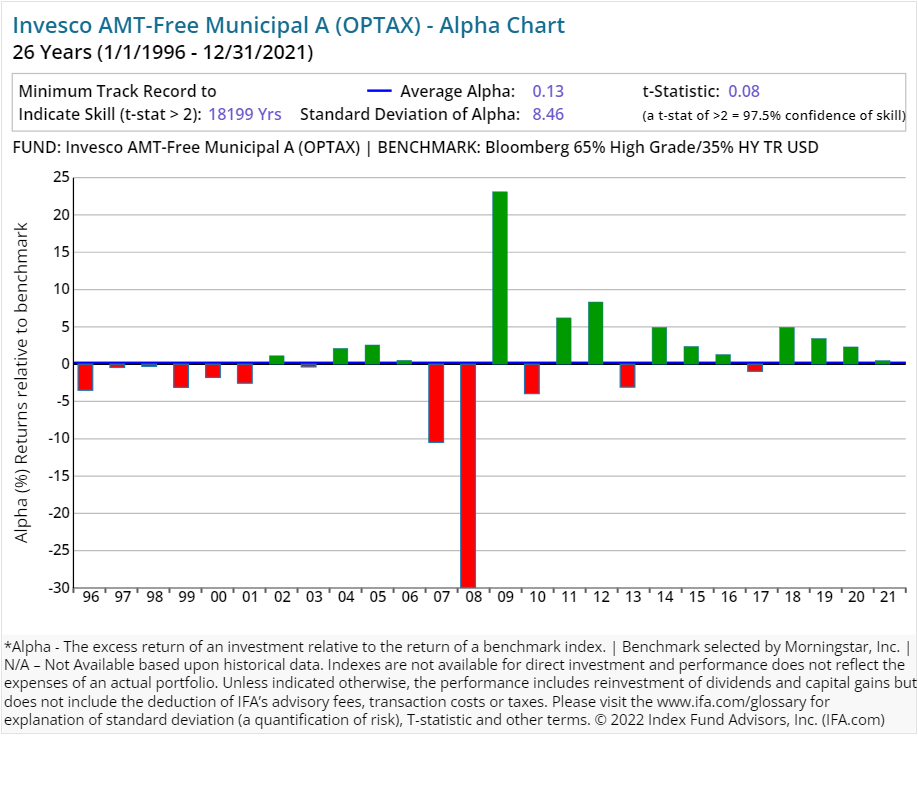
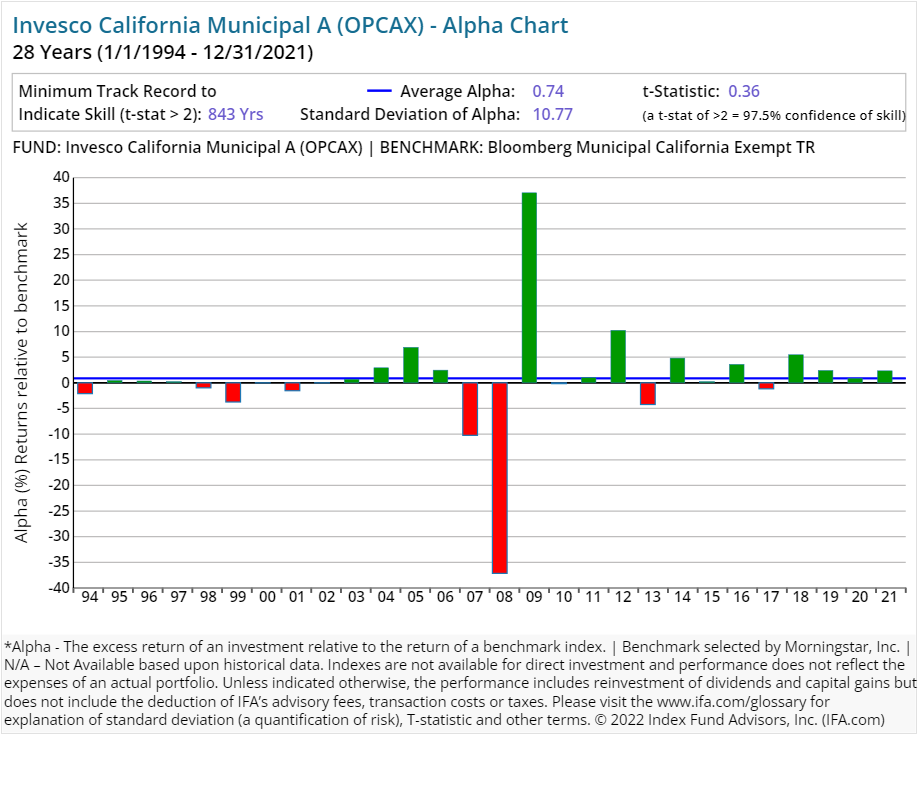
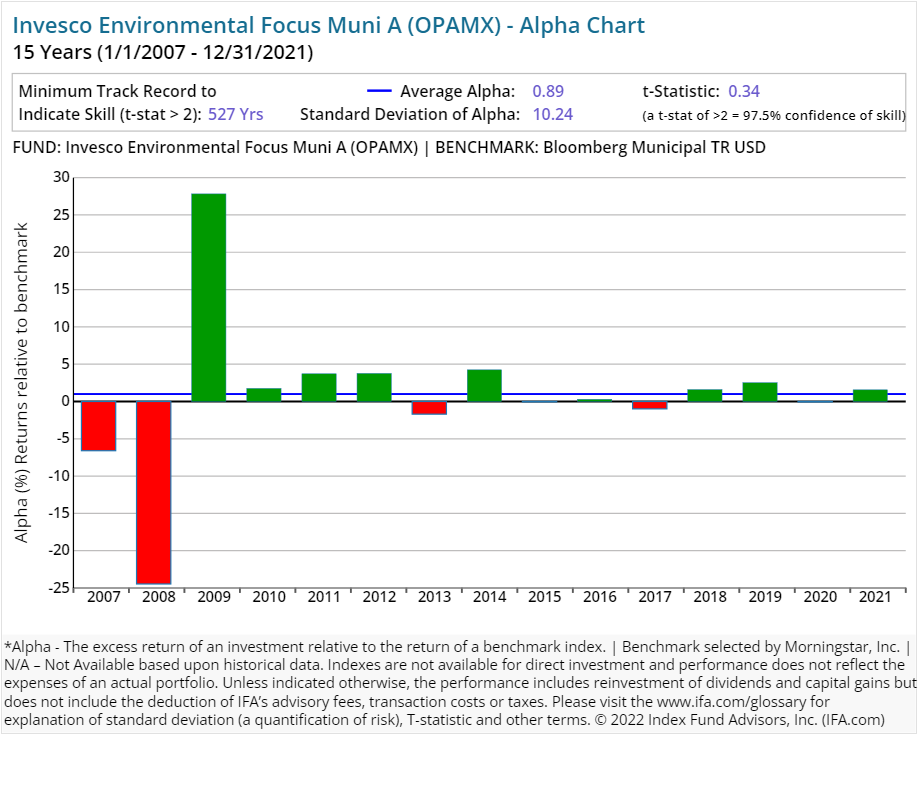
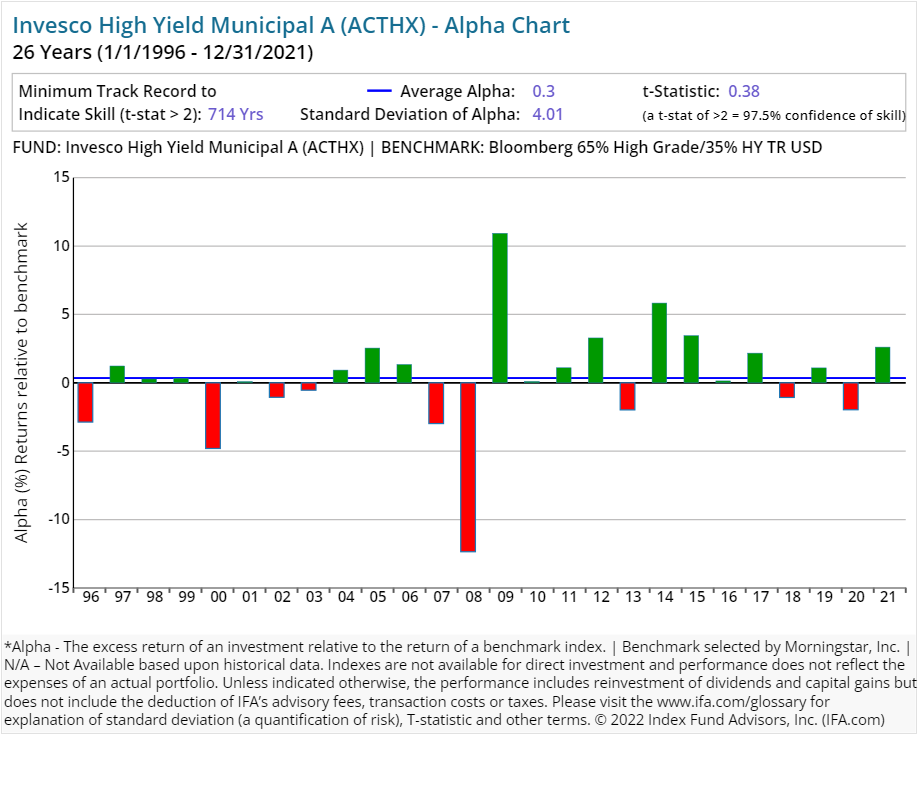
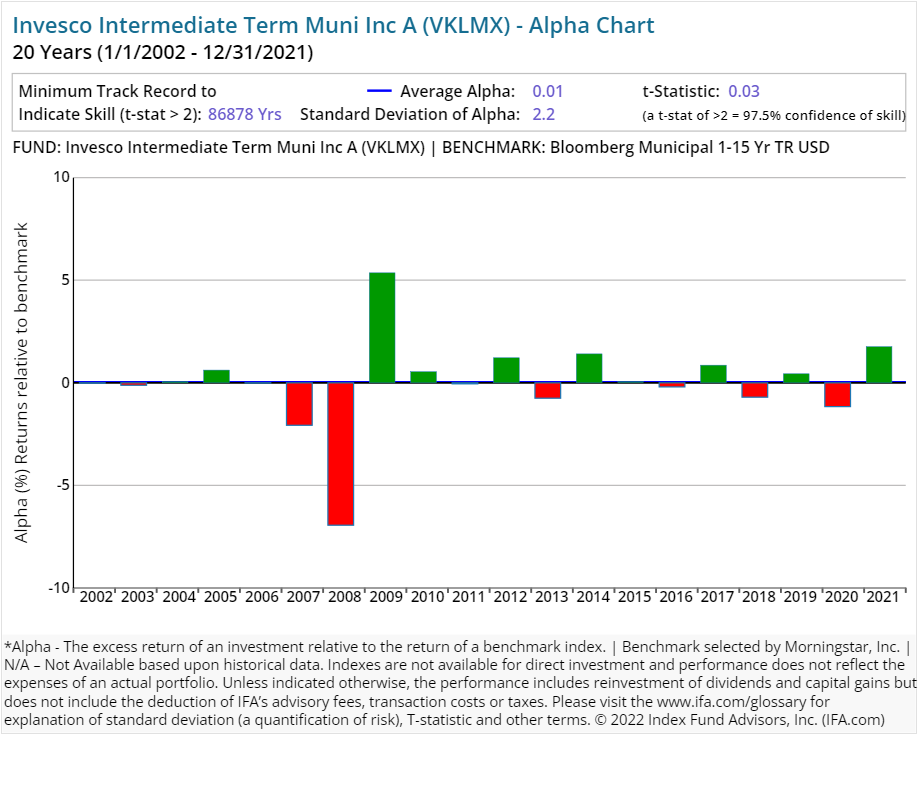
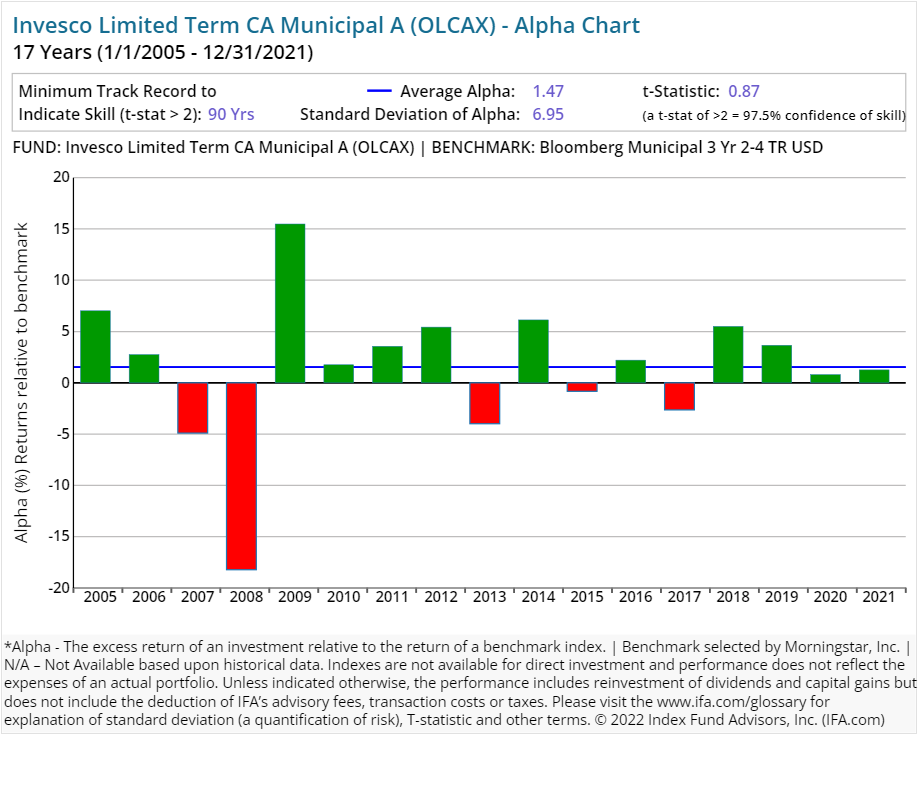
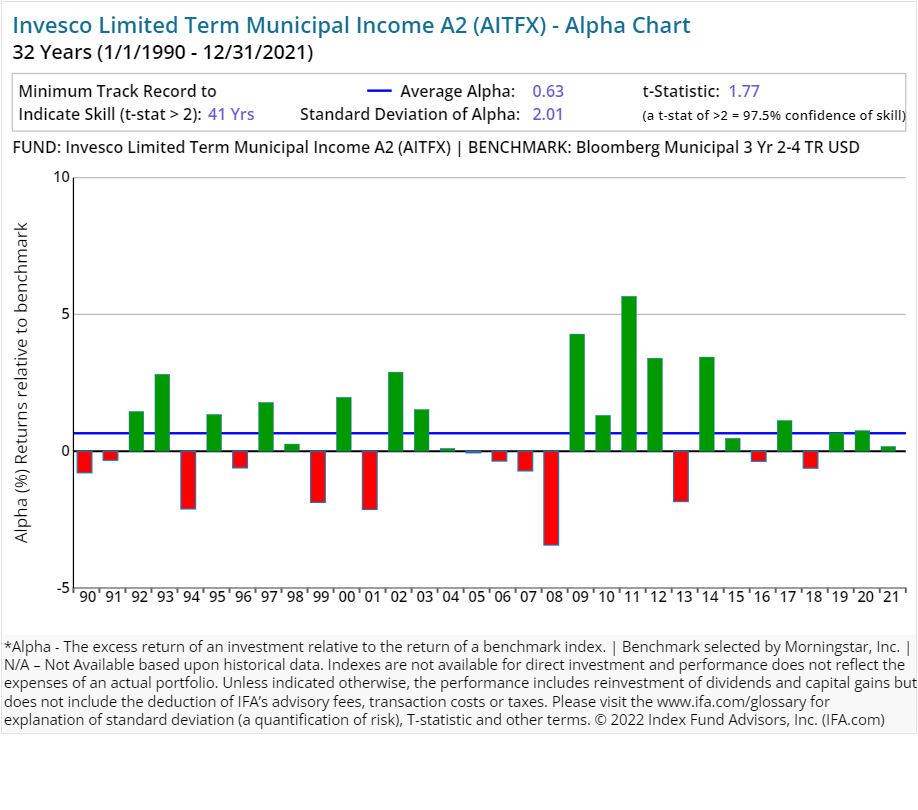
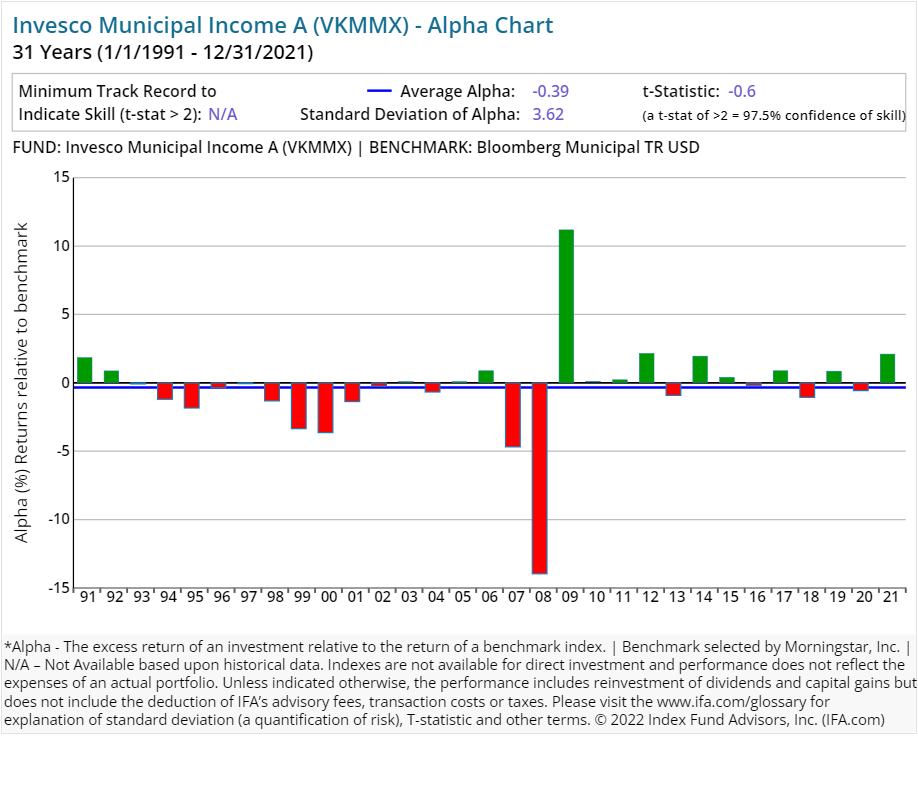
Below are the individual alpha charts for the existing Invesco actively managed mutual funds that have five years or more of a track record. Past performance is not indicative of future results. The conclusions drawn in this analysis are based on historical data and may not apply to all actively managed funds or strategies.

Here is a calculator to determine the t-stat. Don't trust an alpha or average return without one.
The Figure below shows the formula to calculate the number of years needed for a t-stat of 2. We first determine the excess return over a benchmark (the alpha) then determine the regularity of the excess returns by calculating the standard deviation of those returns. Based on these two numbers, we can then calculate how many years we need (sample size) to support the manager's claim of skill.
Footnotes:
1.) Invesco, news release "Invesco Ltd. Announces December 31, 2024 Assets Under Management," January 13, 2025.
2.) Morningstar, "A Return of Positive Flows Should Help Buoy Invesco's AUM During Periods of Market Weakness," Feb. 23, 2022.
3.) Morningstar, "Invesco Parent Rating," Gregg Wolper, Dec. 22, 2020.


 X
X