Standing as a thorn in the side of active management, Vanguard brought to market the first retail index mutual fund in 1976. That passively run S&P 500 clone wound up propelling the Malvern, Pa.-based asset manager into becoming an industry behemoth.
But it hasn't dropped anchor as an indexing pioneer. The fund developer has been aggressively expanding its presence in the very field it once fought so hard to reshape. Today, Vanguard markets itself as one of the largest active fund management shops in the world.
To those who remember those earlier years when a chorus of industry pundits roundly condemned the indexing advocacy of Vanguard founder John Bogle (who passed away in early 2019), this push deeper into active management might seem somewhat ironic. It's certainly true that Bogle started his firm in 1975 using a collection of active strategies. At the same time, Vanguard first captured broad market traction as a provider of index funds.
When Bogle was running this ship, he used to proudly tout his fund company's mission to serve as a true champion of the common investor. These days, however, it's not unusual for us to hear questions about whether Vanguard's current management considers an expanding number of active fund launches as simply another revenue stream.
Perhaps an even more pointed question by those who prize Bogle's fiduciary insights: Does this firm's current leadership actually believe that actively managed funds can produce alpha with any degree of statistical significance — and consistency — over time?
Given such a fundamental set of questions underlying Vanguard's active family of mutual funds, we've decided to put these investment vehicles under our microscope as part of IFA's ongoing series breaking down how stock and bond pickers are doing compared to their respective indexes. One universal conclusion from our research into active managers: On the whole, they've failed to deliver on the value proposition they profess, which is to reliably outperform a risk comparable benchmark.
Controlling for Survivorship Bias
It's important for investors to understand the idea of survivorship bias. First, let's start with the basics. This study's universe includes 63 active strategies with at least five years of performance data currently offered by Vanguard. Our research references Morningstar's independent classification system to analyze individual funds.
While there are 63 active mutual funds with five or more years of performance-related data offered by Vanguard, it doesn't necessarily mean these are the only strategies this company has ever managed. In fact, there are 24 mutual funds with five-plus years of data that no longer exist. This can be for a variety of reasons including poor performance or the fact that they were merged with another fund. We will show what their aggregate performance looks like shortly.
Fees & Expenses
Let's first examine the costs associated with Vanguard's surviving mutual fund active strategies. It should go without saying that if investors are paying a premium for investment "expertise," then they should be receiving above average results consistently over time. The alternative would be to simply accept a market's return, less a significantly lower fee, via an index fund.
The costs we examine include expense ratios, sales loads — front-end (A), back-end (B) and level (C) — as well as 12b-1 marketing fees. These are considered the "hard" costs that investors incur. Prospectuses, however, do not reflect the trading costs associated with mutual funds.
Commissions and market impact costs are real expenses associated with implementing a particular investment strategy and can vary depending on the frequency and size of the trades executed by portfolio managers.
We can estimate the costs associated with an investment strategy by looking at its annual turnover ratio. For example, a turnover ratio of 100% means that the portfolio manager turns over the entire portfolio in one year. This is considered an active approach, and investors holding these funds in taxable accounts will likely incur a higher exposure to tax liabilities, such as short- and long-term capital gains distributions, than those incurred by passively managed funds.
The table below details the hard costs as well as the turnover ratio for all 63 surviving active mutual funds offered by Vanguard that have at least five years of complete performance history. (The funds are listed by oldest share class.) You can search this page for a symbol or name by using Control F in Windows or Command F on a Mac. Then click the link to see the alpha chart. Also, remember that this is what is considered an in-sample test; the next level of analysis is to do an out-of-sample test (for more information see here).
| Fund Name | Ticker | Turnover Ratio % | Prospectus Net Expense Ratio | Global Broad Category Group | Global Category |
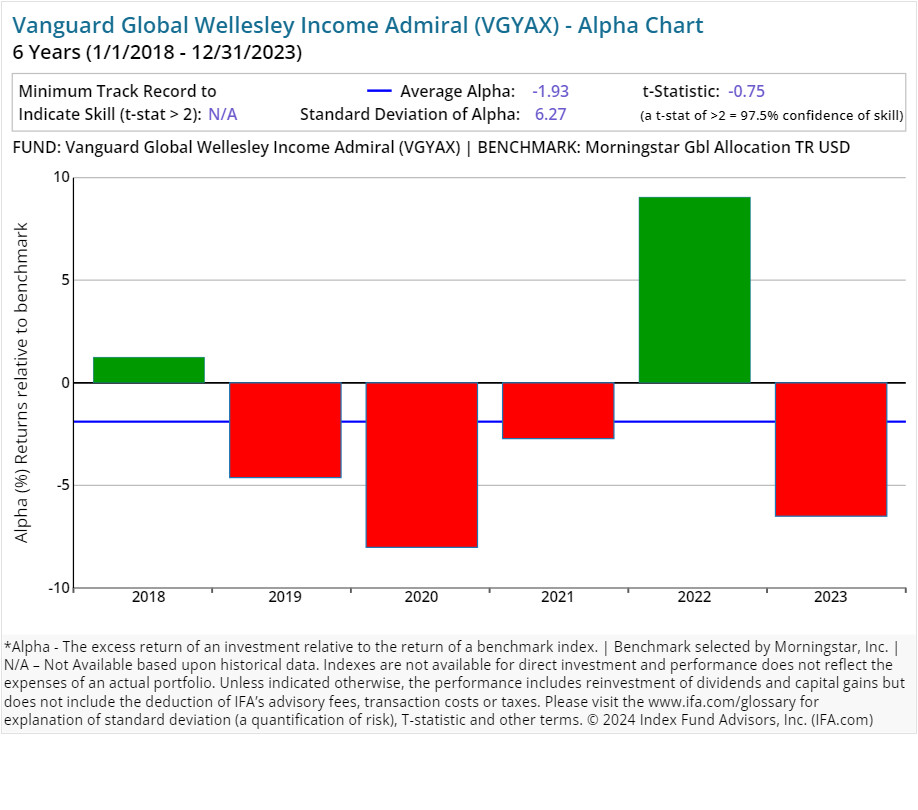
| Vanguard Global Wellesley Income Admiral | VGYAX | 150.00 | 0.31 | Allocation | Moderate Allocation |
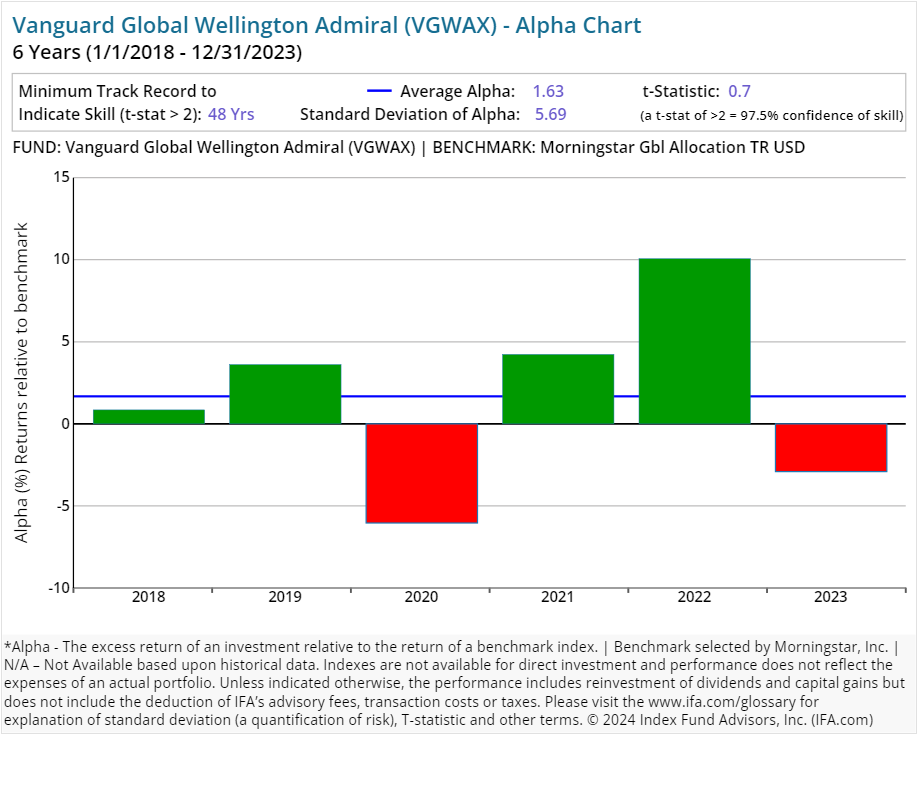
| Vanguard Global Wellington Admiral | VGWAX | 93.00 | 0.37 | Allocation | Moderate Allocation |
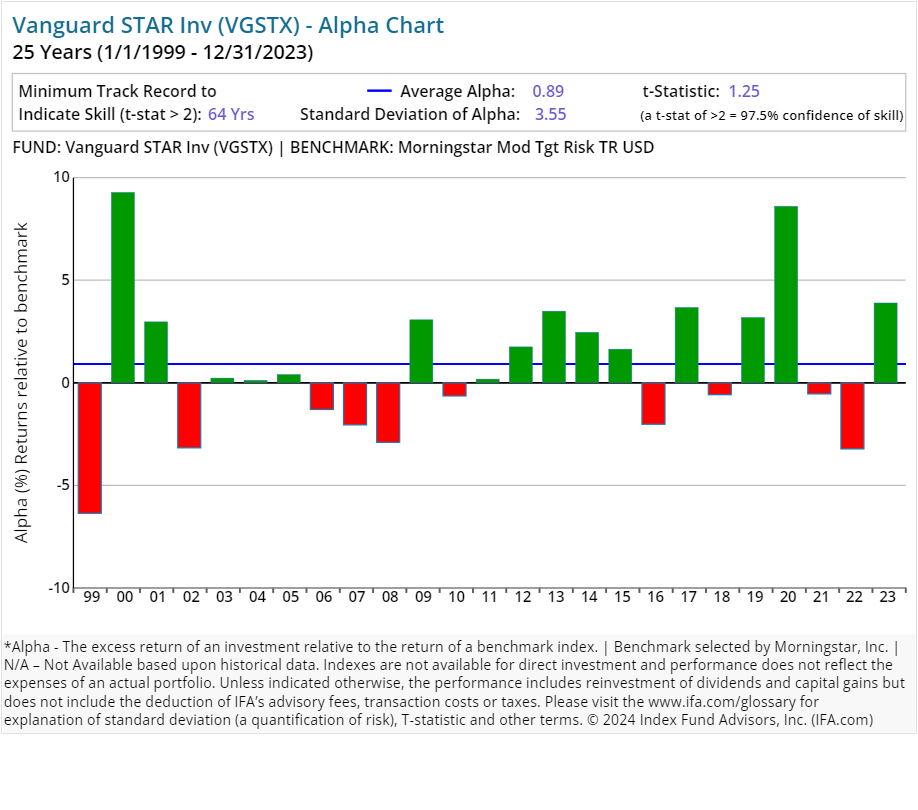
| Vanguard STAR Inv | VGSTX | 6.00 | 0.31 | Allocation | Moderate Allocation |
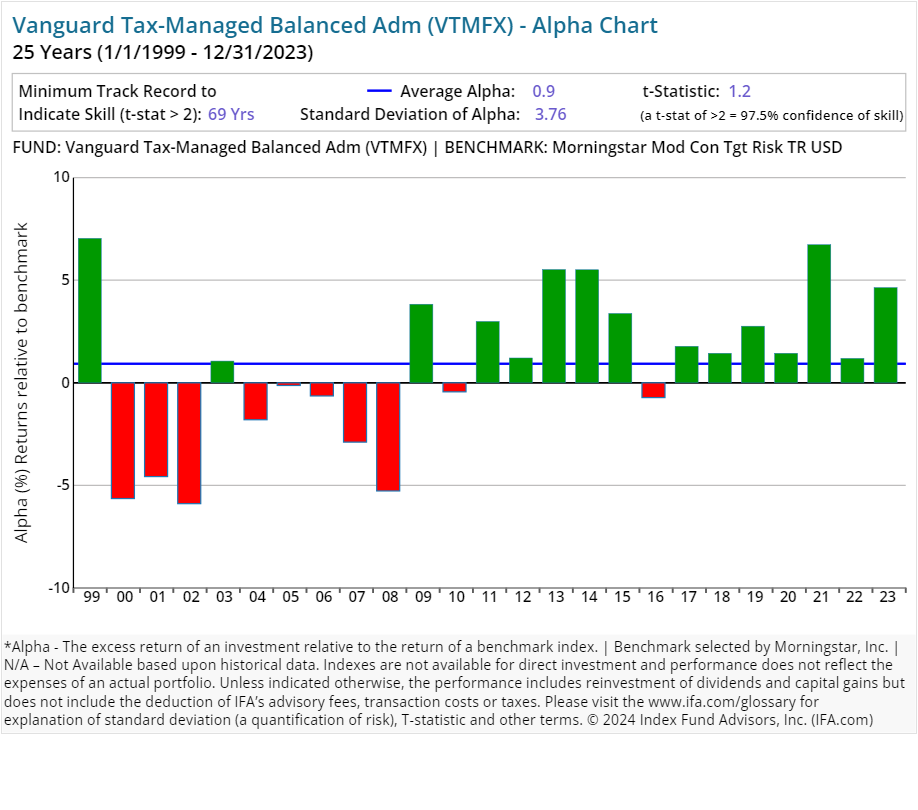
| Vanguard Tax-Managed Balanced Adm | VTMFX | 23.00 | 0.09 | Allocation | Cautious Allocation |
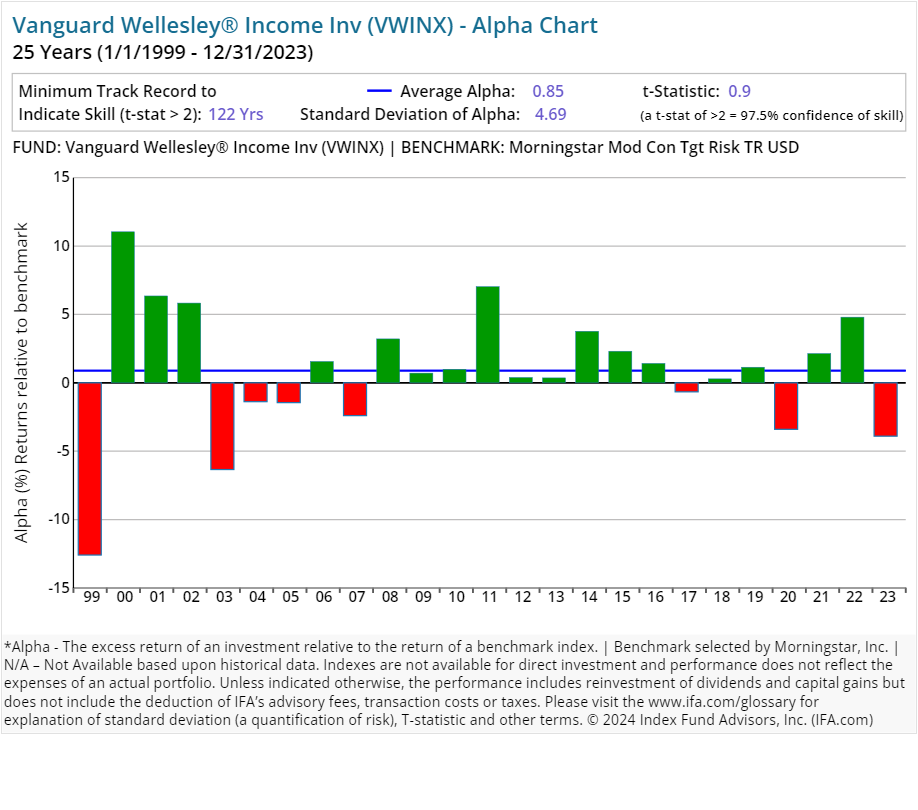
| Vanguard Wellesley® Income Inv | VWINX | 53.00 | 0.23 | Allocation | Cautious Allocation |
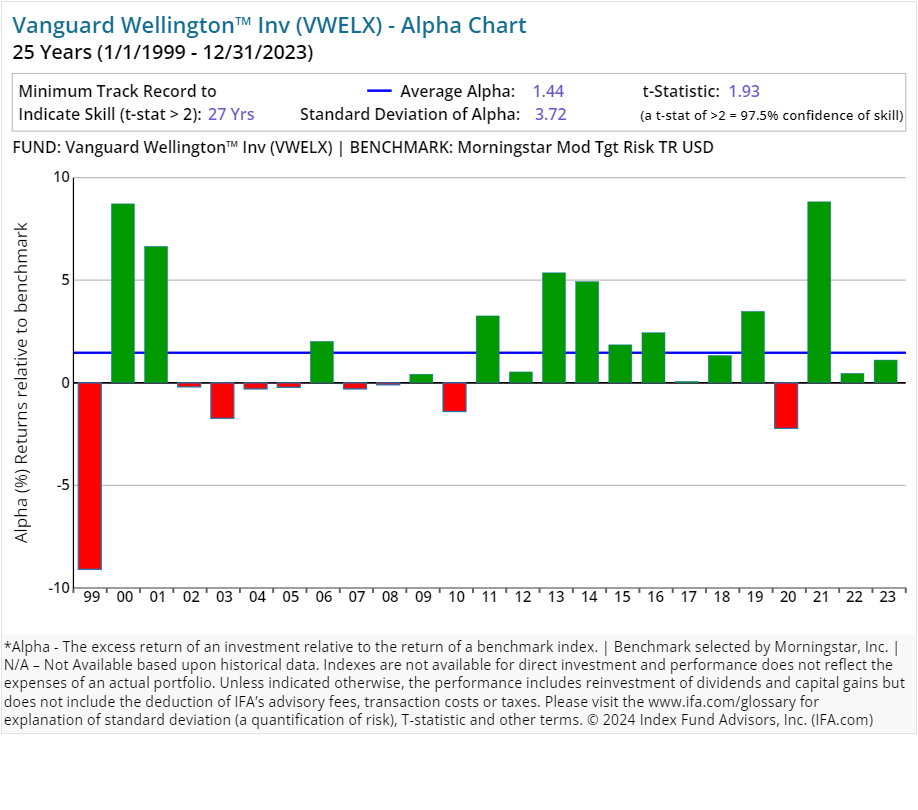
| Vanguard Wellington™ Inv | VWELX | 39.00 | 0.26 | Allocation | Moderate Allocation |
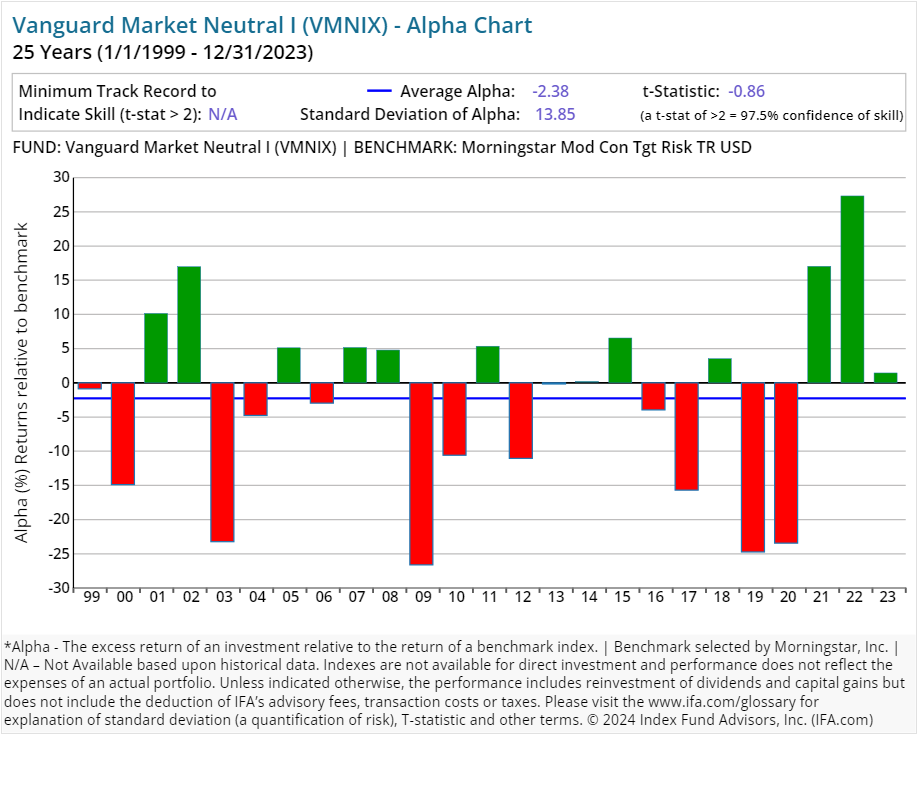
| Vanguard Market Neutral I | VMNIX | 124.00 | 1.74 | Alternative | Market Neutral |
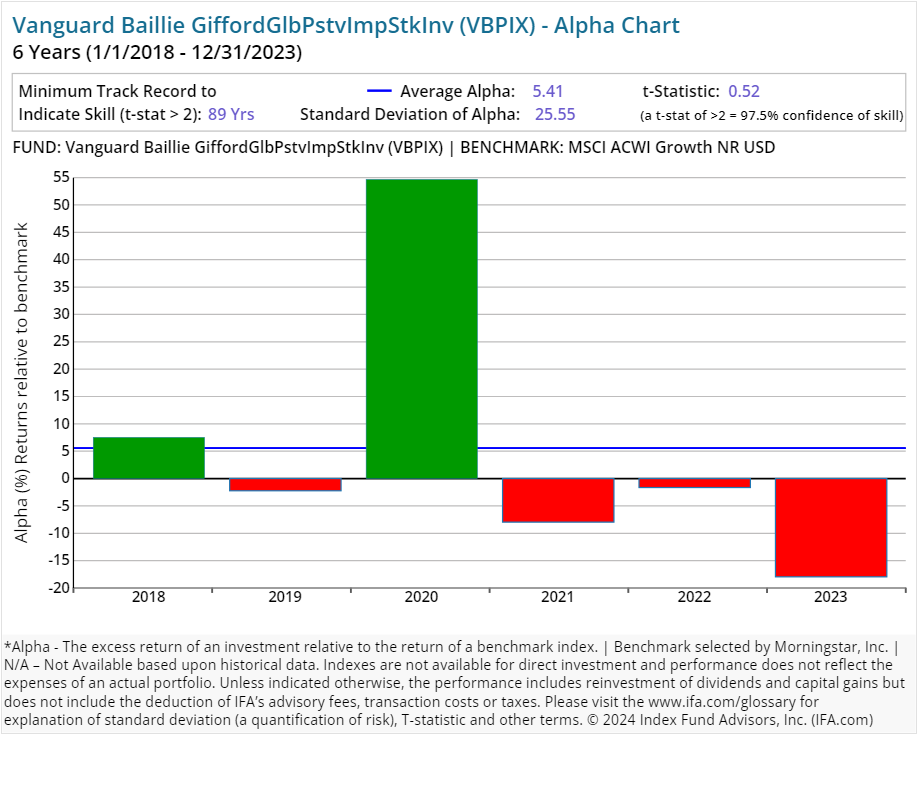
| Vanguard Baillie GiffordGlbPstvImpStkInv | VBPIX | 26.00 | 0.59 | Equity | Global Equity Large Cap |
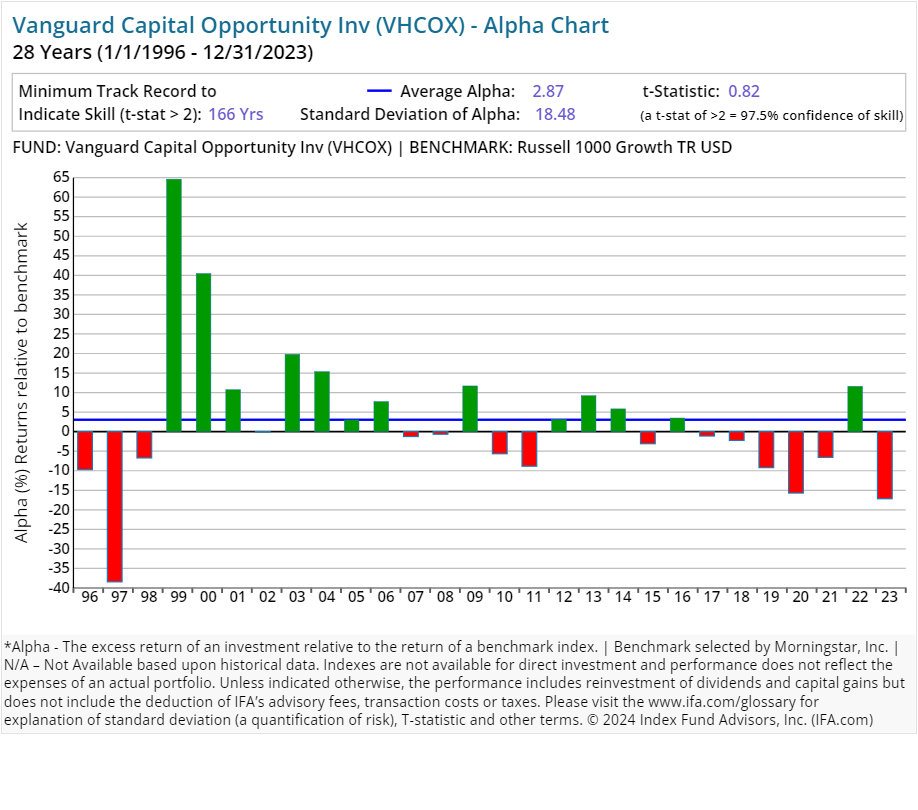
| Vanguard Capital Opportunity Inv | VHCOX | 6.00 | 0.43 | Equity | US Equity Large Cap Growth |
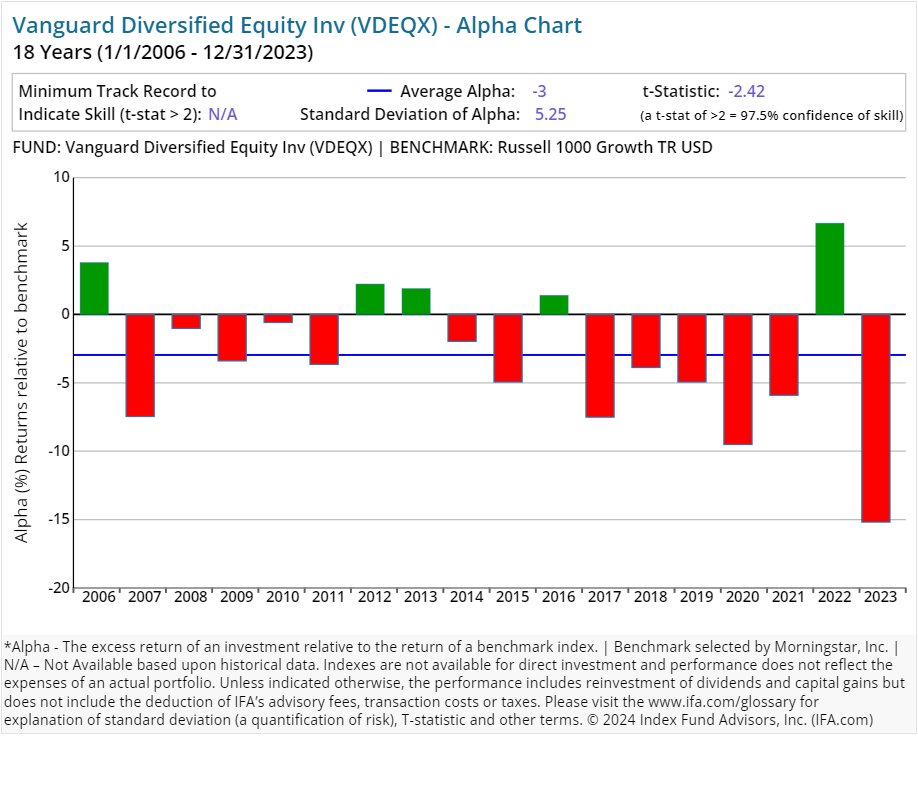
| Vanguard Diversified Equity Inv | VDEQX | 7.00 | 0.35 | Equity | US Equity Large Cap Growth |
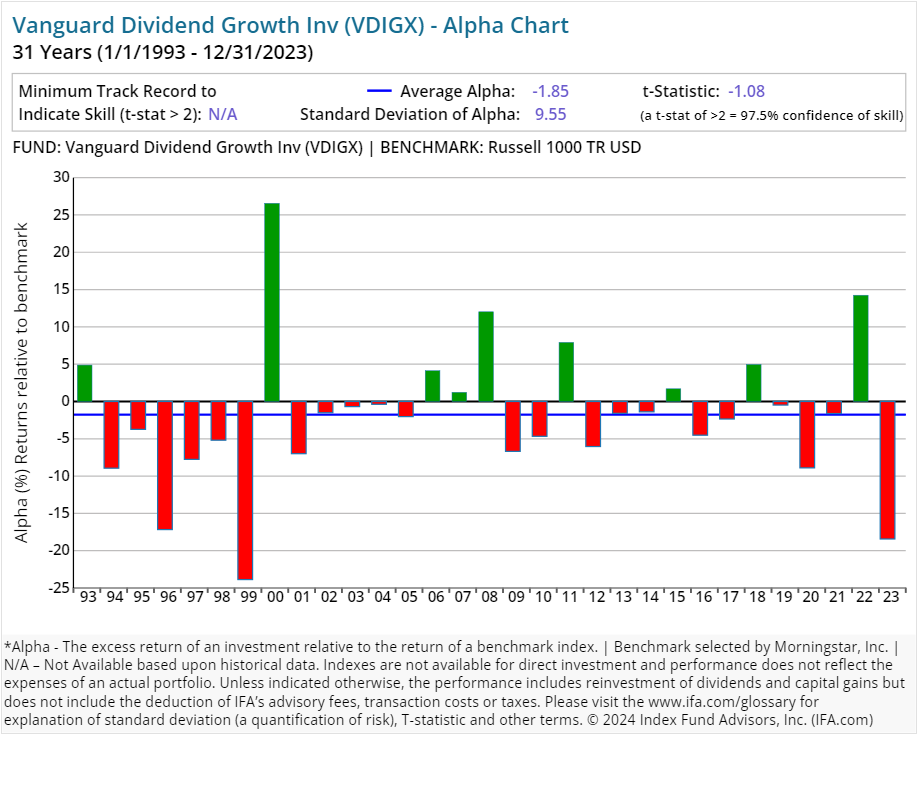
| Vanguard Dividend Growth Inv | VDIGX | 9.00 | 0.30 | Equity | US Equity Large Cap Blend |
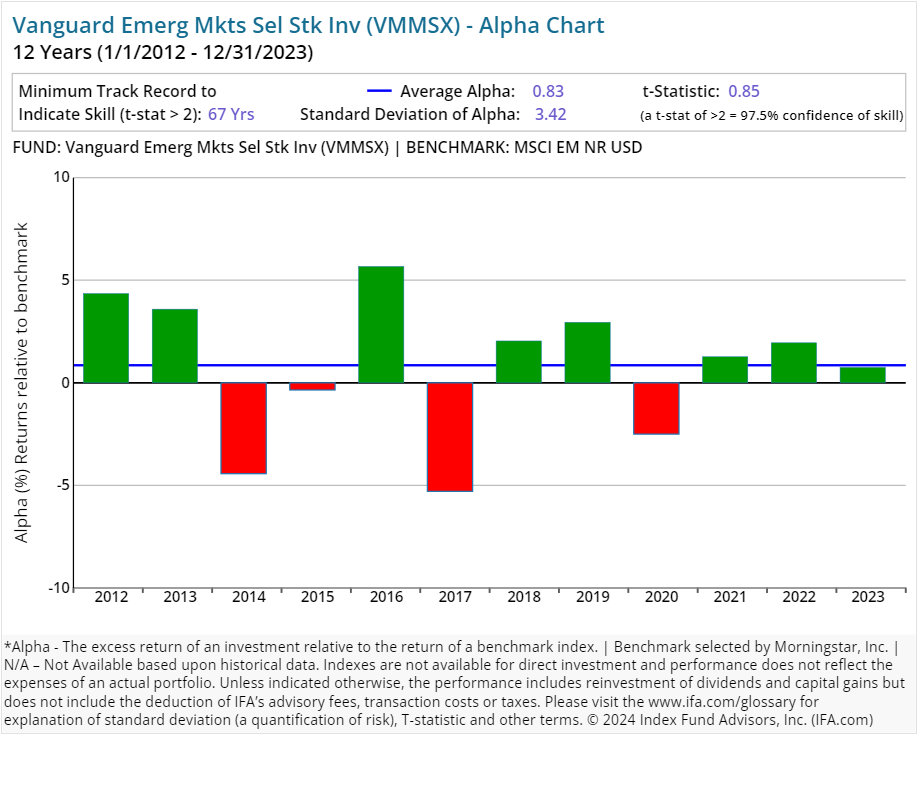
| Vanguard Emerg Mkts Sel Stk Inv | VMMSX | 43.00 | 0.80 | Equity | Global Emerging Markets Equity |
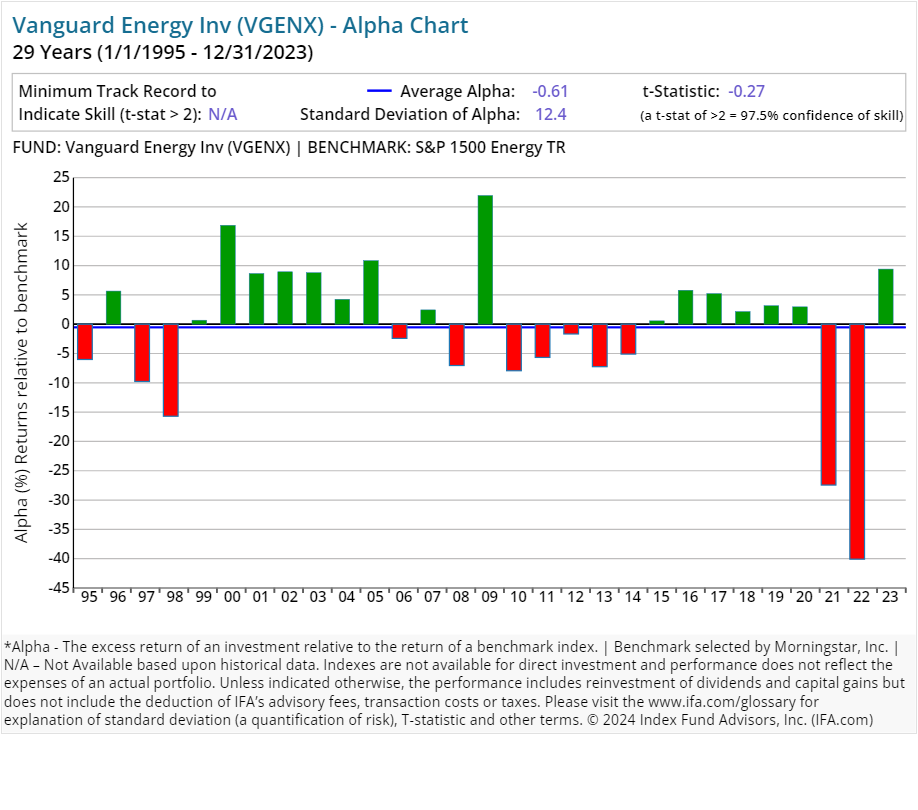
| Vanguard Energy Inv | VGENX | 29.00 | 0.46 | Equity | Energy Sector Equity |
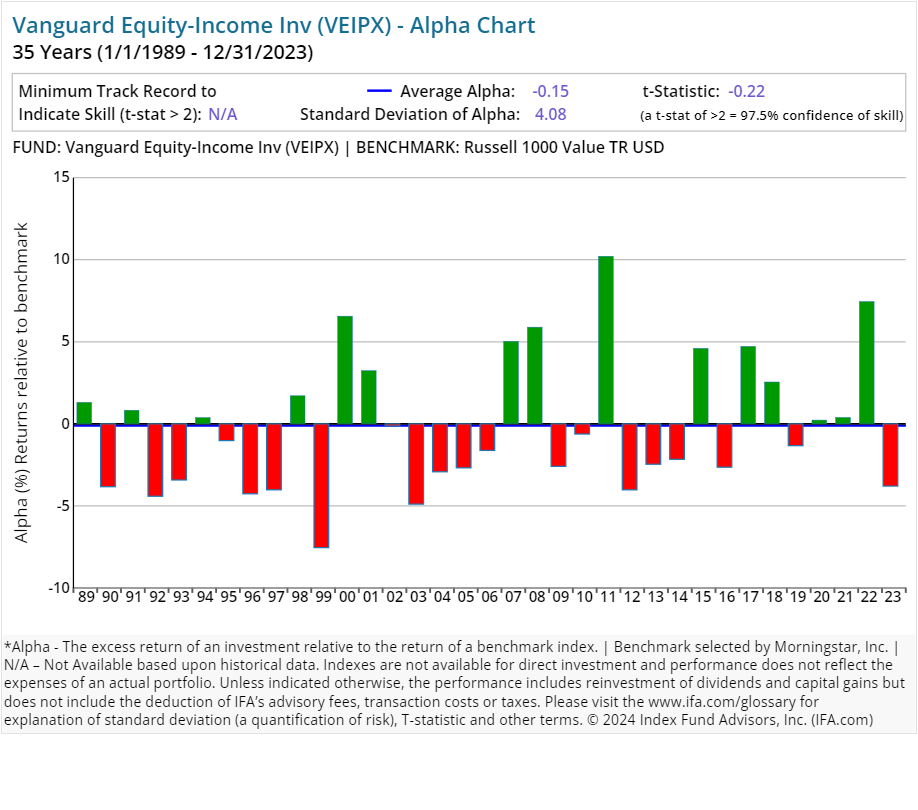
| Vanguard Equity-Income Inv | VEIPX | 48.00 | 0.27 | Equity | US Equity Large Cap Value |
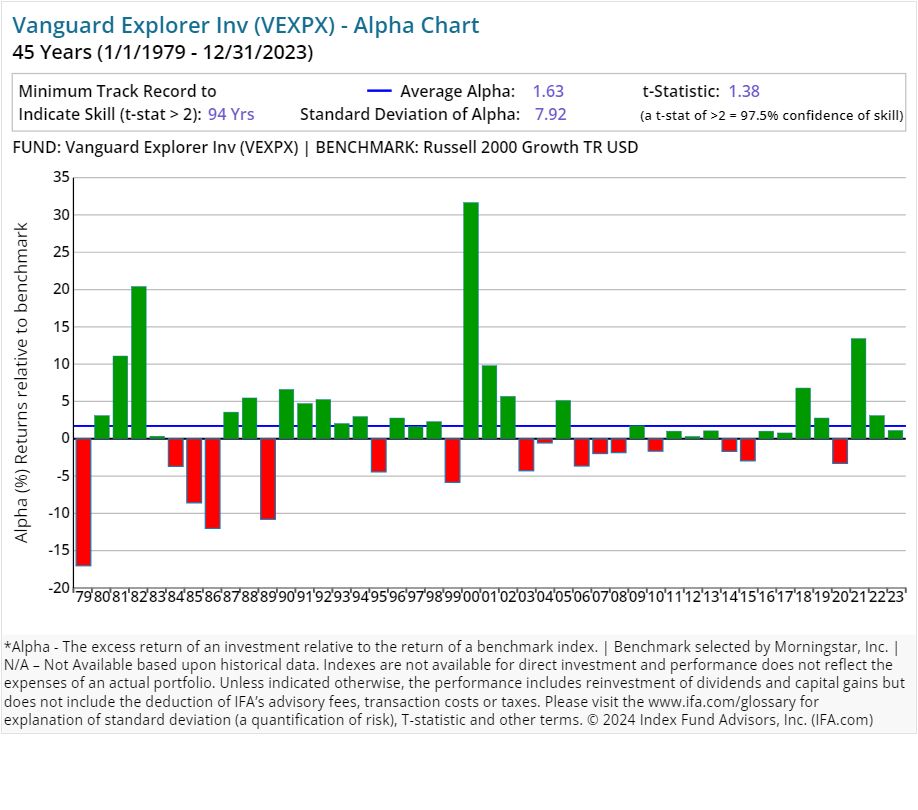
| Vanguard Explorer Inv | VEXPX | 40.00 | 0.45 | Equity | US Equity Small Cap |
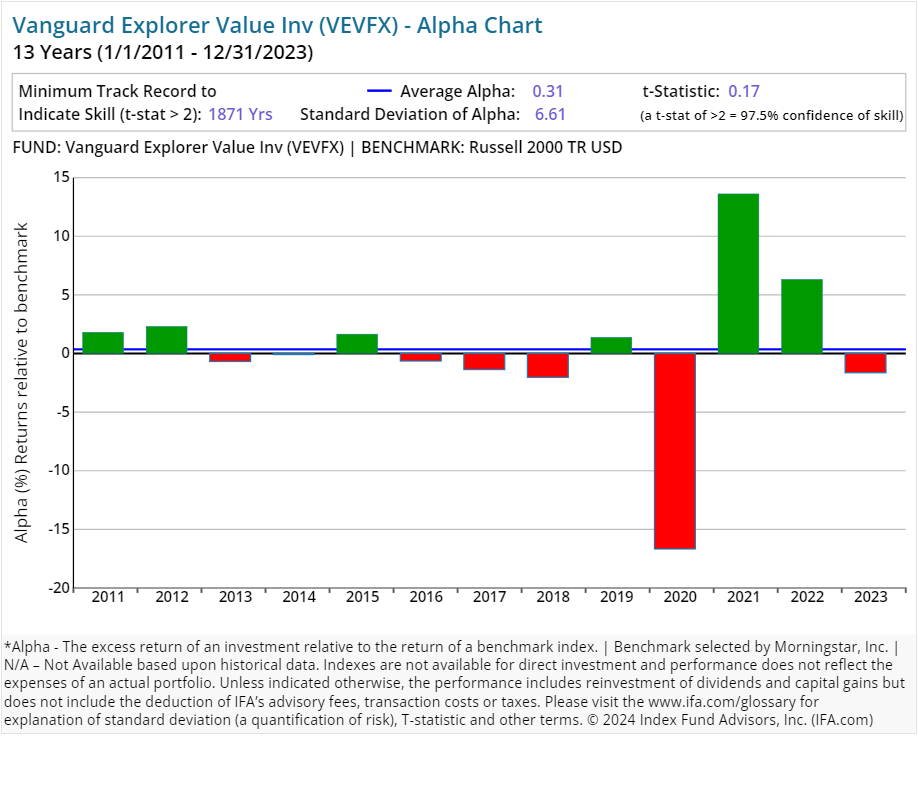
| Vanguard Explorer Value Inv | VEVFX | 23.00 | 0.49 | Equity | US Equity Small Cap |
| Vanguard Global Capital Cycles Investor | VGPMX | 67.00 | 0.43 | Equity | Global Equity Large Cap |
| Vanguard Global Equity Inv | VHGEX | 25.00 | 0.42 | Equity | Global Equity Large Cap |
| Vanguard Global Minimum Volatility Admr | VMNVX | 45.00 | 0.14 | Equity | Global Equity Large Cap |
| Vanguard Growth & Income Inv | VQNPX | 94.00 | 0.32 | Equity | US Equity Large Cap Blend |
| Vanguard Health Care Inv | VGHCX | 16.00 | 0.34 | Equity | Healthcare Sector Equity |
| Vanguard International Explorer Inv | VINEX | 46.00 | 0.52 | Equity | Global Equity Mid/Small Cap |
| Vanguard International Growth Inv | VWIGX | 14.00 | 0.42 | Equity | Global Equity Large Cap |
| Vanguard International Value Inv | VTRIX | 29.00 | 0.39 | Equity | Global Equity Large Cap |
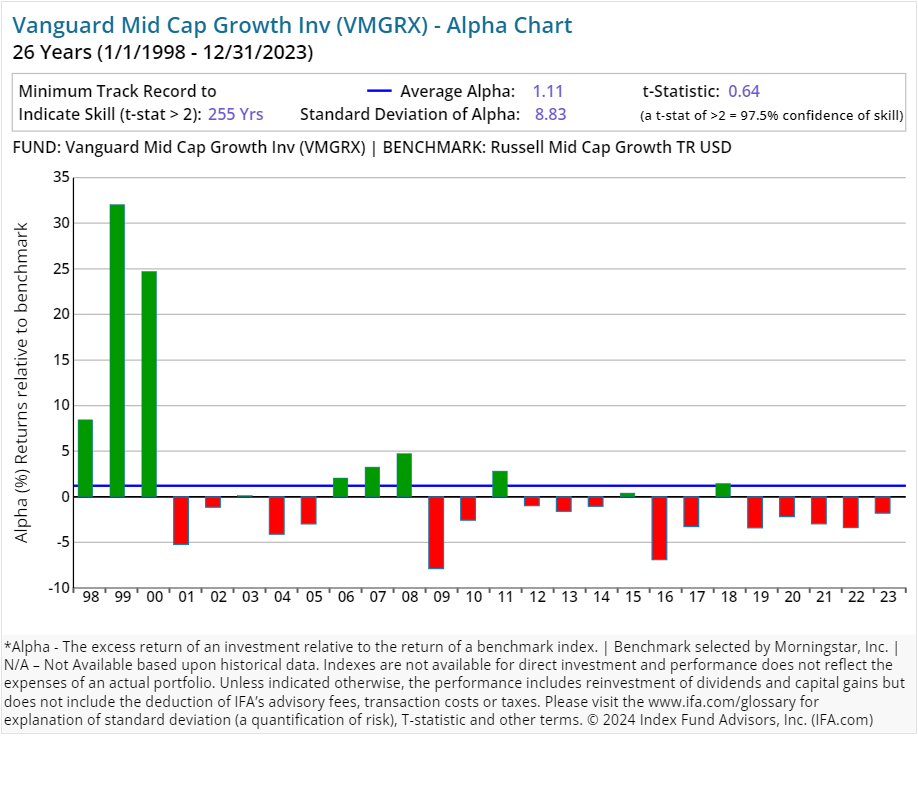
| Vanguard Mid Cap Growth Inv | VMGRX | 87.00 | 0.37 | Equity | US Equity Mid Cap |
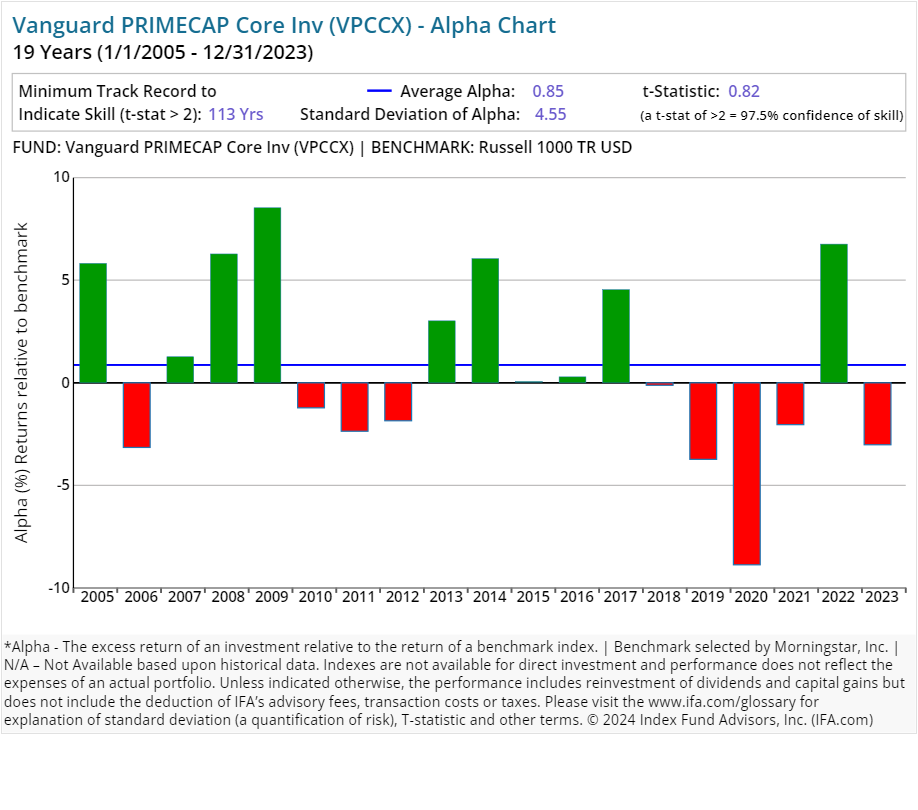
| Vanguard PRIMECAP Core Inv | VPCCX | 6.00 | 0.46 | Equity | US Equity Large Cap Blend |
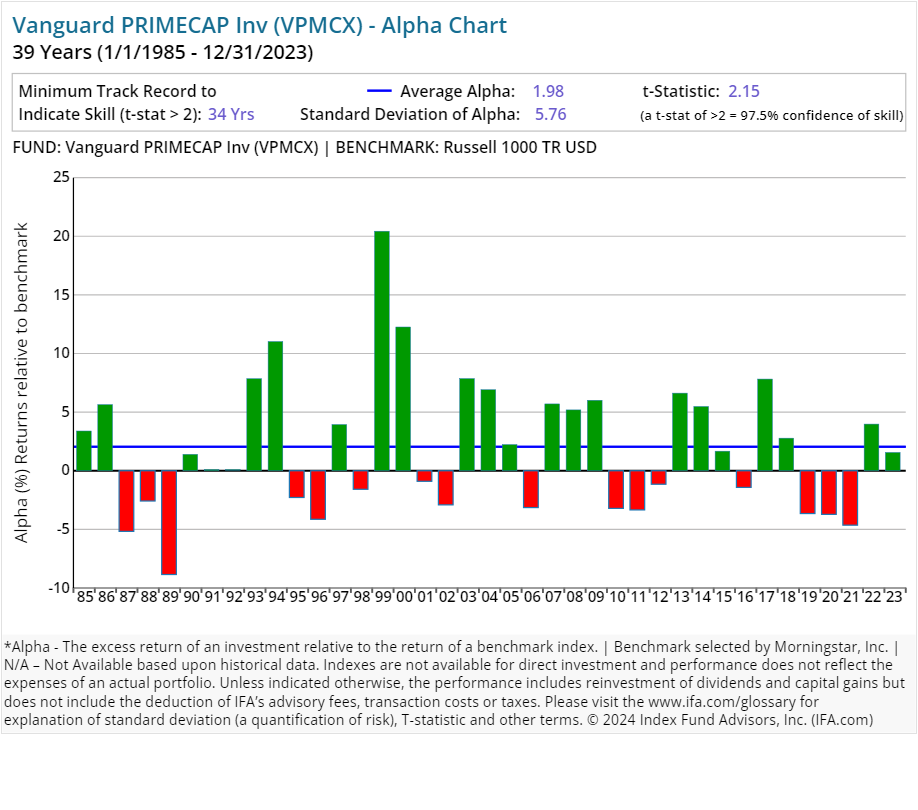
| Vanguard PRIMECAP Inv | VPMCX | 4.00 | 0.38 | Equity | US Equity Large Cap Blend |
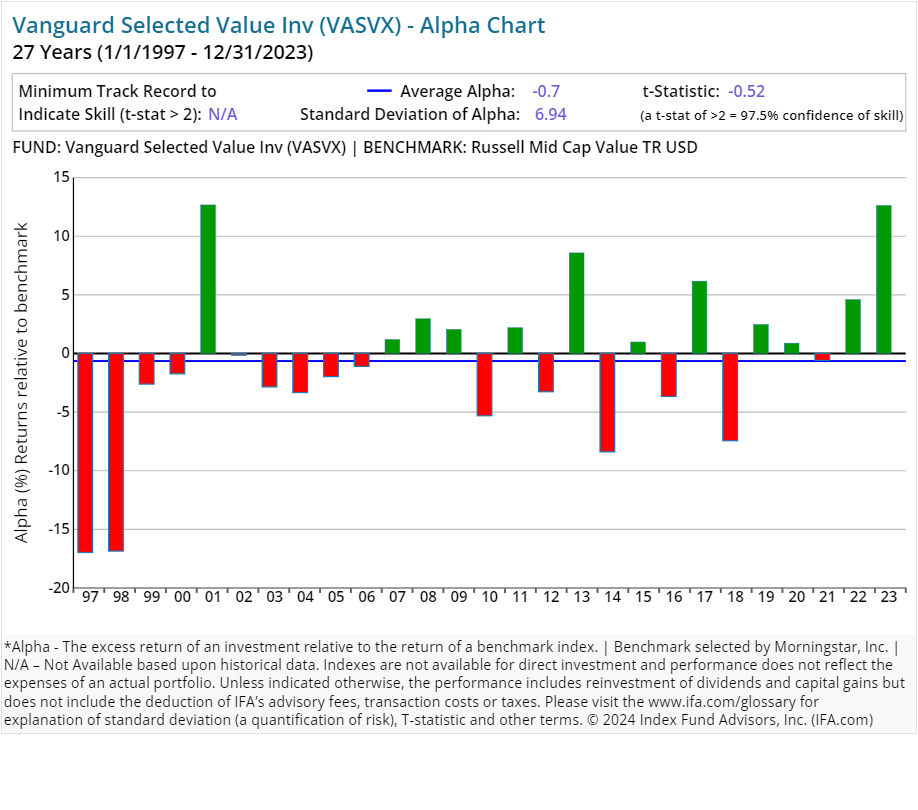
| Vanguard Selected Value Inv | VASVX | 27.00 | 0.43 | Equity | US Equity Mid Cap |
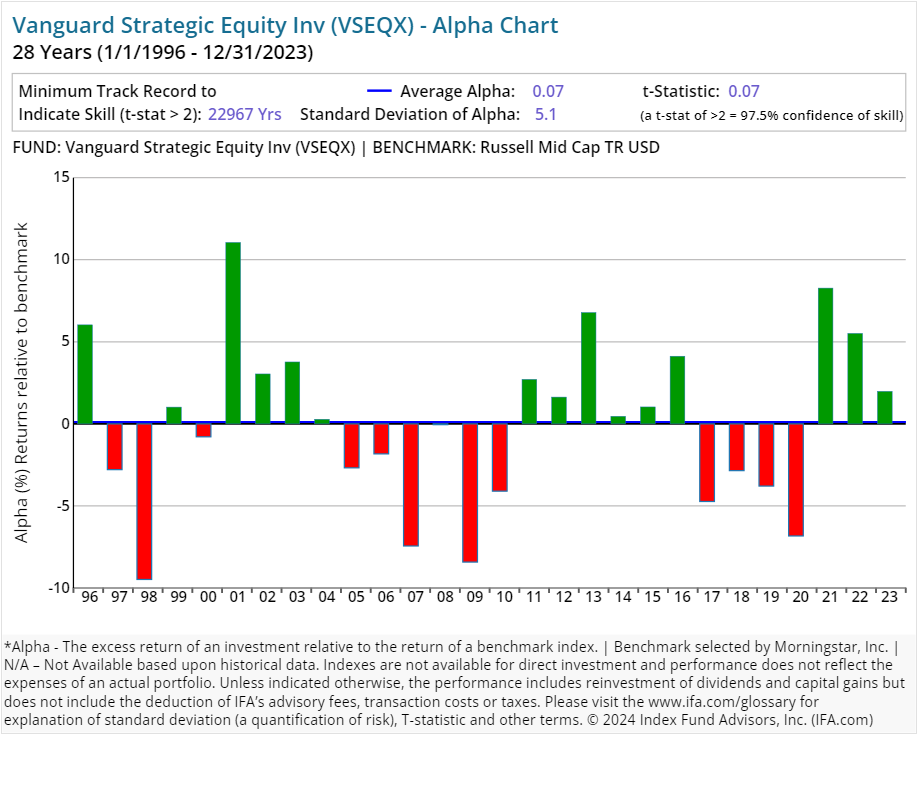
| Vanguard Strategic Equity Inv | VSEQX | 64.00 | 0.17 | Equity | US Equity Mid Cap |
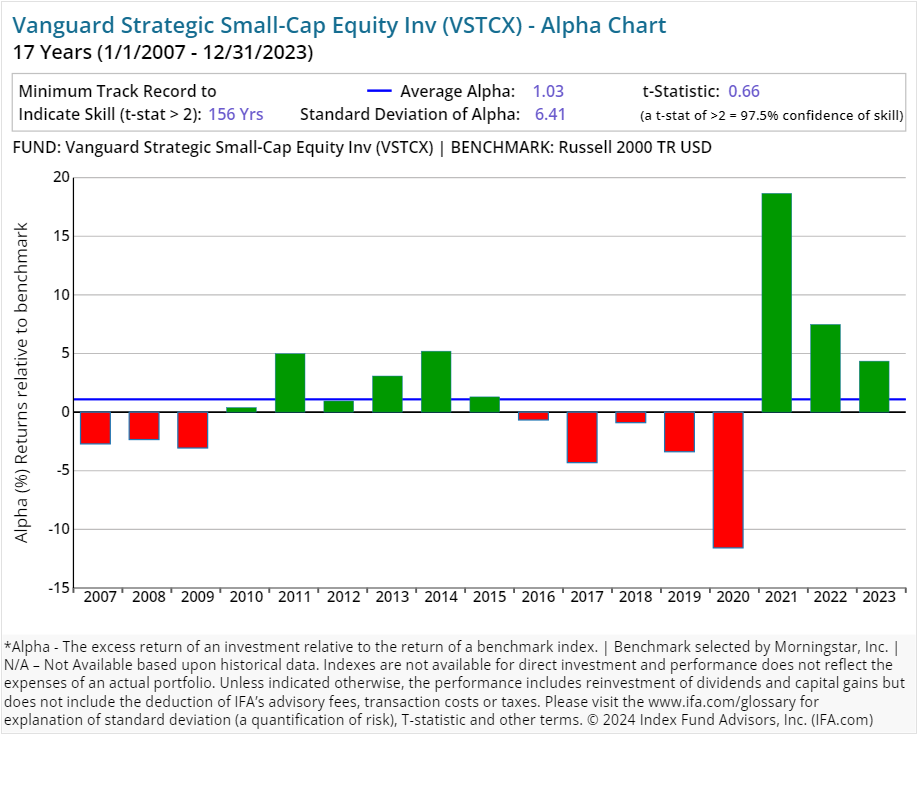
| Vanguard Strategic Small-Cap Equity Inv | VSTCX | 69.00 | 0.26 | Equity | US Equity Small Cap |
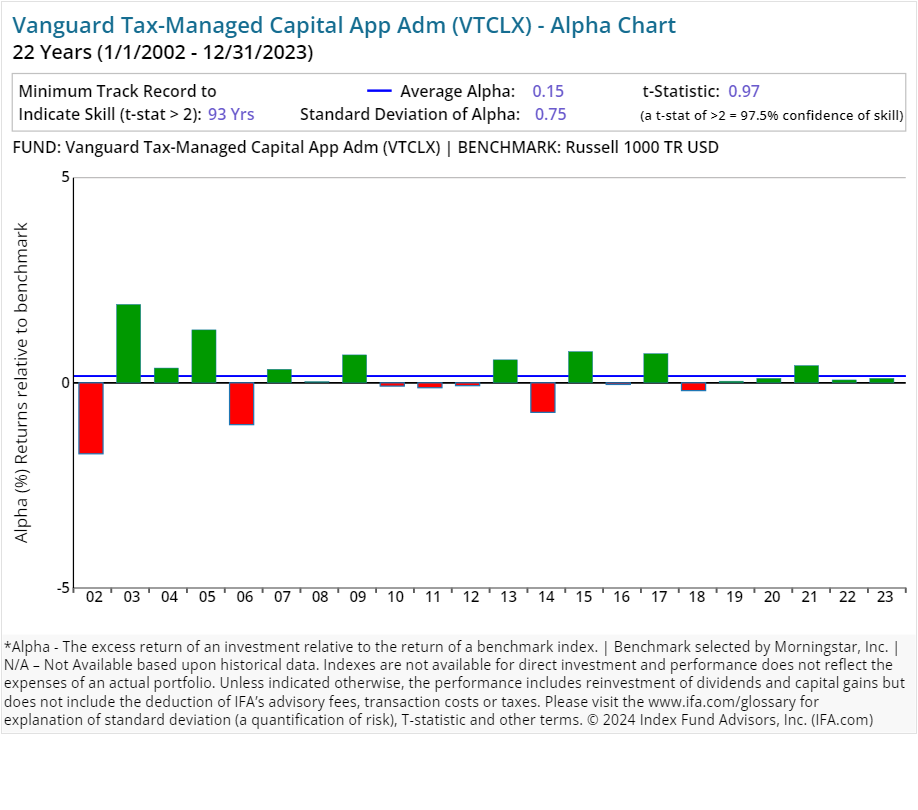
| Vanguard Tax-Managed Capital App Adm | VTCLX | 2.00 | 0.09 | Equity | US Equity Large Cap Blend |
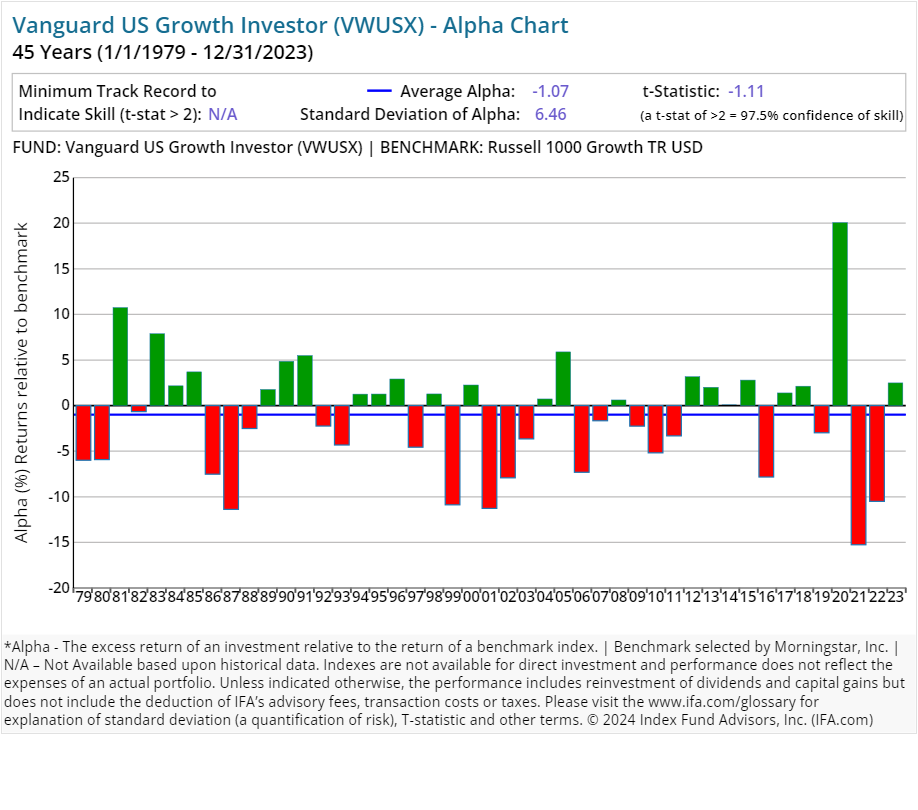
| Vanguard US Growth Investor | VWUSX | 37.00 | 0.30 | Equity | US Equity Large Cap Growth |
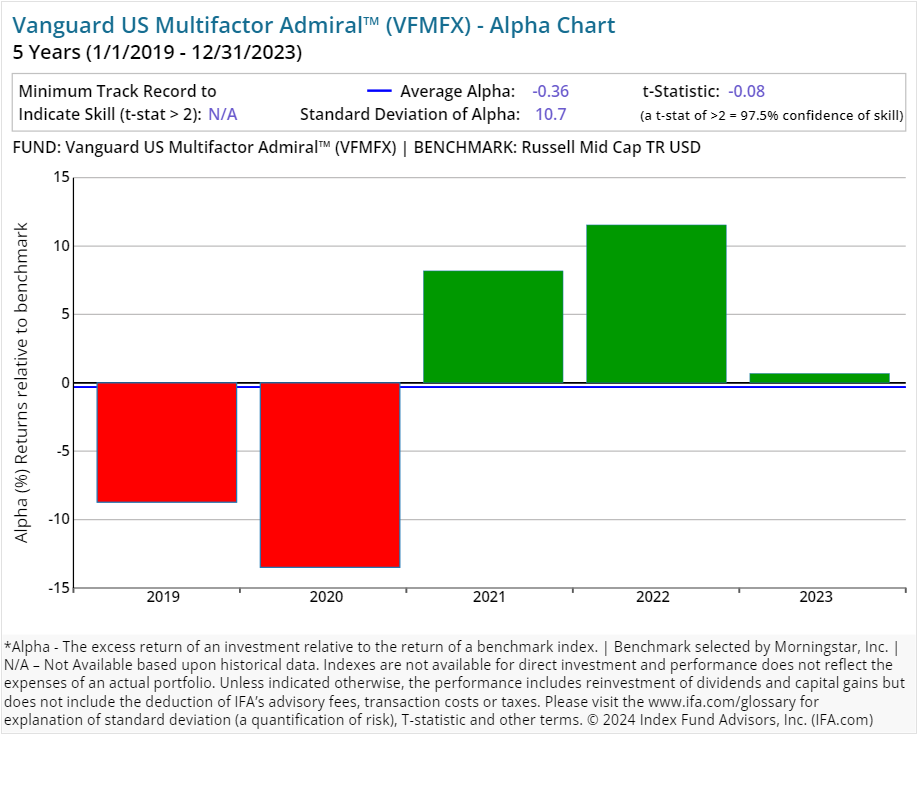
| Vanguard US Multifactor Admiral™ | VFMFX | 50.00 | 0.18 | Equity | US Equity Mid Cap |
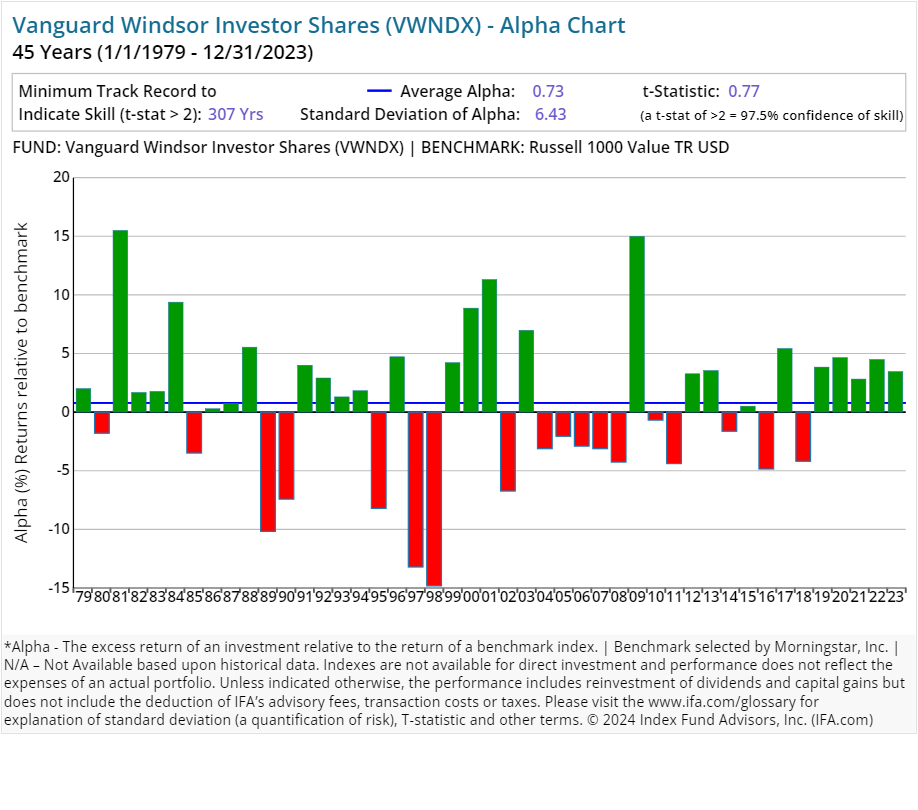
| Vanguard Windsor Investor Shares | VWNDX | 42.00 | 0.42 | Equity | US Equity Large Cap Value |
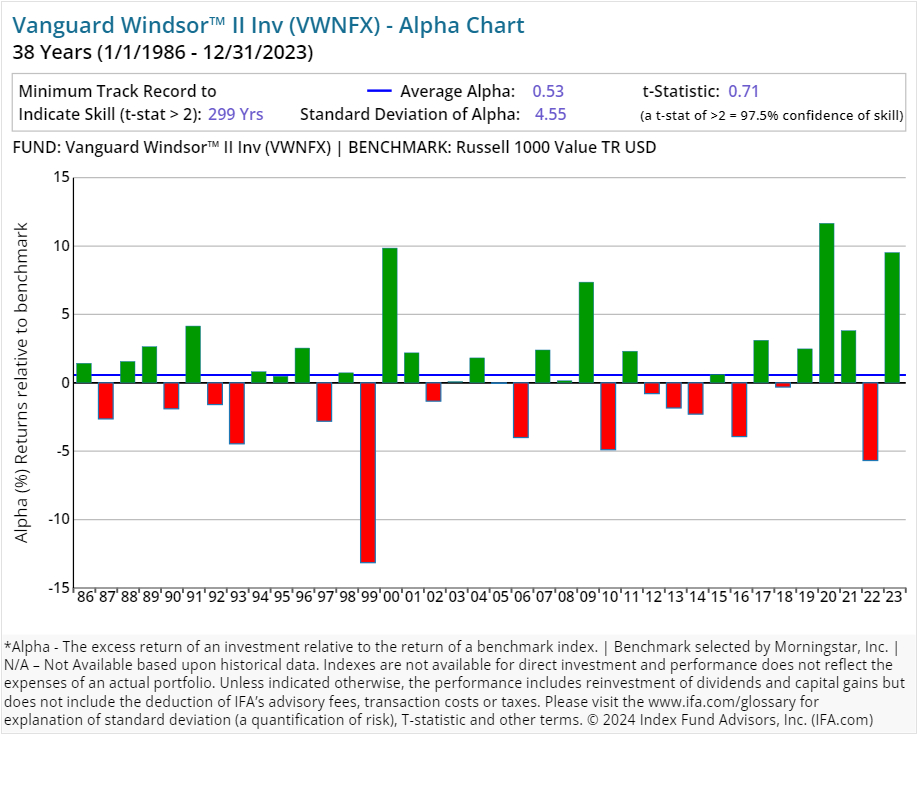
| Vanguard Windsor™ II Inv | VWNFX | 17.00 | 0.34 | Equity | US Equity Large Cap Value |
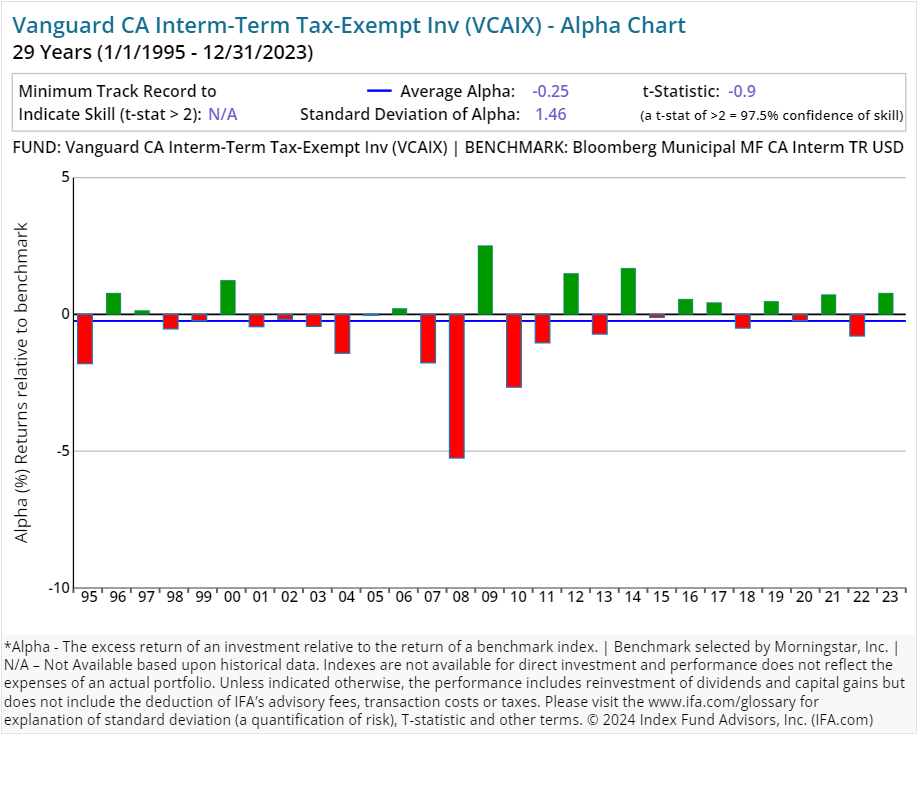
| Vanguard CA Interm-Term Tax-Exempt Inv | VCAIX | 46.00 | 0.17 | Fixed Income | US Municipal Fixed Income |
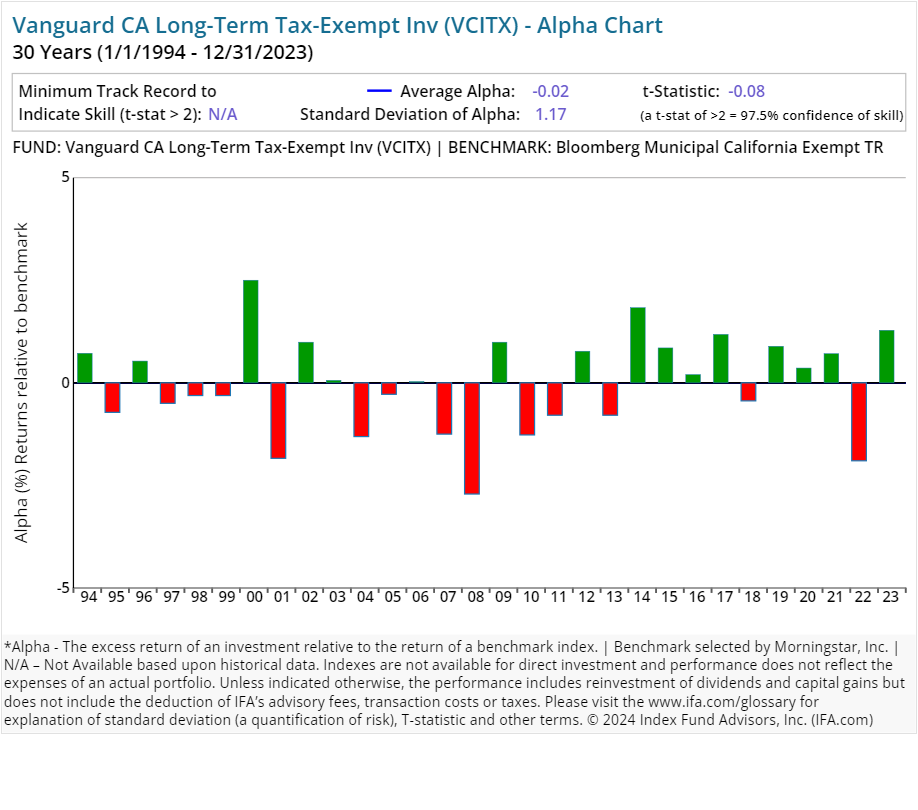
| Vanguard CA Long-Term Tax-Exempt Inv | VCITX | 76.00 | 0.17 | Fixed Income | US Municipal Fixed Income |
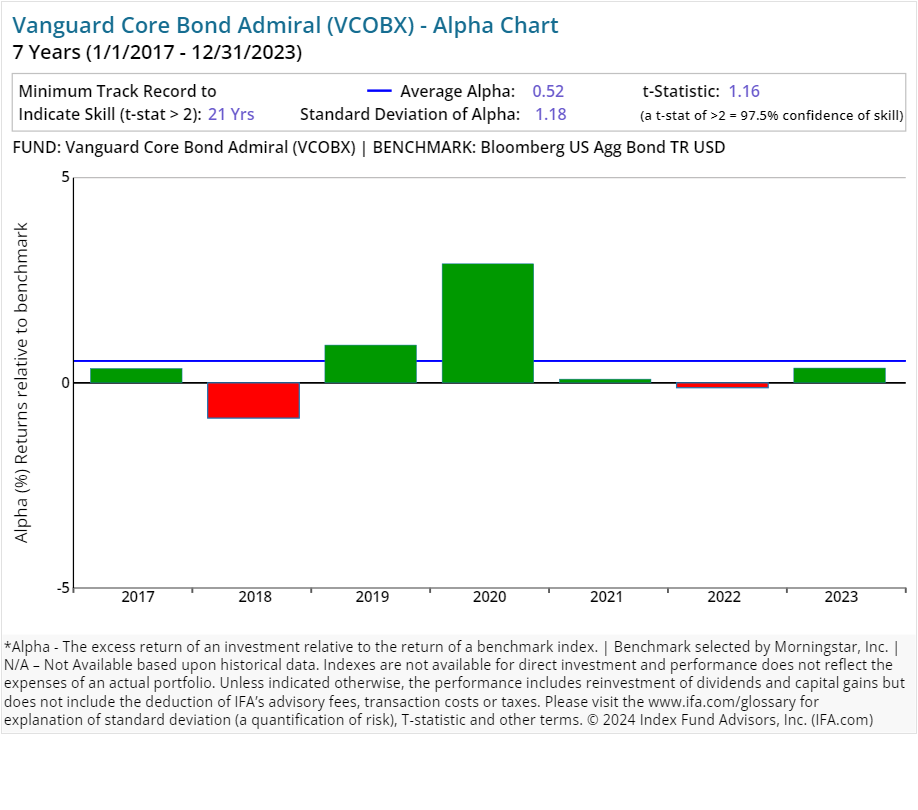
| Vanguard Core Bond Admiral | VCOBX | 439.00 | 0.10 | Fixed Income | US Fixed Income |
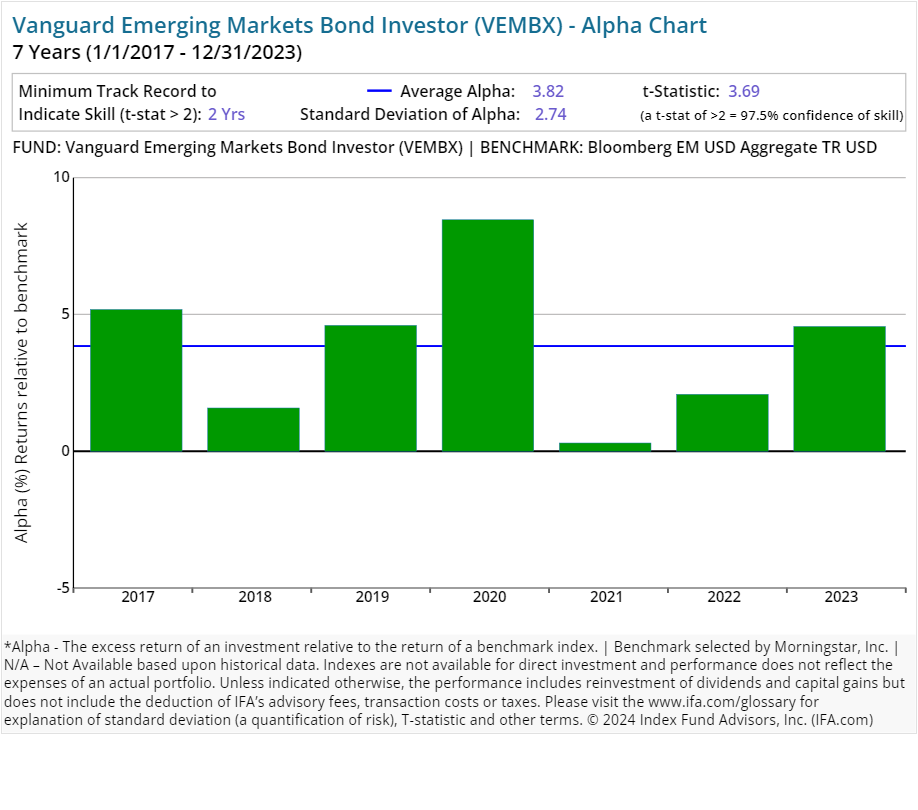
| Vanguard Emerging Markets Bond Investor | VEMBX | 121.00 | 0.55 | Fixed Income | Emerging Markets Fixed Income |
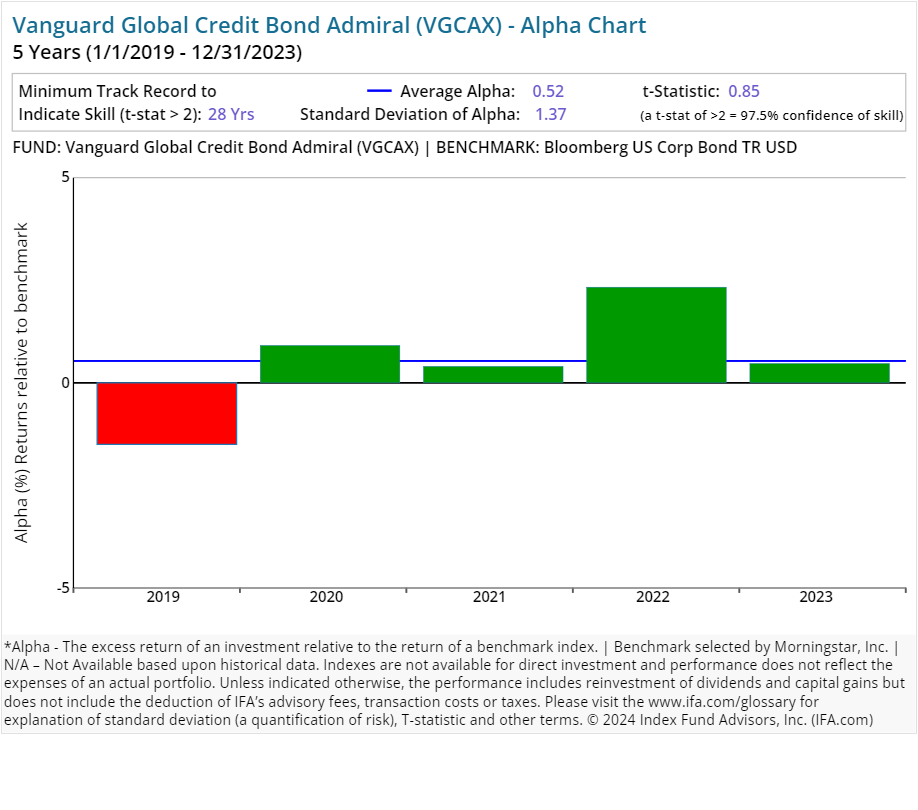
| Vanguard Global Credit Bond Admiral | VGCAX | 178.00 | 0.25 | Fixed Income | US Fixed Income |
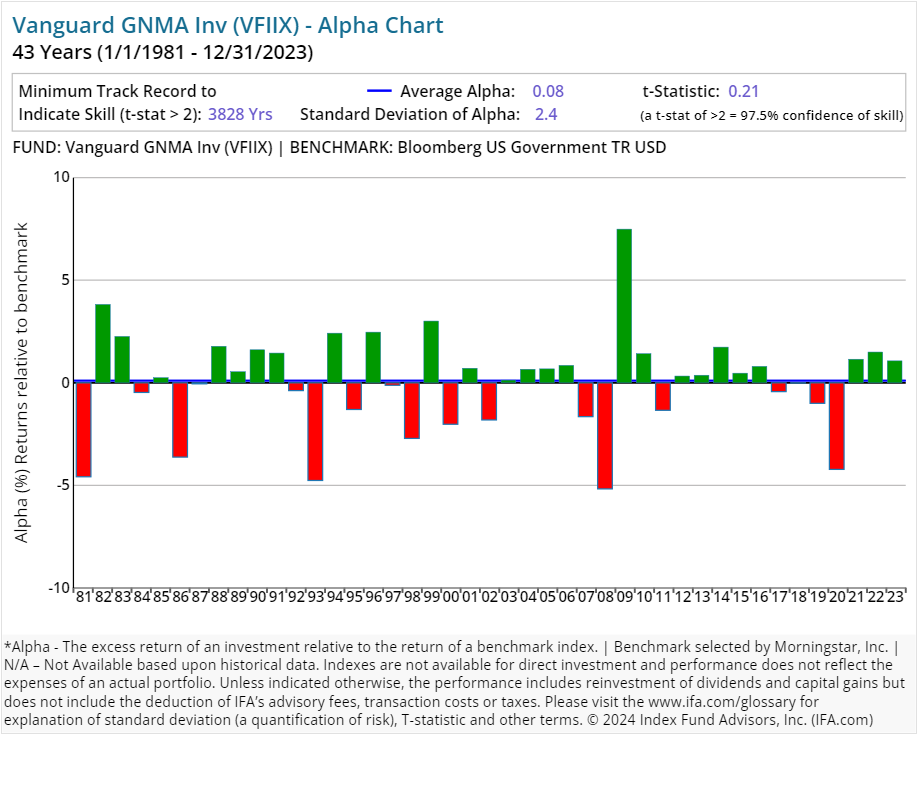
| Vanguard GNMA Inv | VFIIX | 305.00 | 0.21 | Fixed Income | US Fixed Income |
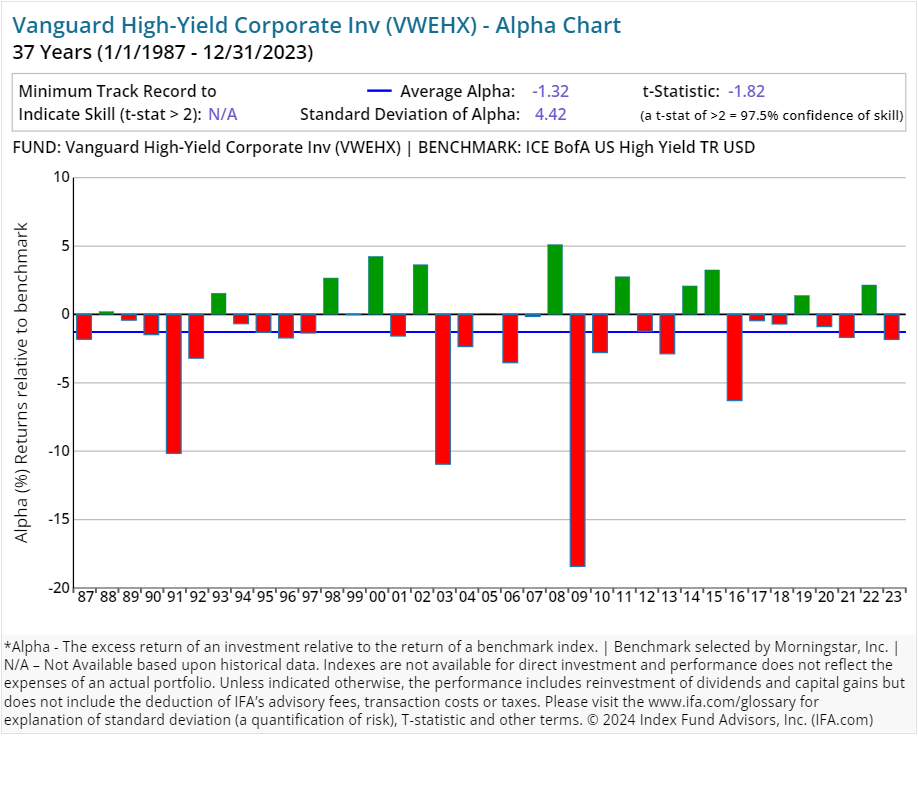
| Vanguard High-Yield Corporate Inv | VWEHX | 36.00 | 0.23 | Fixed Income | US Fixed Income |
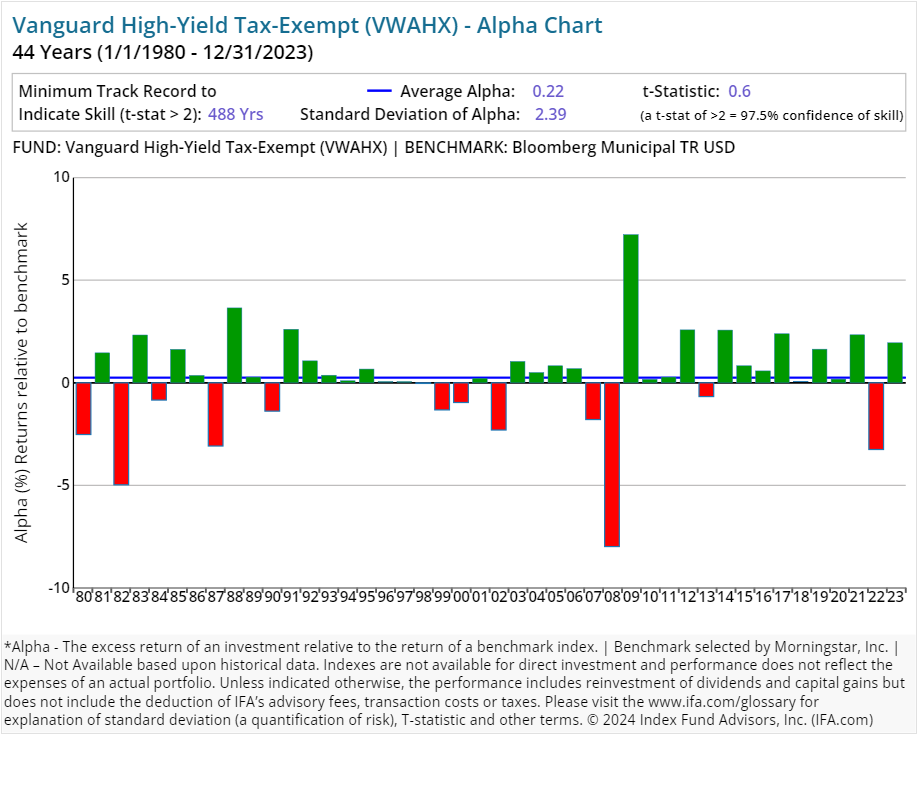
| Vanguard High-Yield Tax-Exempt | VWAHX | 35.00 | 0.17 | Fixed Income | US Municipal Fixed Income |
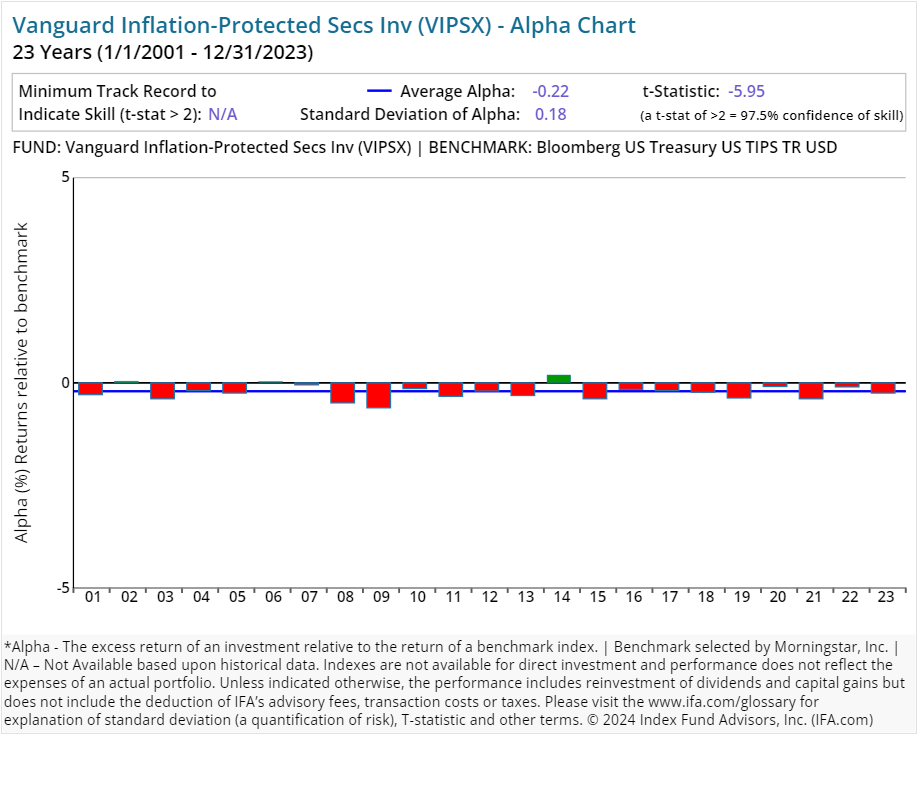
| Vanguard Inflation-Protected Secs Inv | VIPSX | 34.00 | 0.20 | Fixed Income | US Fixed Income |
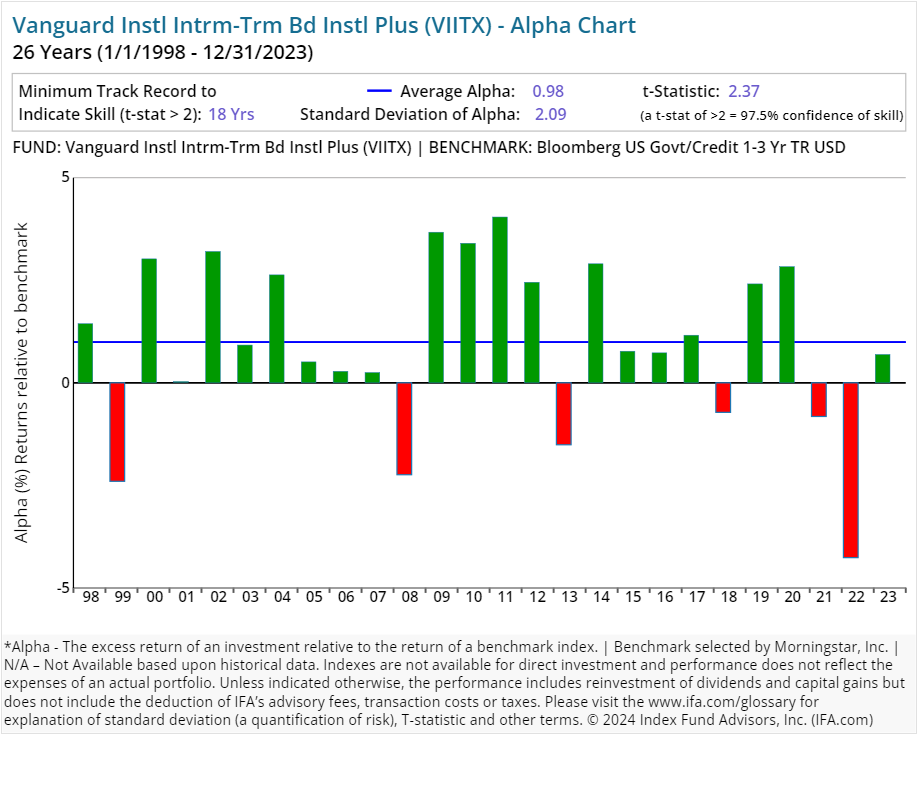
| Vanguard Instl Intrm-Trm Bd Instl Plus | VIITX | 395.00 | 0.02 | Fixed Income | US Fixed Income |
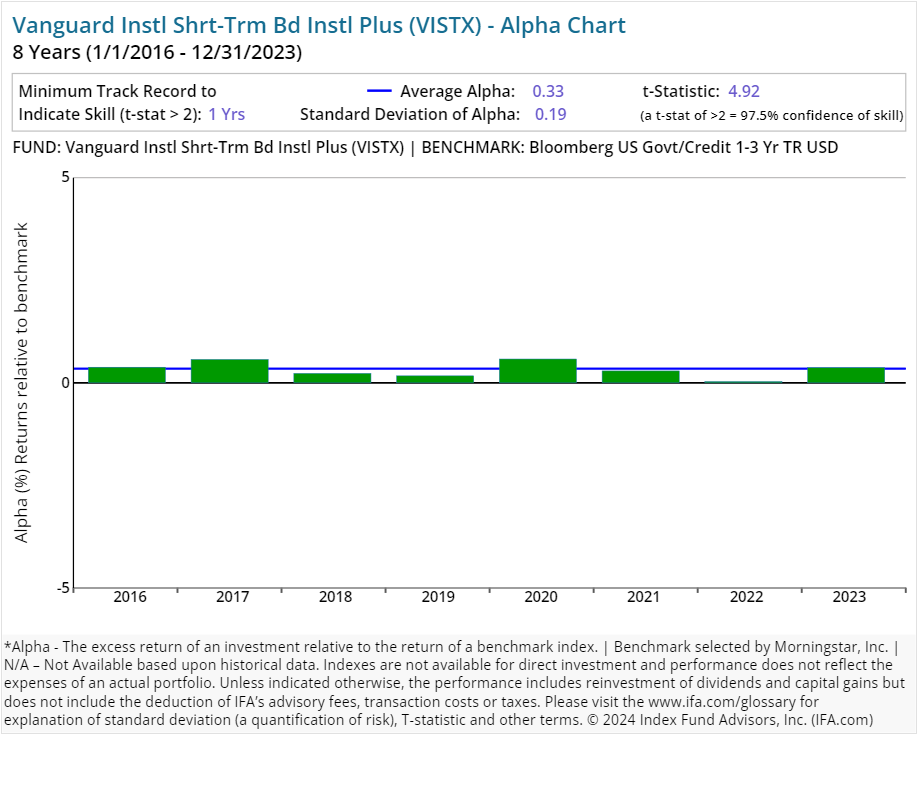
| Vanguard Instl Shrt-Trm Bd Instl Plus | VISTX | 135.00 | 0.02 | Fixed Income | US Fixed Income |
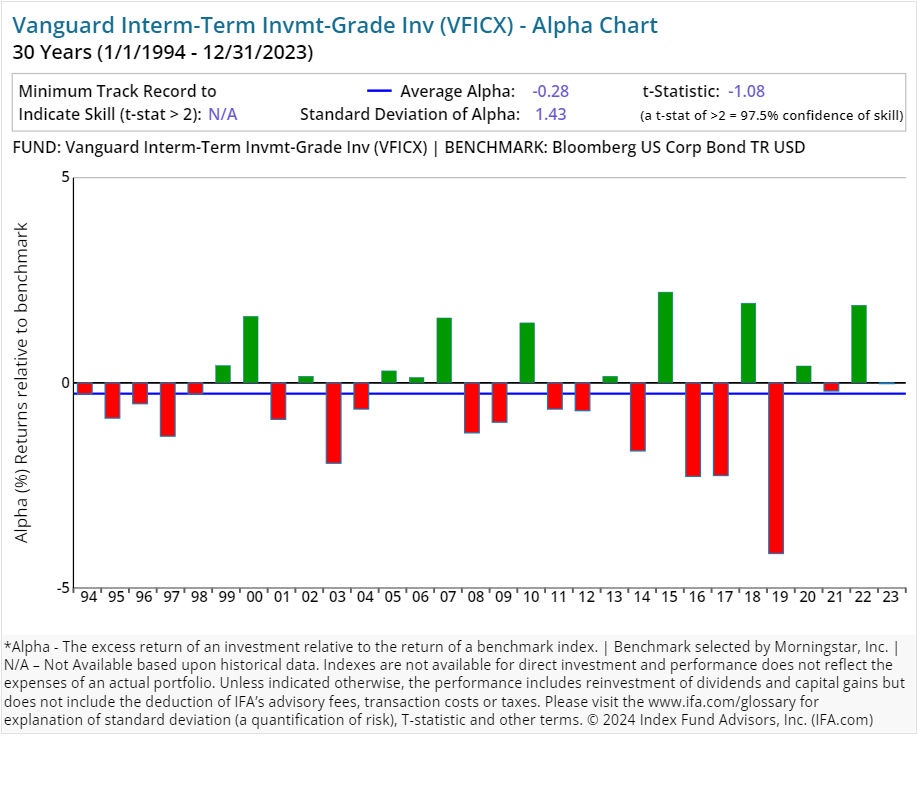
| Vanguard Interm-Term Invmt-Grade Inv | VFICX | 73.00 | 0.20 | Fixed Income | US Fixed Income |
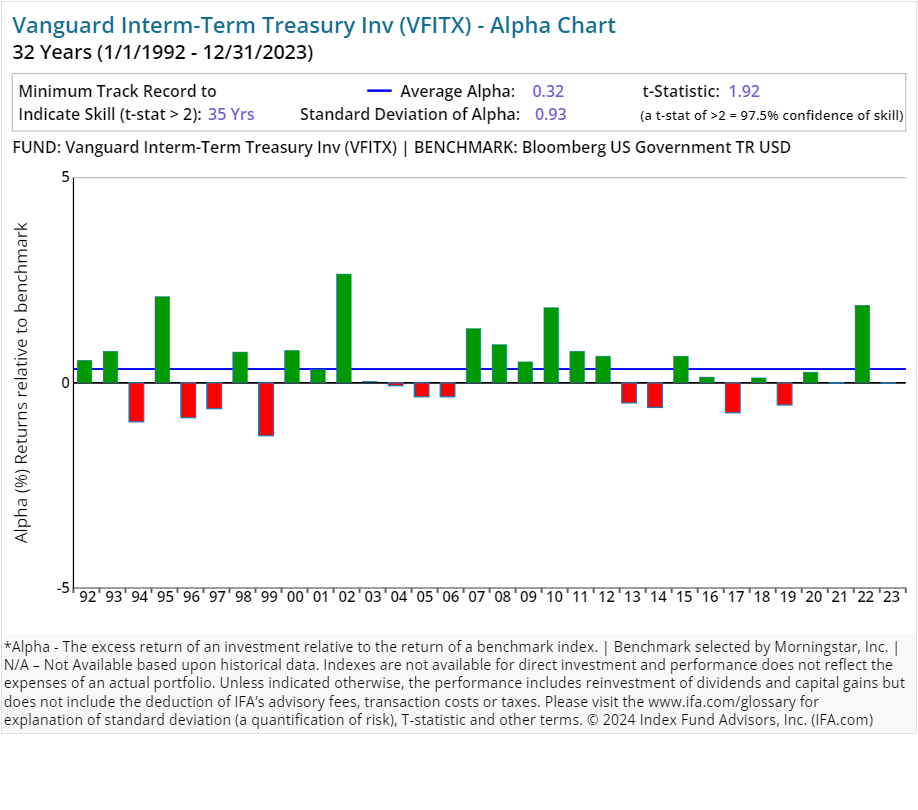
| Vanguard Interm-Term Treasury Inv | VFITX | 217.00 | 0.20 | Fixed Income | US Fixed Income |
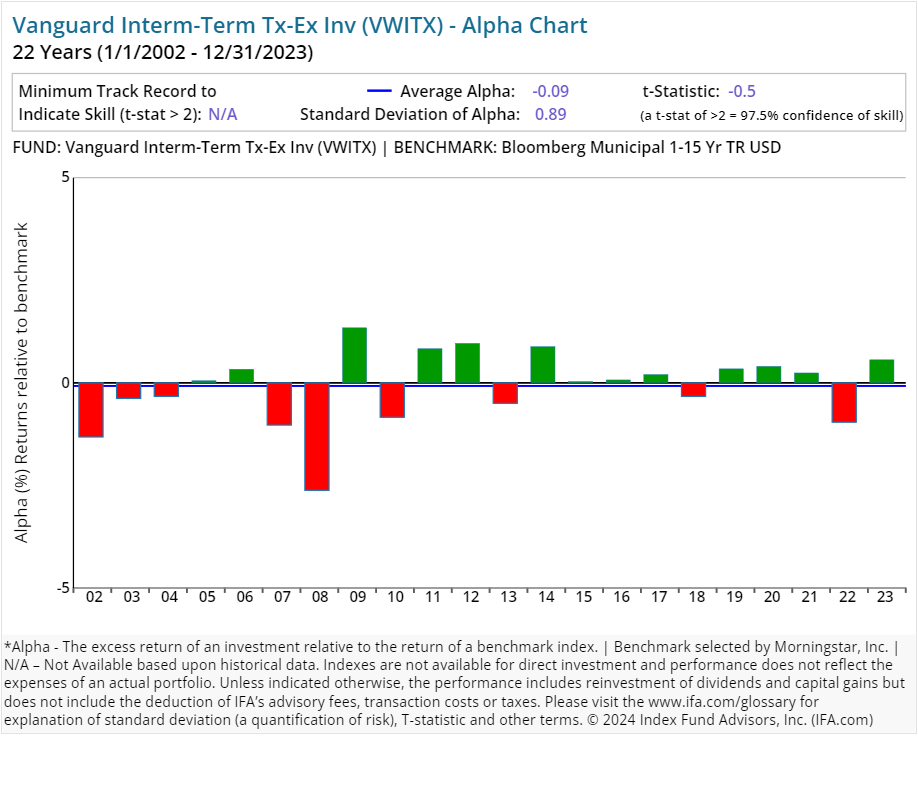
| Vanguard Interm-Term Tx-Ex Inv | VWITX | 43.00 | 0.17 | Fixed Income | US Municipal Fixed Income |
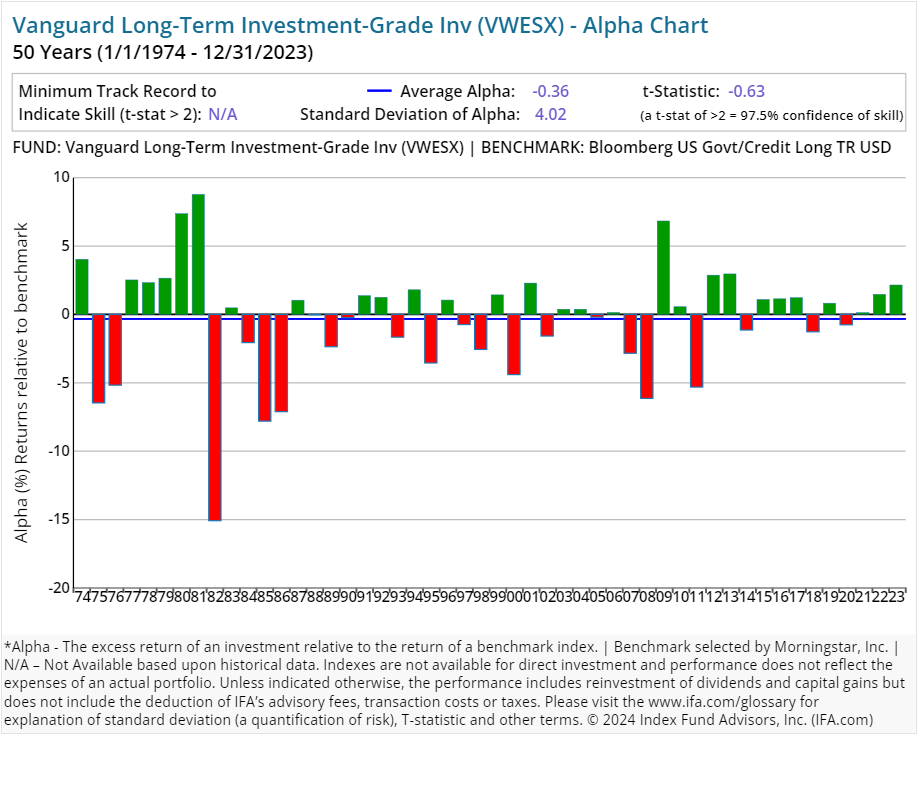
| Vanguard Long-Term Investment-Grade Inv | VWESX | 38.00 | 0.21 | Fixed Income | US Fixed Income |
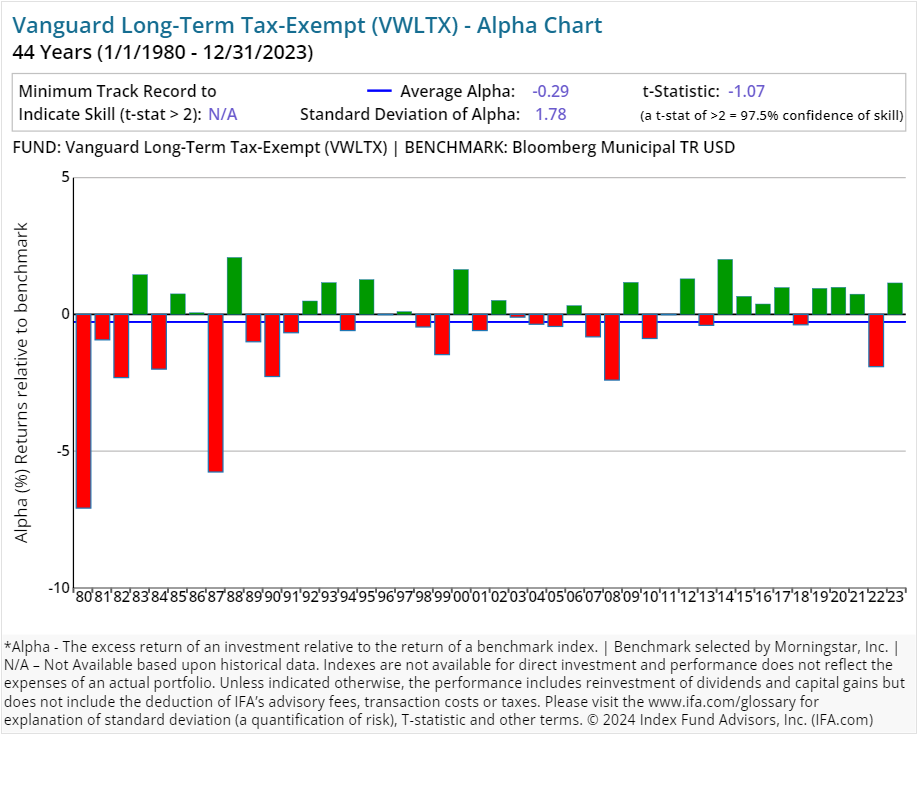
| Vanguard Long-Term Tax-Exempt | VWLTX | 29.00 | 0.17 | Fixed Income | US Municipal Fixed Income |
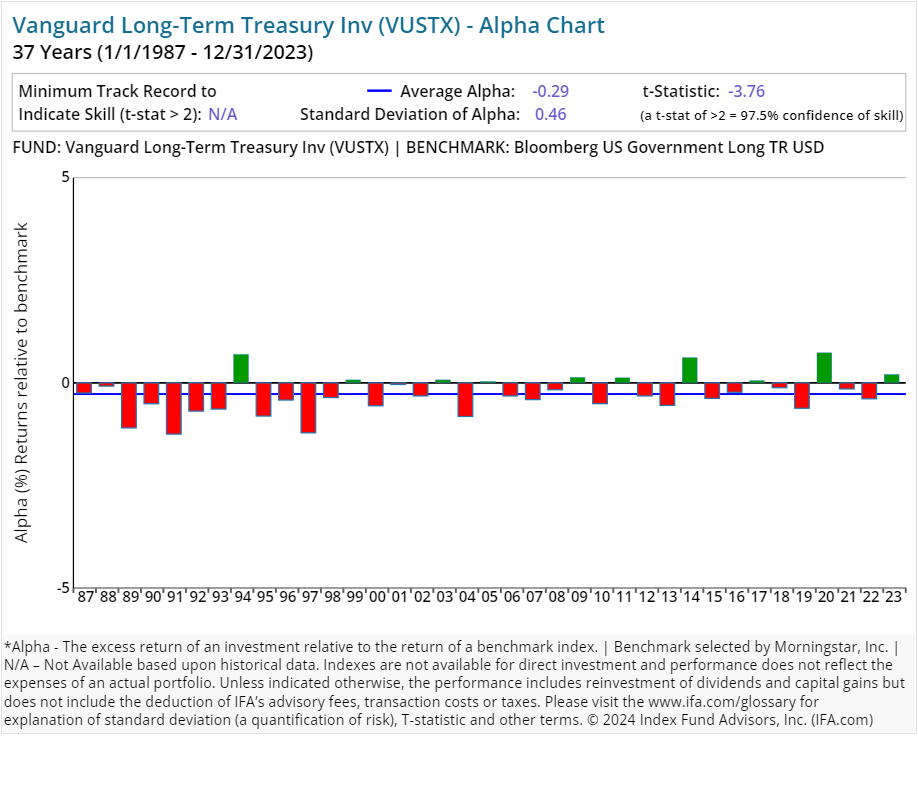
| Vanguard Long-Term Treasury Inv | VUSTX | 136.00 | 0.20 | Fixed Income | US Fixed Income |
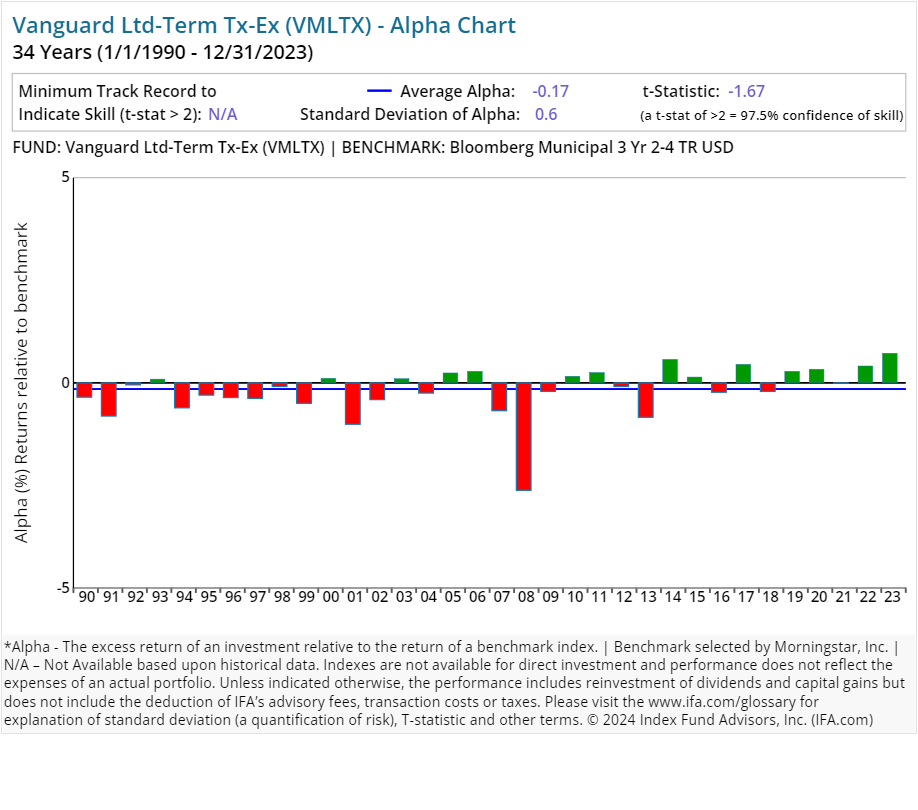
| Vanguard Ltd-Term Tx-Ex | VMLTX | 55.00 | 0.17 | Fixed Income | US Municipal Fixed Income |
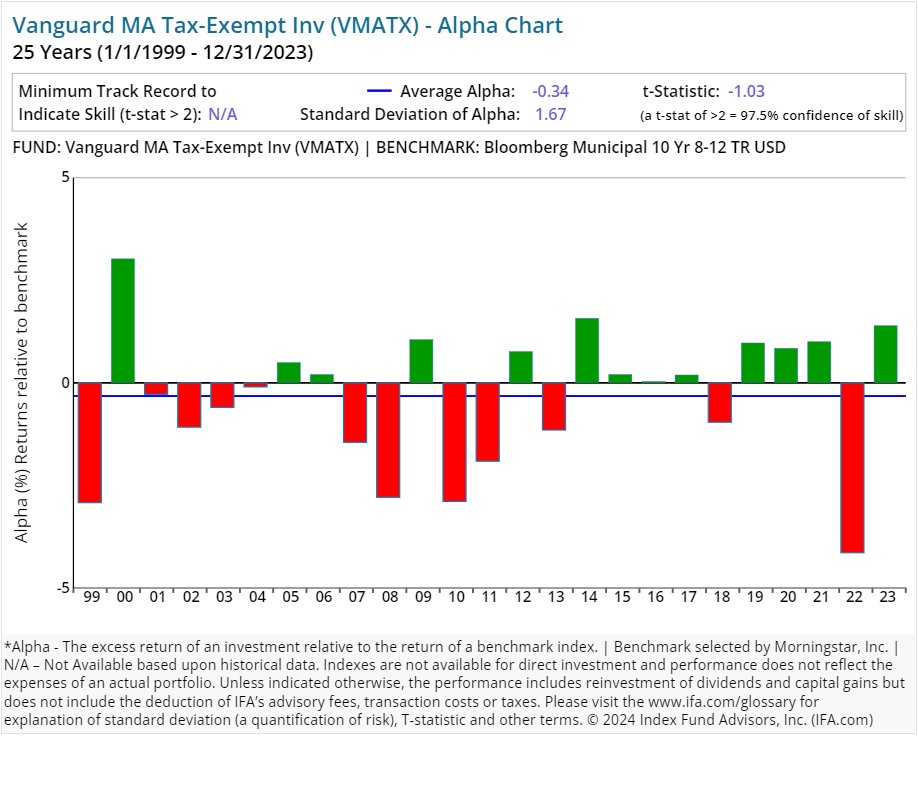
| Vanguard MA Tax-Exempt Inv | VMATX | 77.00 | 0.13 | Fixed Income | US Municipal Fixed Income |
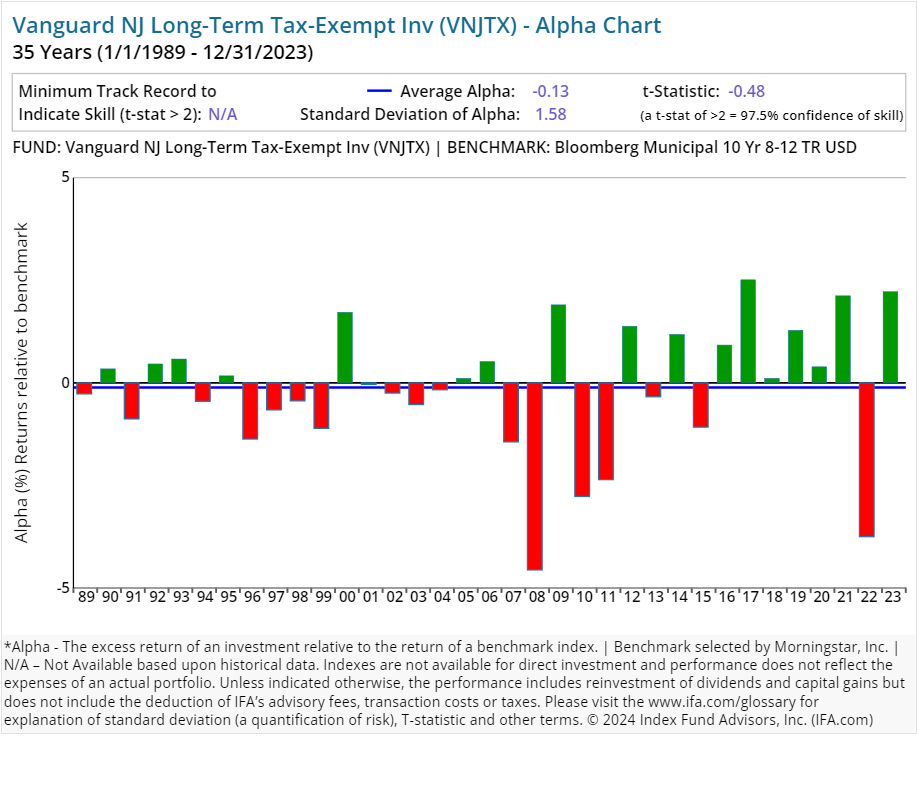
| Vanguard NJ Long-Term Tax-Exempt Inv | VNJTX | 36.00 | 0.17 | Fixed Income | US Municipal Fixed Income |
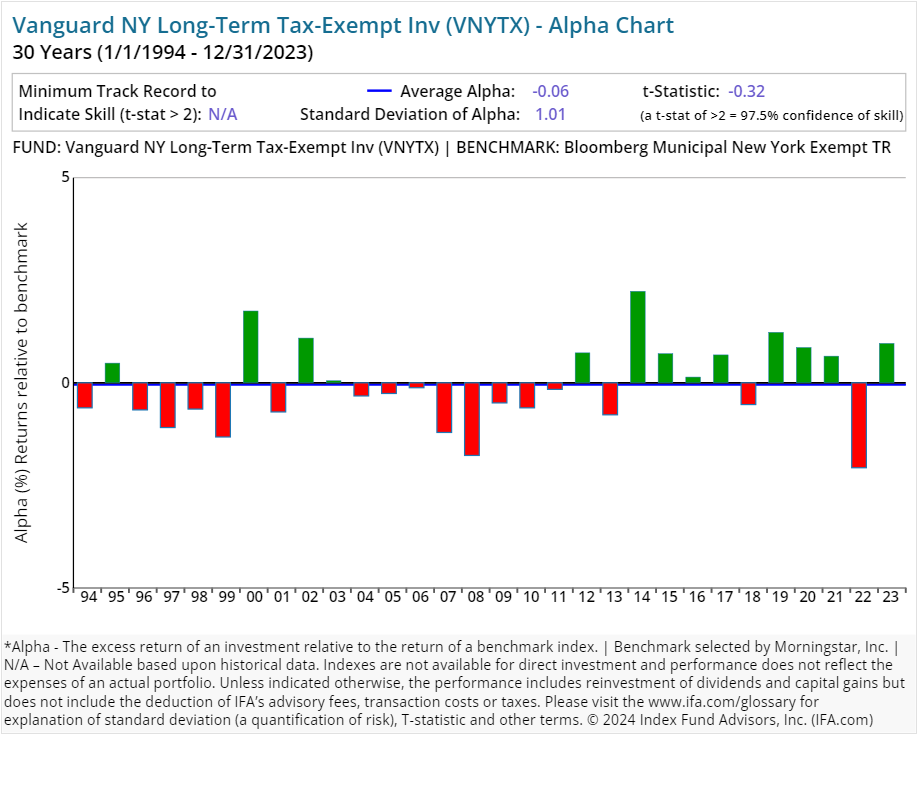
| Vanguard NY Long-Term Tax-Exempt Inv | VNYTX | 100.00 | 0.17 | Fixed Income | US Municipal Fixed Income |
| Vanguard OH Long-Term Tax-Exempt | VOHIX | 60.00 | 0.13 | Fixed Income | US Municipal Fixed Income |
| Vanguard PA Long-Term Tax-Exempt Inv | VPAIX | 38.00 | 0.17 | Fixed Income | US Municipal Fixed Income |
| Vanguard Short-Term Federal Inv | VSGBX | 342.00 | 0.20 | Fixed Income | US Fixed Income |
| Vanguard Short-Term Investment-Grade Inv | VFSTX | 70.00 | 0.20 | Fixed Income | US Fixed Income |
| Vanguard Short-Term Treasury Inv | VFISX | 314.00 | 0.20 | Fixed Income | US Fixed Income |
| Vanguard Ultra Short-Term Tx-Ex | VWSTX | 85.00 | 0.17 | Fixed Income | US Municipal Fixed Income |
| Vanguard Ultra-Short-Term Bond Admiral | VUSFX | 91.00 | 0.10 | Fixed Income | US Fixed Income |
Please read the prospectus carefully to review the investment objectives, risks, charges and expenses of the mutual funds before investing. The Vanguard Group's mutual fund prospectuses are available at: https://personal.vanguard.com/us/literature/prospectus/mutualfunds
On average, an investor who utilized a surviving Vanguard active equity mutual fund strategy experienced an annual expense ratio of 0.38%. Similarly, an investor who utilized an active bond strategy from Vanguard experienced an expense ratio of 0.18% per year. (Again, we're referencing each fund's oldest share class.)
These expenses can have a substantial impact on an investor's overall accumulated wealth if not backed by superior performance. The average turnover ratios for surviving stock and bond active funds from Vanguard were 34.71% and 128.71%, respectively. This implies average holding periods of about 9.32 months to 34.57 months.
By contrast, most index funds have very long holding periods — decades, in fact, thus deafening themselves to the random noise that accompanies short-term market movements and focusing instead on the long-term. Turnover is a cost that is not itemized to the investor but is definitely embedded in the overall performance.
Performance Analysis
The next question we address is whether investors can expect superior performance in exchange for the higher costs associated with Vanguard's implementation of active management. We compare all of its 92 strategies with data for five or more years — including current mutual funds and those no longer in existence — against its Morningstar assigned benchmark to see just how well each has delivered on their perceived value proposition. We also use the oldest share class of each fund, wich sometimes are older than its assigned benchmark. In those cases, comparisons can only be made for the length of time that the benchmark has data available.
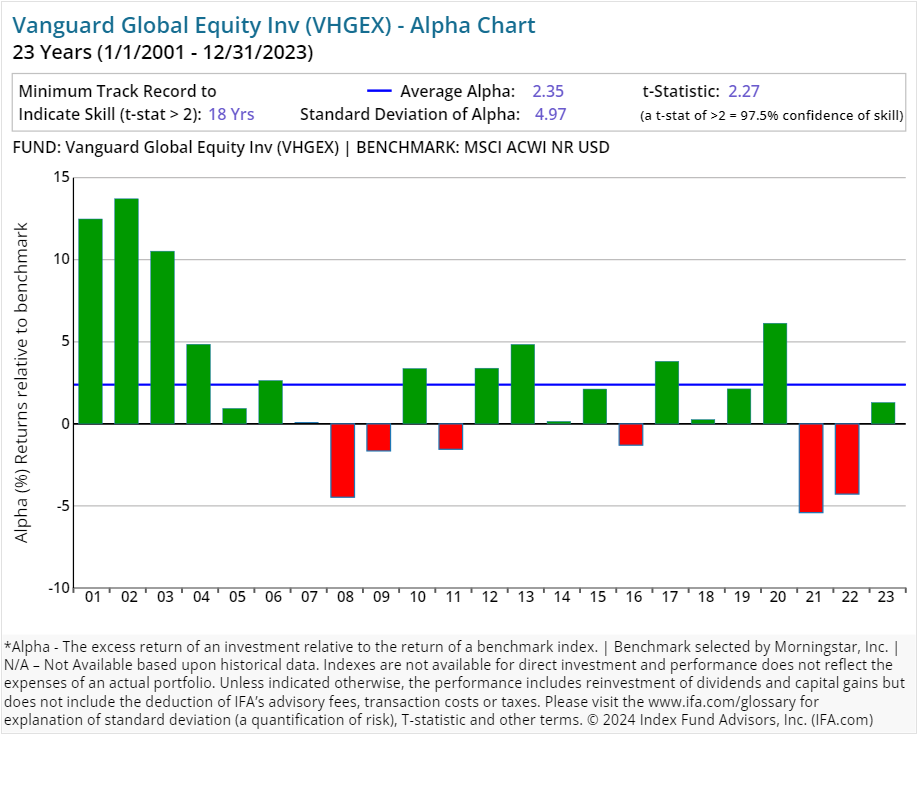
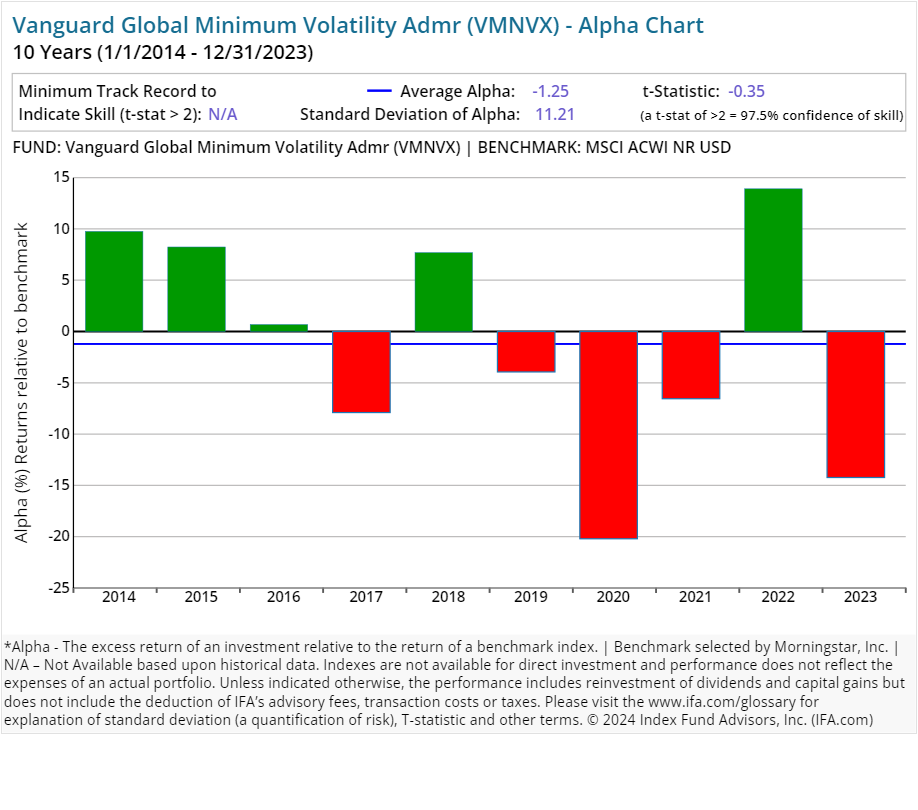
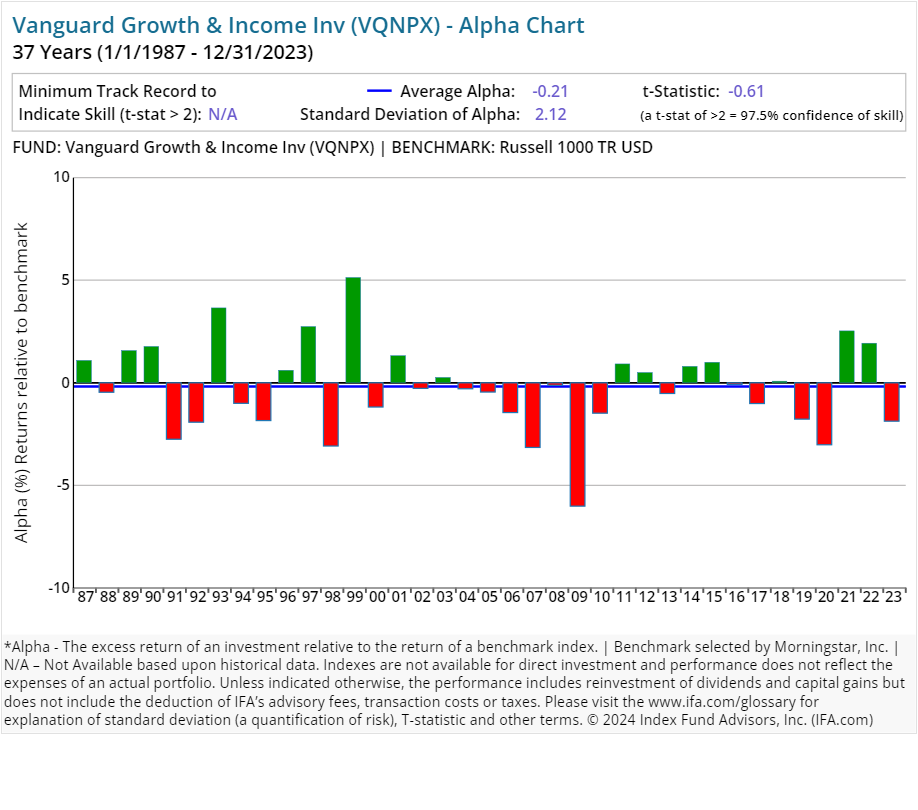
We have included alpha charts for each of their current strategies at the bottom of this article. Here is what we found:
-
63.22% (55 of 87) of these Vanguard funds run by active managers either didn't survive or underperformed their respective benchmarks since inception.
-
42.53% (37 of 87) of Vanguard's actively managed mutual funds outperformed their respective benchmarks since inception by producing a positive alpha.
Here's the real kicker, however:
- 0% (0 of 87) of Vanguard's actively managed funds wound up outperforming their respective benchmarks consistently enough since inception to provide 97.5% confidence that such outperformance could persist (as opposed to being based simply on random outcomes).
So, none of Vanguard's active mutual fund managers were able to deliver statistically significant benchmark outperformance. The inclusion of the statistical significance of alpha is key to this exercise, as it indicates which outcomes are due to a skill that is likely to repeat and those that are more likely due to a random-chance outcome.
Such a finding supports other Deeper Look studies we've conducted looking at different fund families and active managers.
Regression Analysis
How we define or choose a benchmark is extremely important. If we relied solely on commercial indices assigned by Morningstar, then we may form a false conclusion that Vanguard has the "secret sauce" as an active management shop.
Since Morningstar is limited in terms of trying to fit the best commercial benchmark with each fund in existence, there is of course going to be some error in terms of matching up proper characteristics such as average market capitalization or average price-to-earnings ratio.
A better way of controlling these possible discrepancies is to run multiple regressions where we account for the known risks of expected return in the U.S. — i.e., market, size and value — as identified by the Fama/French Three-Factor Model.
For example, if we were to look at all of the U.S.-based strategies from Vanguard that have been around for the past 10 years, we could run multiple regressions to see what each fund's alpha looks like once we control for the multiple betas that are being systematically priced into the overall market.
The chart below displays the average alpha and standard deviation of that alpha for the past 10 years through 2023. Screening criteria include funds with holdings of 90% or greater in U.S. equities and uses the oldest available share classes.
As shown above, three of the mutual funds studied had positive excess returns over the stated benchmarks. At the same time, none produced a statistically significant level of alpha, based on a t-stat of 2.0 or greater. (A review of how to calculate a fund's t-stat can be found at the end of this report — right after the presentations of the Vanguard actively managed mutual funds' individual alpha charts included in this study.)
Conclusion
Like many of the other large active managers, a deep analysis into the performance of the Vanguard family of funds has yielded a not so surprising result: Active management is likely to fail many investors. This is due to market efficiency, costs and increased competition in the financial services sector.
As we always like to remind investors, a more reliable investment strategy for capturing the returns of global markets is to buy, hold and rebalance a globally diversified portfolio of index funds.
Below are the individual alpha charts for Vanguard's actively managed mutual funds. Each of these funds have five years or more of returns data. As we stated earlier, though, some of these funds are older than the Morningstar-assigned benchmarks. In those cases, comparisons can only be made for the length of time that the benchmark has data available.
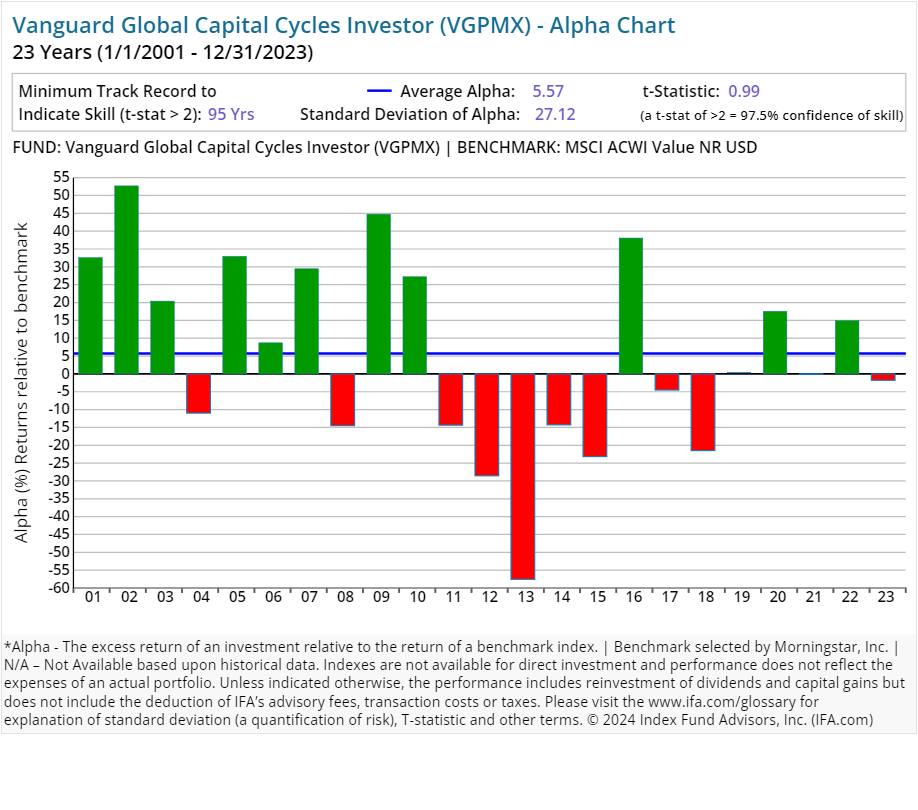
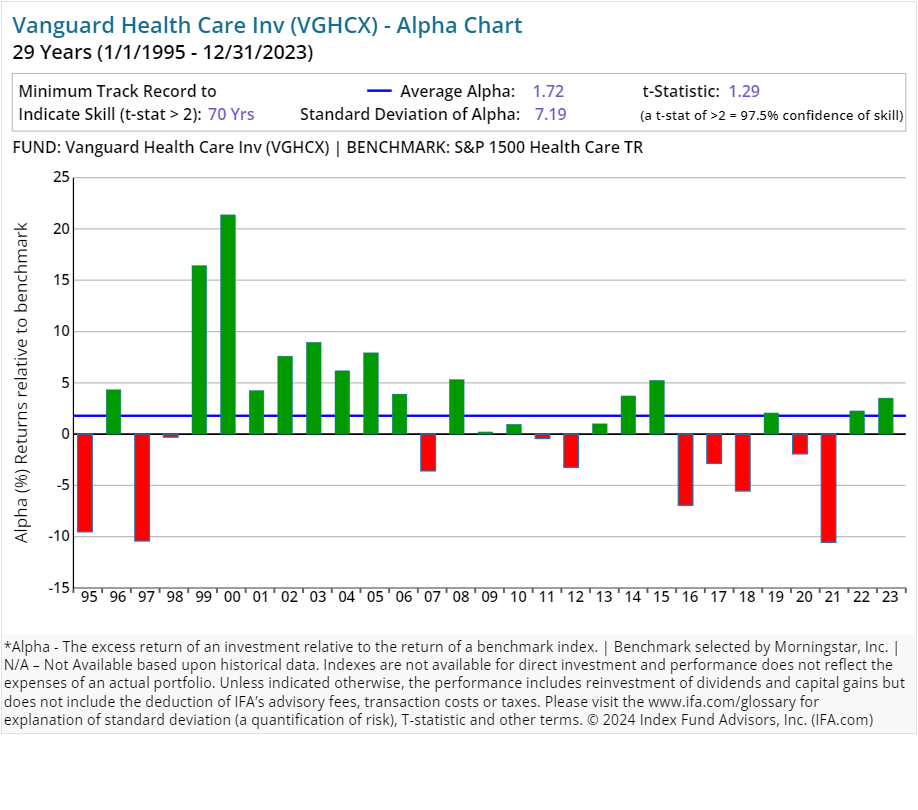
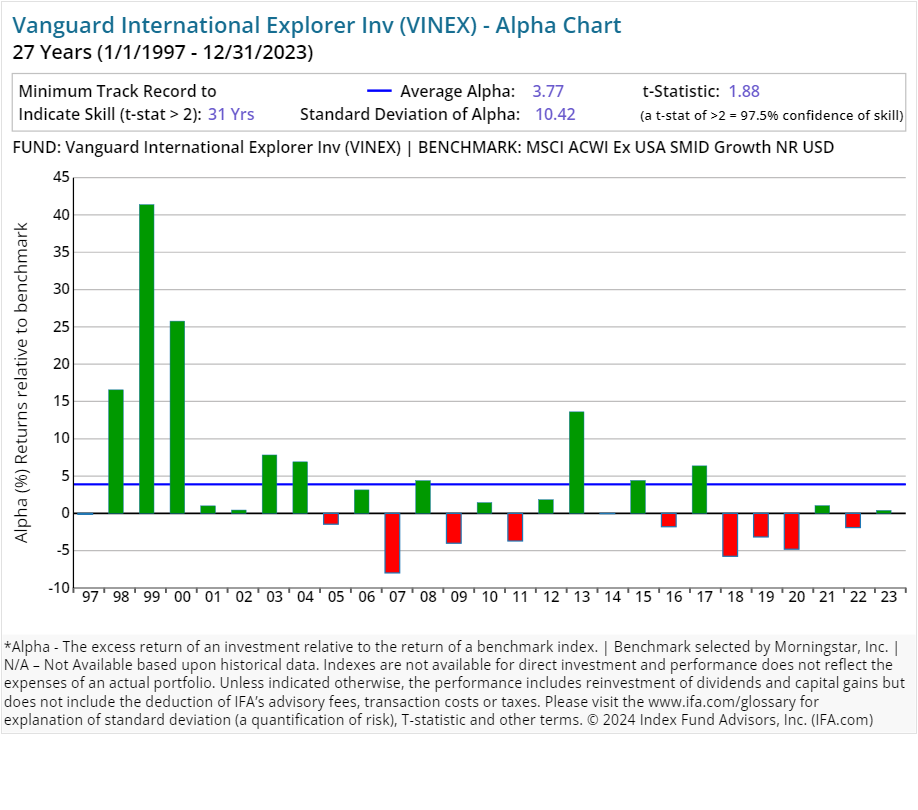
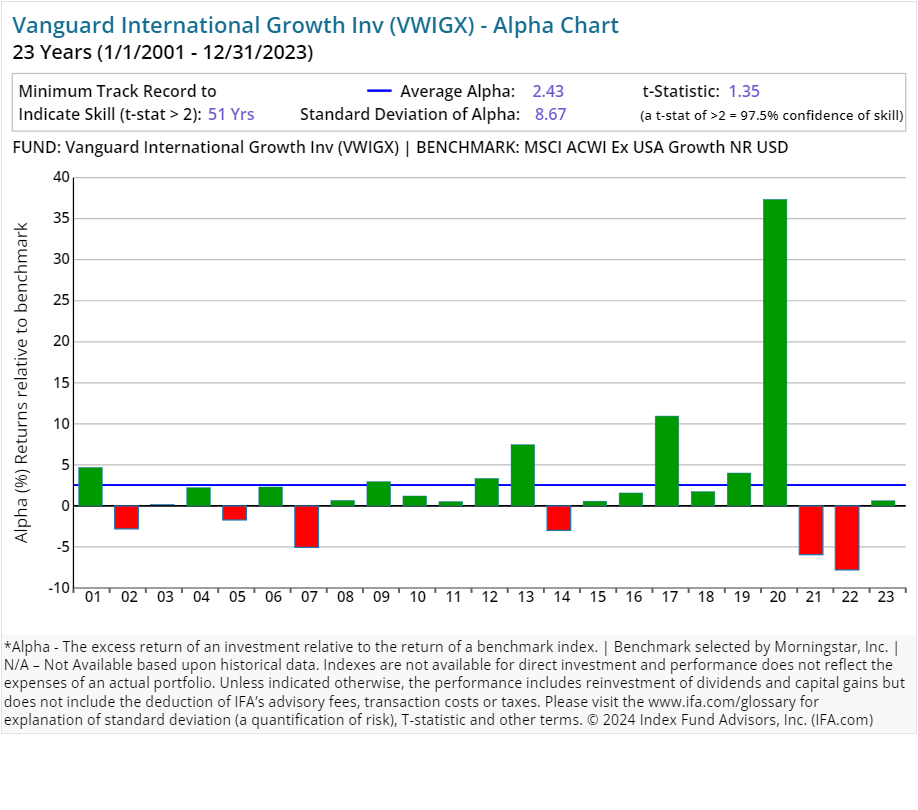
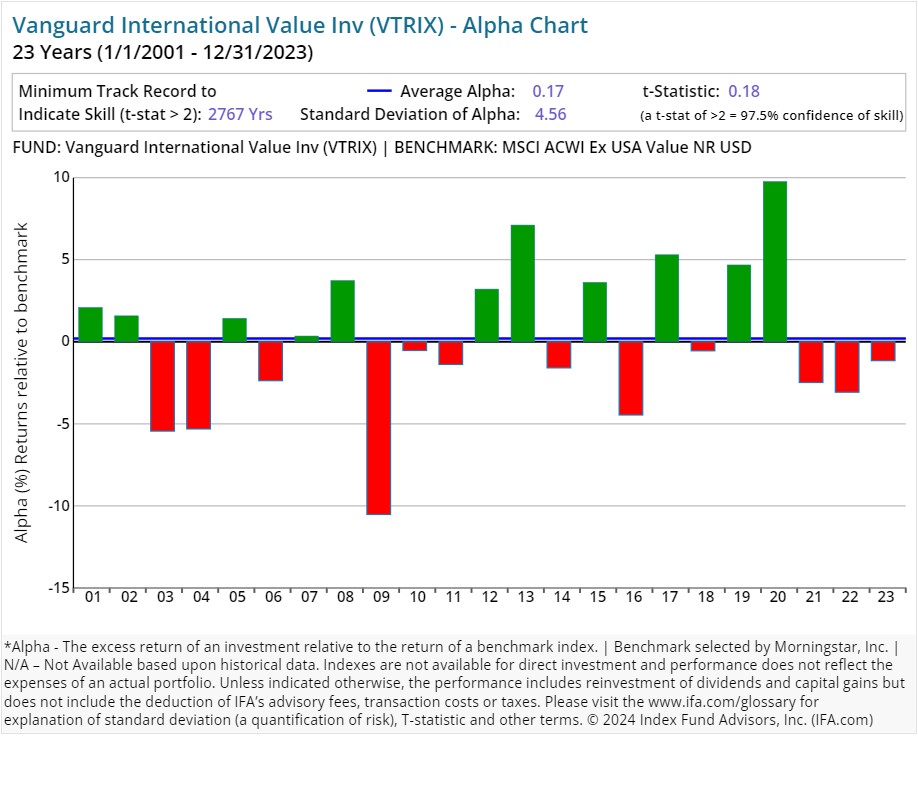
Here is a calculator to determine the t-stat. Don't trust an alpha or average return without one.
The Figure below shows the formula to calculate the number of years needed for a t-stat of 2. We first determine the excess return over a benchmark (the alpha) then determine the regularity of the excess returns by calculating the standard deviation of those returns. Based on these two numbers, we can then calculate how many years we need (sample size) to support the manager's claim of skill.
This is not to be construed as an offer, solicitation, recommendation, or endorsement of any particular security, product or service. There is no guarantee investment strategies will be successful. Investing involves risks, including possible loss of principal. Performance may contain both live and back-tested data. Data is provided for illustrative purposes only, it does not represent actual performance of any client portfolio or account and it should not be interpreted as an indication of such performance. IFA Index Portfolios are recommended based on time horizon and risk tolerance. Take the IFA Risk Capacity Survey (www.ifa.com/survey) to determine which portfolio captures the right mix of stock and bond funds best suited to you. For more information about Index Fund Advisors, Inc, please review our brochure at https://www.adviserinfo.sec.gov/ or visit www.ifa.com.


 X
X