IFA Index Calculator
Retirement Calculator
Target Date Calculator
Retirement Income
College Planning
T-Statistic Calculator
401(k) Calculator
Net Worth
Net Income
Roth IRA Conversion
Fee Calculator
Multi Funds Calculator
Solving real-world problems involves balancing creativity with science. Creativity makes room for innovation, progress, and efficiency while science ensures that the decisions we make are rooted in facts and backed up by data.
Investing is no different.
Index Fund Advisors has embraced the same exact principles when it comes to advising clients on how to invest for the future. Our passive investment philosophy is based on decades of peer-reviewed academic research and empirical analyses while our creativity is inspired by wanting to educate investors and deliver a high-tech, high touch experience.
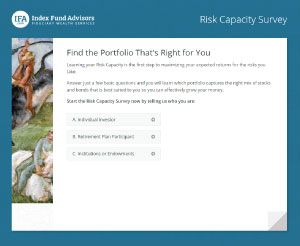
Get started now by taking our IFA Risk Capacity Survey.
Index Fund Advisors is one of the top investment advisors in the country* with over $4 Billion in assets under management across private, institutional, and non-profit clientele. Founded in 1999 by Mark Hebner, the vision of our firm is to bring ideas that developed in the halls of academia into practical application for as many investors as possible. Simply put, we want to replace speculation with an education.
Our service offering includes:
Additional service offerings, some through referrals, include:
At any time, please feel free to contact one of our Advisors with any questions that you may have or for a complimentary portfolio review. We are here to help you meet your investing needs.
By providing a holistic approach to wealth management that is grounded in our duty as a fiduciary, we bring both efficiency and enhancement to your personal finances.
The process begins by asking questions in order to better understand You and what is important to You. From there we start the data collection process so we gain clear insight into your personal finances. After the data has been collected and analyzed, we can then offer our proposed solution and provide details and facts about why we think it is in your best interest.
The investment process begins by understanding the symbiotic relationship between risk and return. One does not exist without the other in the capital markets. By analyzing an investor's 5 Dimensions of Risk Capacity, we can quantify the amount of risk you can afford to take, also known as your risk budget. Once we understand an investor's risk capacity, we can then match them to one of 100 IFA Index Portfolios that exposes the investor to the proper amount of risk.
The process doesn't end once we implement the overall plan. Ongoing maintenance by a team of professionals includes examining opportunities for rebalancing, tax loss harvesting, and applying our systematic Glide Path risk reduction program.
While most of the financial services industry is based on salesmanship, we believe science can provide better solutions for investors. Over six decades of academic research has revealed the following about the capital markets:
In a world of random variables it is extremely important to be able to speak the language of statistics. Index Fund Advisors relies on statistics in:
If markets are efficient and future price movements are random, then we would expect historical market outcomes to follow a normal distribution or “bell curve” over time. In fact, if build a histogram of historical monthly returns for the S&P 500, we see that it approximates a normal distribution. See chart below.
Based on this historical distribution, we can describe what we “expect” to happen going forward based on the historical average. This is our best estimate. We can also describe the variability around this average, understanding that just by random chance alone we should expect severe negative outcomes (October 2008) as well as extreme positive outcomes (January 1975).
Based on our analysis of an investor's risk capacity, we can expose that investor to a normal distribution of outcomes that best matches that capacity for risk. This proper alignment increases the probability that they will be able to stick with long term investment strategy through both the good times and the bad.
Empirical research into stock and bond prices has revealed known dimensions of expected returns. By building a globally diversified portfolio with a tilt towards small cap, value, and high direct profitability stocks yields higher risk-adjusted returns. In other words, these factors are the sources of return, but they do not come without accepting a higher degree of risk. Looking at the historical performance of small cap value stocks versus large cap growth stocks, you can see that small cap value beat large cap growth 89% of the time over 20-year periods. In other words, tilting a portfolio towards small cap value stocks and away from large cap growth stocks will highly yield a more desirable result.
Statistics also allows us to decipher skill from luck in the performance of actively managed mutual funds. Our intent is to shed light on the mere randomness of short term performance that many managers rely on in order to sell their active strategy to investors. Through the use of “alpha” charts, we can quantify whether or not their performance is reliability different from zero through the use of a t-statistic calculation. Below shows the “alpha” chart for the well-known and highly publicized Fidelity ContraFund since inception.
As you can see, there were years in which it outperformed its Morningstar assigned benchmark and years in which in underperformed. Based on the average alpha of 1.66%, its standard deviation of alpha of 7.81%, and its 42 years of historical observations, we can calculate a t-statistic of 1.38, which indicates that we are less than 97.5% confident that this average outperformance is expected to persist in the future. In other words, their average outperformance is not reliability different than zero, which indicates the possibility of historical outperformance due to chance.
We can dig even deeper into the historical performance of an active fund manager by running multiple regressions of their monthly historical performance (dependent variable) against the known dimensions of expected return (independent variables). After controlling what we know is already compensating investors in the market we can accurately decipher whether or not the manager is displaying true skill (alpha). The chart below shows the Fama/French 3 Factor adjusted alphas and standard deviation of alpha for over 1600 individual actively managed mutual funds over the last 20 years.
Each button indicates an individual mutual fund. Buttons that exist in the red region and below the dotted white line indicate funds that have experienced a negative alpha. Buttons that exist in the red region and above the dotted white line indicate funds that have experienced a positive average alpha, but with a t-statistic less than 2 (97.5% confidence interval). Buttons in the green region indicate a positive alpha with a t-statistic greater than 2 (97.5% confidence interval). As you can see most buttons do not show a statistically significant alpha after adjusting for the known dimensions of expected return and the ones that do is less than what is expected by random chance alone (1 in every 40).
 X
X