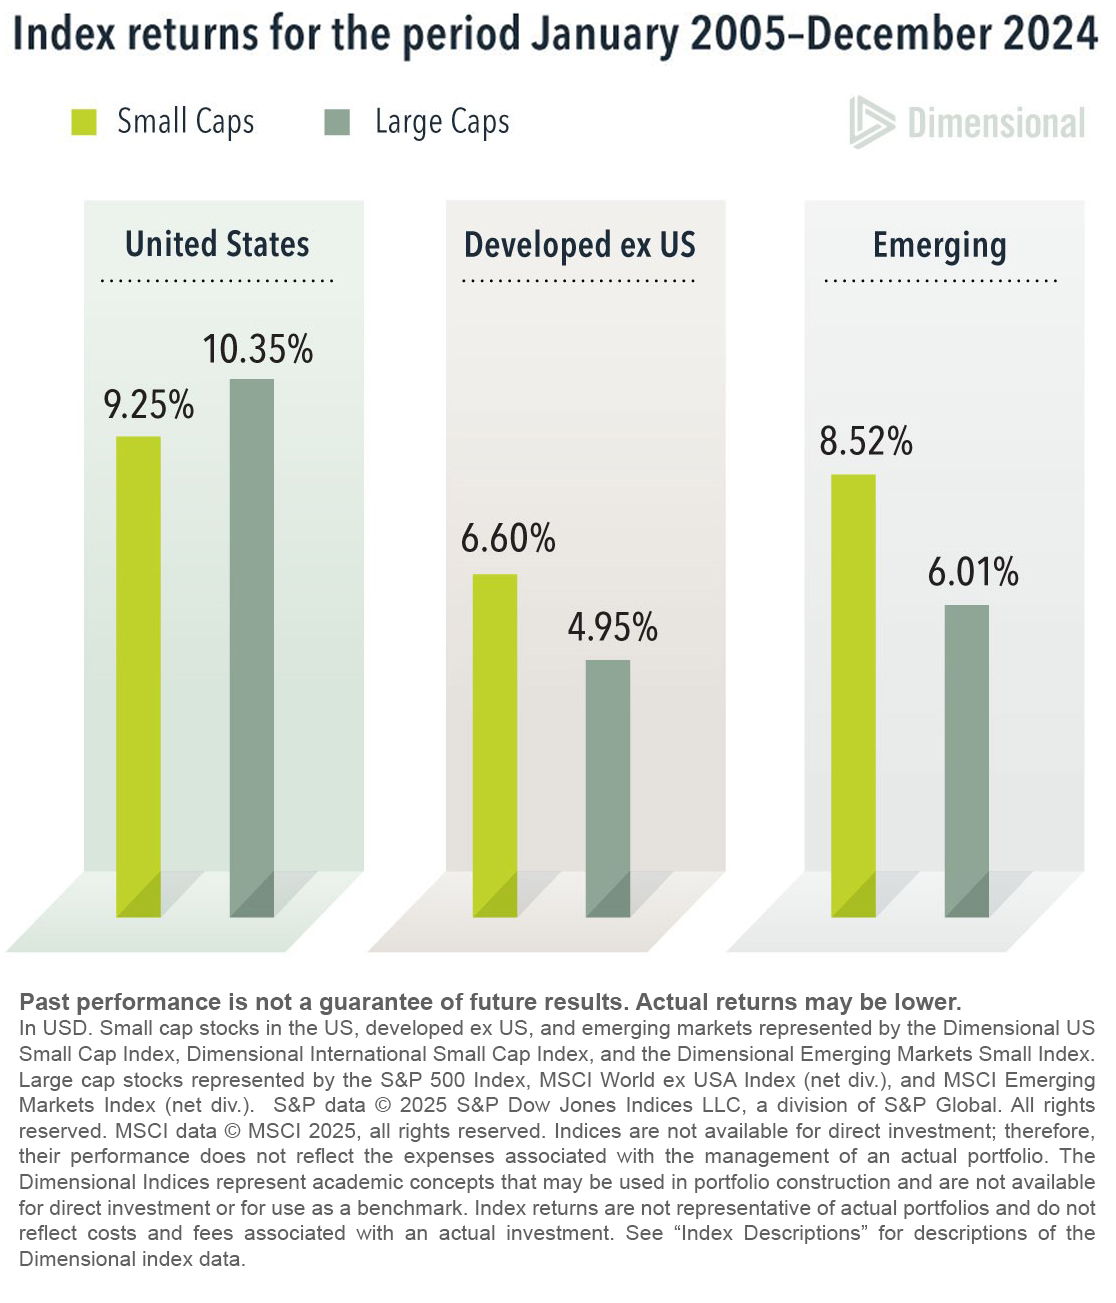
When a return premium disappoints over a long period, investors tend to conduct post-mortem analysis in an attempt to identify the cause. In the case of the size premium, many stories have been proposed for why US small caps underperformed large caps in recent years. The candidate culprits include trends such as private equity activity, interest rate changes, and business cycles.
These theories, however, struggle to explain the strength of the size premium outside the US. Over the last two decades, small caps in developed ex US and emerging markets have outpaced their large cap counterparts. Forces like private equity activity and macroeconomic effects are not unique to the US, so it's not clear that their impacts would show up only in the US.
The likelier explanation for the disappointing US size premium is an unfortunate draw from a noisy distribution of stock returns. The volatility of stocks means there's uncertainty around any of the premiums, even over decade long stretches. So, investors should be careful about reversing their expectations of a return premium after any difficult period.
This article originally appeared in Above the Fray, a weekly newsletter for Dimensional clients. It is republished here with permission of Dimensional Fund Advisors LP. No further republication or redistribution is permitted without the consent of Dimensional Fund Advisors LP.
Index Descriptions
The Dimensional Indices have been retrospectively calculated by Dimensional Fund Advisors LP and did not exist prior to their index inception dates. Accordingly, results shown during the periods prior to each index's index inception date do not represent actual returns of the index. Other periods selected may have different results, including losses. Backtested index performance is hypothetical and is provided for informational purposes only to indicate historical performance had the index been calculated over the relevant time periods. Backtested performance results assume the reinvestment of dividends and capital gains.
Dimensional US Small Cap Index was created by Dimensional in March 2007 and is compiled by Dimensional. It represents a market-capitalization-weighted index of securities of the smallest US companies whose market capitalization falls in the lowest 8% of the total market capitalization of the eligible market. The eligible market is composed of securities of US companies traded on the NYSE, NYSE MKT (formerly AMEX), and Nasdaq Global Market. Exclusions: non-US companies, REITs, UITs, and investment companies. From January 1975 to the present, the index excludes companies with the lowest profitability and highest relative price within the small cap universe. The index also excludes those companies with the highest asset growth within the small cap universe. Profitability is measured as operating income before depreciation and amortization minus interest expense scaled by book. Asset growth is defined as change in total assets from the prior fiscal year to current fiscal year. Source: CRSP and Compustat. The index monthly returns are computed as the simple average of the monthly returns of 12 subindices, each one reconstituted once a year at the end of a different month of the year. The calculation methodology was amended on January 1, 2014, to include profitability as a factor in selecting securities for inclusion in the index. The calculation methodology was amended in December 2019 to include asset growth as a factor in selecting securities for inclusion in the index.
Dimensional International Small Cap Index was created by Dimensional in April 2008 and is compiled by Dimensional. July 1981–December 1993: It Includes non-US developed securities in the bottom 10% of market capitalization in each eligible country. All securities are market capitalization weighted. Each country is capped at 50%. Rebalanced semiannually. January 1994–present: Market-capitalization-weighted index of small company securities in the eligible markets, excluding those with the lowest profitability and highest relative price within their country's small cap universe. The index also excludes those companies with the highest asset growth within their country's small cap universe. Profitability is measured as operating income before depreciation and amortization minus interest expense scaled by book. Asset growth is defined as change in total assets from the prior fiscal year to current fiscal year. The index monthly returns are computed as the simple average of the monthly returns of four subindices, each one reconstituted once a year at the end of a different quarter of the year. Prior to July 1981, the index is 50% UK and 50% Japan. The calculation methodology was amended on January 1, 2014, to include profitability as a factor in selecting securities for inclusion in the index. The calculation methodology was amended in December 2019 to include asset growth as a factor in selecting securities for inclusion in the index.
Dimensional Emerging Markets Small Index was created by Dimensional in April 2008 and is compiled by Dimensional. January 1989–December 1993: Fama/French Emerging Markets Small Cap Index. January 1994–present: Dimensional Emerging Markets Small Cap Index composition: Market-capitalization-weighted index of small company securities in the eligible markets, excluding those with the lowest profitability and highest relative price within their country's small cap universe. The index also excludes those companies with the highest asset growth within their country's small cap universe. Profitability is measured as operating income before depreciation and amortization minus interest expense scaled by book. Asset growth is defined as change in total assets from the prior fiscal year to current fiscal year. The index monthly returns are computed as the simple average of the monthly returns of four subindices, each one reconstituted once a year at the end of a different quarter of the year. Source: Bloomberg. The calculation methodology was amended on January 1, 2014, to include profitability as a factor in selecting securities for inclusion in the index. The calculation methodology was amended in December 2019 to include asset growth as a factor in selecting securities for inclusion in the index.
Disclosures
All expressions of opinion are subject to change. This information is not meant to constitute investment advice, a recommendation of any securities product or investment strategy (including account type), or an offer of any services or products for sale, nor is it intended to provide a sufficient basis on which to make an investment decision. Investors should consult with a financial professional regarding their individual circumstances before making investment decisions. Diversification neither assures a profit nor guarantees against loss in a declining market.


 X
X