For 25 years, 8 months, and 24 days—from March 1, 2000 through November 24, 2025—IFA has collected 6,474 daily returns for IFA Index Portfolio 100. One of the most intuitive ways to explain how markets behave relative to their median return is through the MarketCoin framework: an evidence-based demonstration that markets 'flip' in patterns resembling three independent coin outcomes.
These charts visualize how actual market outcomes compare to:
1. Randomized flips of three coins (Coin • Coin • Coin)
2. Randomized flips of two coins plus the actual market result (Coin • Coin • Market)
3. 1,000 trials simulating 6,474 flips each
4. A data table mapping every real trading day to its Up/Down result relative to the median
Together, they show an essential truth: over long periods, real markets distribute outcomes remarkably close to what unbiased randomness would produce.
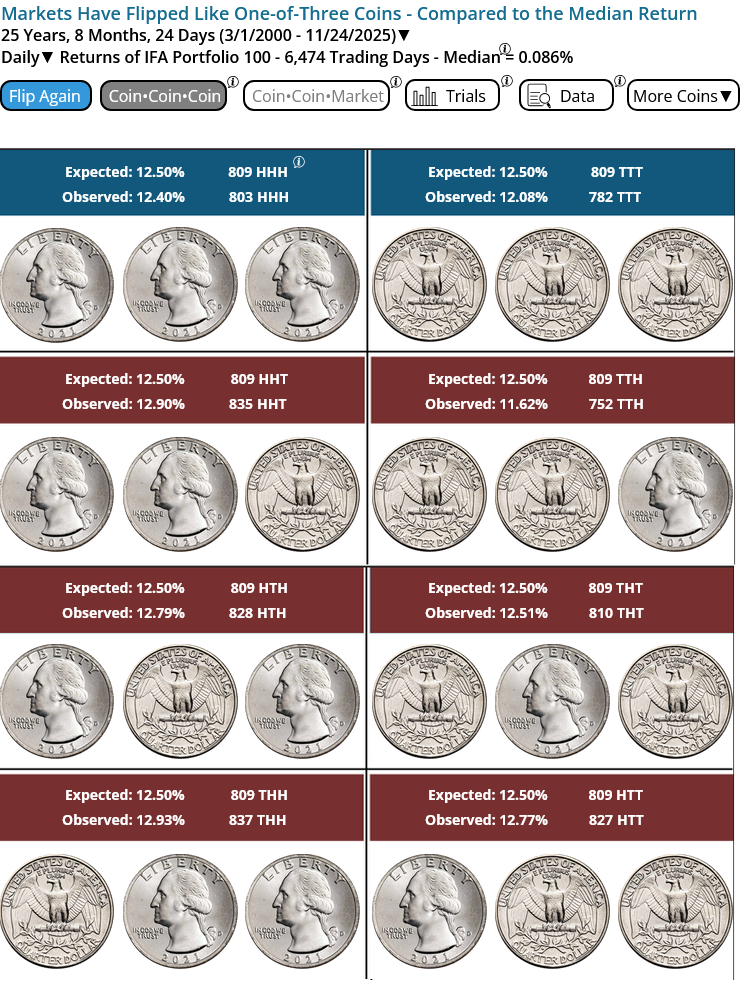
1. Coin/Coin/Coin Panel Using U.S. Quarters
This visualization mirrors the MarketCoin panel, but instead uses U.S. quarters to show the same eight-outcome structure (HHH, HHT, HTH, HTT, THH, THT, TTH, TTT). The purpose is simple: three fair coins should produce each outcome roughly 12.5% of the time.
When mapped against the market's Up/Down results relative to the median, the distribution aligns extremely closely—further illustrating the lack of evidence for predictable patterns.
March 1, 2000 was the first date IFA started collecting daily returns and Jan 1, 1928 for annual and monthly data for Index Portfolios and IFA Indexes. If an Index Portfolio does not specify a S#B#, then it is a S1B1. The median is one of the three types of averages, along with the mean and the mode. The median return for IFA Indexes and Index Portfolios for any time horizon (daily, monthly, or annual) is the middle value when returns are sorted from high to low, splitting the historical data into 50% above and 50% below the median. Observed coin flips have a 50-50 chance of landing on heads (H) or tails (T). The randomized MarketCoin and the actual returns of the IFA Index Portfolios and IFA Indexes have had a 50-50 chance of Up (U) or Down (D) relative to the median return as shown on the bar chart option for trials. The outcomes for coins are generated using an unbiased randomization process and are purely for entertainment purposes. In the Coin/Coin/Market mode, flips are compared to actual daily, monthly or annual returns of IFA Index Portfolios or IFA Indexes relative to the median return over that period. See IFA Indexes descriptions at ifa.com/disclosures/index-data. This tool is for entertainment and educational use only and is not designed for or capable of making financial, market, or investment predictions. No data from the tool's use is collected or stored. For HYPOTHETICAL back-tested performance data shown in this chart, see ifabt.com. IFA Index Portfolios are labeled with numbers that refer to the percentage of stock indexes in the asset allocation, as opposed to the allocation of bond indexes. For example, an IFA Index Portfolio 90 is 90% IFA stock indexes and 10% IFA bond indexes. For more, go to indexdescriptions.com. The HYPOTHETICAL back-tested performance of the IFA Index Portfolios was achieved with the benefit of hindsight; it does not represent actual investment strategies for the entire period; and it does not reflect the impact that economic and market factors may have had on the advisor's decision making if the advisor were actually managing client money during the period shown. The performance of index portfolios does reflect the maximum annual advisory fee of 0.9%. IFA Index Portfolios do reflect the deduction of mutual fund fees, include reinvestment of dividends, capital gains, and includes the deduction of IFA advisory fees, but does not include transaction costs or taxes, which if included, would lower performance. The IFA Index Portfolios were created by IFA in 2000. Past performance does not guarantee future results. Performance figures may contain both live and HYPOTHETICAL back-tested data. All data, including performance data, is provided for illustrative purposes only, it does not represent actual performance of any client portfolio or account and it should not be interpreted as an indication of such performance. *Fractional Days are rounded.
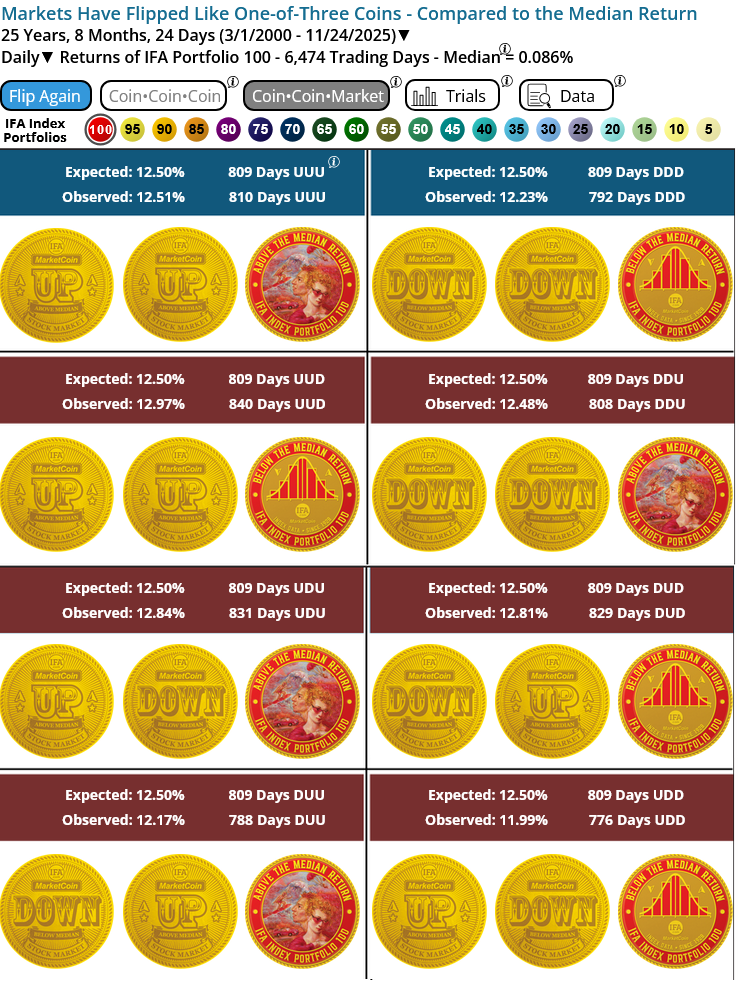
2. Coin/Coin/Market and Coin/Coin/Coin Outcome Panels
These two major visuals display the eight possible three-outcome sequences—UUU, UUD, UDU, UDD, DUU, DUD, DDU, and DDD—that result when each day's return is classified as above or below the median daily return of 0.085% for IFA Index Portfolio 100.
Expected frequency: 12.5% of days (~809 days)
Observed frequency: very close to expectation
March 1, 2000 was the first date IFA started collecting daily returns and Jan 1, 1928 for annual and monthly data for Index Portfolios and IFA Indexes. If an Index Portfolio does not specify a S#B#, then it is a S1B1. The median is one of the three types of averages, along with the mean and the mode. The median return for IFA Indexes and Index Portfolios for any time horizon (daily, monthly, or annual) is the middle value when returns are sorted from high to low, splitting the historical data into 50% above and 50% below the median. Observed coin flips have a 50-50 chance of landing on heads (H) or tails (T). The randomized MarketCoin and the actual returns of the IFA Index Portfolios and IFA Indexes have had a 50-50 chance of Up (U) or Down (D) relative to the median return as shown on the bar chart option for trials. The outcomes for coins are generated using an unbiased randomization process and are purely for entertainment purposes. In the Coin/Coin/Market mode, flips are compared to actual daily, monthly or annual returns of IFA Index Portfolios or IFA Indexes relative to the median return over that period. See IFA Indexes descriptions at ifa.com/disclosures/index-data. This tool is for entertainment and educational use only and is not designed for or capable of making financial, market, or investment predictions. No data from the tool's use is collected or stored. For HYPOTHETICAL back-tested performance data shown in this chart, see ifabt.com. IFA Index Portfolios are labeled with numbers that refer to the percentage of stock indexes in the asset allocation, as opposed to the allocation of bond indexes. For example, an IFA Index Portfolio 90 is 90% IFA stock indexes and 10% IFA bond indexes. For more, go to indexdescriptions.com. The HYPOTHETICAL back-tested performance of the IFA Index Portfolios was achieved with the benefit of hindsight; it does not represent actual investment strategies for the entire period; and it does not reflect the impact that economic and market factors may have had on the advisor's decision making if the advisor were actually managing client money during the period shown. The performance of index portfolios does reflect the maximum annual advisory fee of 0.9%. IFA Index Portfolios do reflect the deduction of mutual fund fees, include reinvestment of dividends, capital gains, and includes the deduction of IFA advisory fees, but does not include transaction costs or taxes, which if included, would lower performance. The IFA Index Portfolios were created by IFA in 2000. Past performance does not guarantee future results. Performance figures may contain both live and HYPOTHETICAL back-tested data. All data, including performance data, is provided for illustrative purposes only, it does not represent actual performance of any client portfolio or account and it should not be interpreted as an indication of such performance. *Fractional Days are rounded.
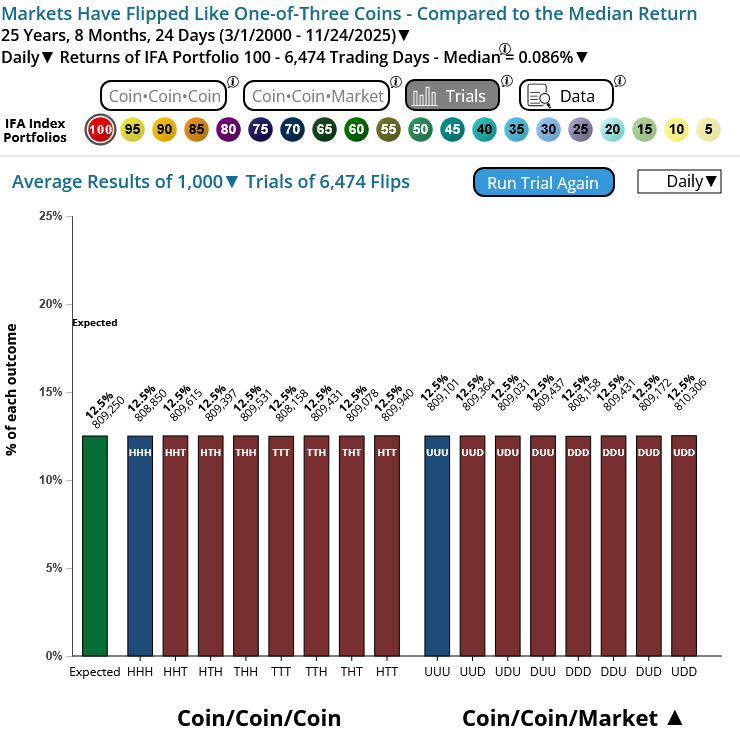
3. Trials Chart — 1,000 Simulated Experiments
This chart displays the results of 1,000 simulation runs, each consisting of 6,474 flips. Each bar shows how often one of the eight outcomes appears in each trial.
The pattern is unmistakable: all outcomes cluster around 12.5%, matching theory precisely. Real market outcomes, when categorized similarly, fall directly within this distribution cloud.
March 1, 2000 was the first date IFA started collecting daily returns and Jan 1, 1928 for annual and monthly data for Index Portfolios and IFA Indexes. If an Index Portfolio does not specify a S#B#, then it is a S1B1. The median is one of the three types of averages, along with the mean and the mode. The median return for IFA Indexes and Index Portfolios for any time horizon (daily, monthly, or annual) is the middle value when returns are sorted from high to low, splitting the historical data into 50% above and 50% below the median. Observed coin flips have a 50-50 chance of landing on heads (H) or tails (T). The randomized MarketCoin and the actual returns of the IFA Index Portfolios and IFA Indexes have had a 50-50 chance of Up (U) or Down (D) relative to the median return as shown on the bar chart option for trials. The outcomes for coins are generated using an unbiased randomization process and are purely for entertainment purposes. In the Coin/Coin/Market mode, flips are compared to actual daily, monthly or annual returns of IFA Index Portfolios or IFA Indexes relative to the median return over that period. See IFA Indexes descriptions at ifa.com/disclosures/index-data. This tool is for entertainment and educational use only and is not designed for or capable of making financial, market, or investment predictions. No data from the tool's use is collected or stored. For HYPOTHETICAL back-tested performance data shown in this chart, see ifabt.com. IFA Index Portfolios are labeled with numbers that refer to the percentage of stock indexes in the asset allocation, as opposed to the allocation of bond indexes. For example, an IFA Index Portfolio 90 is 90% IFA stock indexes and 10% IFA bond indexes. For more, go to indexdescriptions.com. The HYPOTHETICAL back-tested performance of the IFA Index Portfolios was achieved with the benefit of hindsight; it does not represent actual investment strategies for the entire period; and it does not reflect the impact that economic and market factors may have had on the advisor's decision making if the advisor were actually managing client money during the period shown. The performance of index portfolios does reflect the maximum annual advisory fee of 0.9%. IFA Index Portfolios do reflect the deduction of mutual fund fees, include reinvestment of dividends, capital gains, and includes the deduction of IFA advisory fees, but does not include transaction costs or taxes, which if included, would lower performance. The IFA Index Portfolios were created by IFA in 2000. Past performance does not guarantee future results. Performance figures may contain both live and HYPOTHETICAL back-tested data. All data, including performance data, is provided for illustrative purposes only, it does not represent actual performance of any client portfolio or account and it should not be interpreted as an indication of such performance. *Fractional Days are rounded.
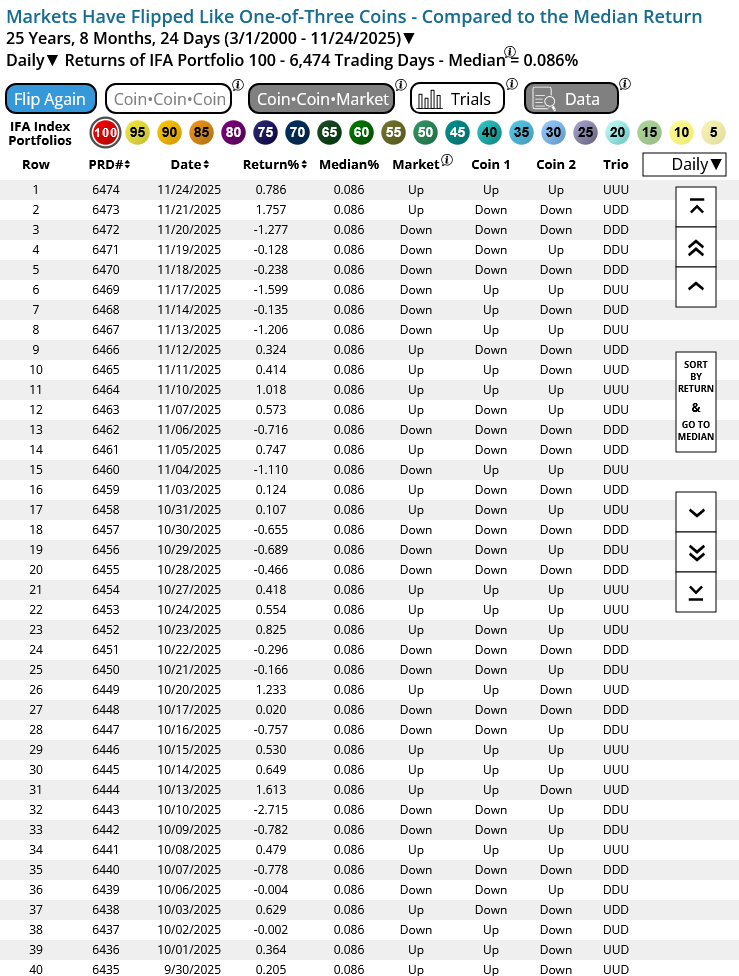
4. Daily Data Table
This table shows the market's 6,474 real daily results alongside the randomized Coin 1 and Coin 2 flips and the corresponding three-outcome sequence.
The table reveals no pattern, no autocorrelation, and no structure that could be exploited for prediction. The independence of daily movement aligns with findings in academic research on market randomness.
March 1, 2000 was the first date IFA started collecting daily returns and Jan 1, 1928 for annual and monthly data for Index Portfolios and IFA Indexes. If an Index Portfolio does not specify a S#B#, then it is a S1B1. The median is one of the three types of averages, along with the mean and the mode. The median return for IFA Indexes and Index Portfolios for any time horizon (daily, monthly, or annual) is the middle value when returns are sorted from high to low, splitting the historical data into 50% above and 50% below the median. Observed coin flips have a 50-50 chance of landing on heads (H) or tails (T). The randomized MarketCoin and the actual returns of the IFA Index Portfolios and IFA Indexes have had a 50-50 chance of Up (U) or Down (D) relative to the median return as shown on the bar chart option for trials. The outcomes for coins are generated using an unbiased randomization process and are purely for entertainment purposes. In the Coin/Coin/Market mode, flips are compared to actual daily, monthly or annual returns of IFA Index Portfolios or IFA Indexes relative to the median return over that period. See IFA Indexes descriptions at ifa.com/disclosures/index-data. This tool is for entertainment and educational use only and is not designed for or capable of making financial, market, or investment predictions. No data from the tool's use is collected or stored. For HYPOTHETICAL back-tested performance data shown in this chart, see ifabt.com. IFA Index Portfolios are labeled with numbers that refer to the percentage of stock indexes in the asset allocation, as opposed to the allocation of bond indexes. For example, an IFA Index Portfolio 90 is 90% IFA stock indexes and 10% IFA bond indexes. For more, go to indexdescriptions.com. The HYPOTHETICAL back-tested performance of the IFA Index Portfolios was achieved with the benefit of hindsight; it does not represent actual investment strategies for the entire period; and it does not reflect the impact that economic and market factors may have had on the advisor's decision making if the advisor were actually managing client money during the period shown. The performance of index portfolios does reflect the maximum annual advisory fee of 0.9%. IFA Index Portfolios do reflect the deduction of mutual fund fees, include reinvestment of dividends, capital gains, and includes the deduction of IFA advisory fees, but does not include transaction costs or taxes, which if included, would lower performance. The IFA Index Portfolios were created by IFA in 2000. Past performance does not guarantee future results. Performance figures may contain both live and HYPOTHETICAL back-tested data. All data, including performance data, is provided for illustrative purposes only, it does not represent actual performance of any client portfolio or account and it should not be interpreted as an indication of such performance. *Fractional Days are rounded.
Here is the interactive chart you can investigate yourself.
Foundational Quotes on Market Randomness
Louis Bachelier (1900)
"Past, present, and future prices appear to form a sequence of independent variables."
"The mathematical expectation of the speculator is zero."
Maurice Kendall (1953)
"The series looks like a wandering one, almost as if once a week the price were determined by drawing lots."
Paul Samuelson (1965)
"There is no way of making an expected profit by extrapolating past changes in the price of a stock."
"A market where price changes are unpredictable is consistent with rational behavior."
Eugene F. Fama (1970)
"In an efficient market, prices fully reflect all available information."
"New information is unpredictable, so price changes must be unpredictable."
Benoit Mandelbrot (1963)
"Price changes are not predictable; they follow a random process."
"Markets are far wilder than the classical models assume."
Conclusion
Across 6,474 real trading days, market movements along with two fair coins behave indistinguishably from flipping three fair coins. This reinforces the foundation of index investing: discipline, diversification, patience, and staying the course. The MarketCoin framework makes this truth visual, intuitive, and academically grounded.
Disclosure:
Market behavior is inherently uncertain, and randomness models are illustrative only. Investing involves risk, including the possible loss of principal. For complete information on IFA portfolios, including methodology and risks, please refer to IFA.com.


 X
X