Market randomness refers to the observation that consistently predicting tomorrow's market direction from today's information is difficulat an unreliable. While this may seem counterintuitive, the reason is straightforward: price movements may reflect new information, and new information arrives unpredictably. Thus, the market often behaves the way Louis Bachelier first envisioned in 1900—a mathematical diffusion process driven by random shocks -- though real-word returns can deviate from these simplified models.
This apparant randomness is not disorder, but seemingly a byproduct of efficiency.
The Efficient Market Hypothesis (EMH): Why Prices Must Be Random
 The Efficient Market Hypothesis, formalized and empirically tested by Eugene F. Fama (1965, 1970), states that:
-
Market prices incorporate widely available (publid) information.
-
Only new or newly interpreted, unpredictable information moves prices.
-
Therefore, future price changes must be unpredictable.
Fama demonstrated this through statistical tests—including runs tests—showing that sequences of price changes exhibit no systematic patterns. In his words, properly anticipated prices "fluctuate randomly."
This is the theoretical foundation of market randomness.
The Random Walk Theory: The Statistical Model of EMH
Random Walk Theory provides the mathematical description of how unpredictable price changes behave. If markets incorporate information efficiently, then:
-
Price changes are independent from one period to the next.
-
The best prediction of tomorrow's price is often modeled as today's price, plus a random movement.
-
Long-term returns have historically formed a more stable distribution, even though short-term movements are random.
This framework was recognized by:
-
Louis Bachelier (1900): the market behaves like a diffusion process.
-
Maurice Kendall (1953): stock prices show "no predictable pattern."
-
Paul Samuelson (1965): properly anticipated prices "must follow a random walk."
-
Alfred Cowles (1933–1960s): professional forecasters showed no ability to reliably beat randomness.
-
Eugene Fama (1965, 1970): formalized EMH with rigorous testing.
- Mark Hebner (1999–Present): Developed educational tools such as MarketCoin and Galton Board demonstrations that help illustrate academic theories for investors for educational purposes.
Together, these works form the backbone of modern index investing.
Mark Hebner's MarketCoin: A Practical Demonstration of Market Randomness

To make market randomness observable, Mark Hebner developed the MarketCoin experiment—an intuitive and empirical illustration of whether real market returns behave like independent coin flips.
How It Works
-
For each of 6,530 (chart below updates daily) trading days, flip a fair digital coin (Up/Down).
-
Classify each day's actual return as Up or Down based on the median return of 0.086%.
-
Compare the coin outcome to the market outcome, producing four buckets:
UU, UD, DU, DD. -
Repeat the full 6,530-day experiment 1,000 times, then average the results.
Result
If market returns relative to the median are truly independent, each of the four buckets should occur approximatlely 25% of the time—just like pairing two fair coins.
What We Found
Across multiple scales:
-
6,530 days × 1,000 trials
-
1,177 months × 10,000 trials
-
98 years × 100,000 trials
…the results tend to converge to about 25% per bucket.
This provides an educational illustration suggesting that the market's up/down movements can appear consistent with a random process—not because markets are inefficient, but because they are often described as efficient that new information cannot be predicted.
Interpreting "25% in Each Bucket"
Why 25%? The logic is pure coin-flip mathematics.
-
One fair coin (market direction).
-
One fair coin (MarketCoin).
-
Four possible outcomes.
-
Over large samples, each outcome → 25%.
Historical data has at times appeared consistent with this coin-based benchmark can be interpreted as supporting the weak-form EMH and aligns with the findings of Bachelier, Kendall, Samuelson, Cowles, Mandelbrot, Fama and now Hebner with the IFA MarketCoin.
Runs Tests and Coin-Flip Intuition
A runs test evaluates whether sequences of Up and Down days show more streaks (UUU or DDD) or reversals (UD or DU) than would be expected under randomness.
Fama (1965) used runs tests extensively and found:
"The sequence of price changes is very close to that generated by a fair game."
The MarketCoin experiment naturally mirrors this structure because:
-
UU and DD measure streaks
-
UD and DU measure reversals
-
Equal frequencies → no predictable patterns
This helps investors immediately see what Fama and Kendall discovered using statistics.
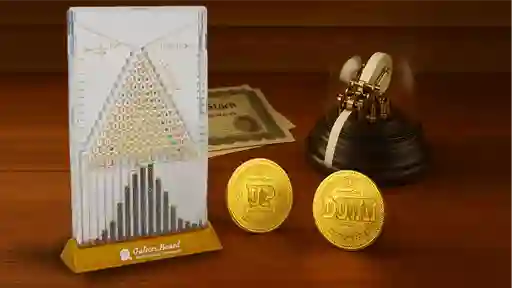
The Galton Board: A Visual Model of Random Walks
If MarketCoin is the experiment, the Galton Board is the picture.
A Galton Board drops beads through rows of pegs, sending each bead left or right—just like a sequence of coin flips. The result is:
-
Unpredictable micro-paths
-
A highly predictable macro-distribution (the bell curve)
This mirrors how:
-
daily market returns look random, but
-
long-term distributions (e.g., 30-year returns) have appeared more stable in historical data, and therefore statistically reliable.
Mark Hebner's Galton Board demonstrations bring this to life visually, showing investors the direct connection between randomness, independence, and long-term order.
Conclusion: Why This Matters for Investors
The combined academic, mathematical, empirical, and visual evidence all lead to the same conclusion.
Markets look random because they are fairly priced, like a coin or a bead in the Galton Board.
Market randomness is not a flaw; it is a sign that markets are working and healthy—evidence that prices reflect all available information. The MarketCoin and the Galton Board give investors a tangible way to see this for themselves, reinforcing the case for disciplined, low-cost, globally diversified index investing.
Disclosure:
Additional information is available by reviewing IFA's ADV Brochure at https://www.adviserinfo.sec.gov/ or visiting www.ifa.com."


 X
X